After I posted the summary data on owner occupied mortgages yesterday, including the latest estimated probability of 30-day default, I was asked if I could estimate the relative value-at-risk by state represented by these numbers, with a focus on WA.
Hi Martin, It looks as if WA is in some serious trouble. Do you know if the big banks are very exposed there? Thanks
In today’s post I will try to answer this question. Bear in mind that there is more than $1 trillion owing on owner occupied residential mortgages. We can apply the estimated PD30 (30 Day Default Probability) values to each mortgage pool and so estimate the value of loans at risk by state.
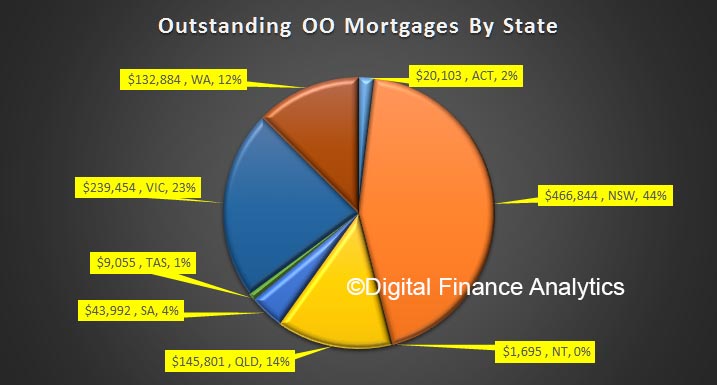
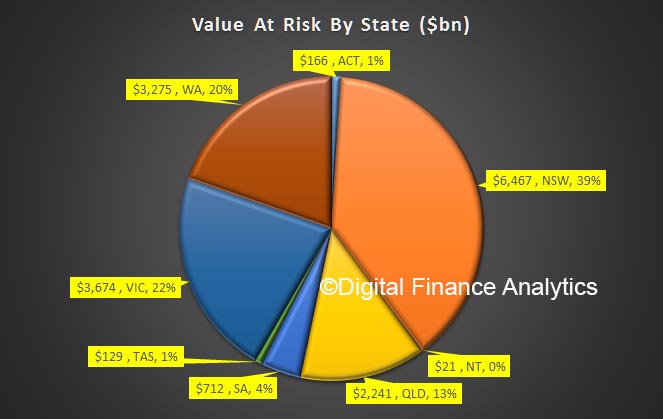
The charts below displays the output from the analysis. Each state is shown separately, together with its relative share of outstanding owner occupied mortgages by value – as a percentage of the total. But we also show the value – in billions – of loans at potential default risk and their relative distribution.
For example, in NSW, whilst around 30% of all households who have a mortgage live there, the total value of those mortgages is worth around $467 billion, which is 44% of the total national OO mortgage pool. From our modelling, $6.5 billion are at PD30 risk, which is 39% of the risk value pool.
But now compare this with WA. Around 12% of all households who have a mortgage live there. The total value of these mortgages is worth around $133 billion, which is also 12% of the total mortgage pool. But from our modelling, $3.3 billion are at PD30 risk, which is 20% of the risk value pool.

 This highlights the relative higher risks in the WA mortgage portfolio, which is why lenders are being more cautious. Not all lenders are equally exposed, indeed some are targeting NSW and VIC, but WA is clearly a problem area in terms of risk assessment and management.
Any changes to the lending standards or capital rules needs to take account of the different characteristics in the various local markets. Lenders need to calibrate their risk models accordingly.
