More evidence that negative gearing should be revised was contained in a preliminary paper released recently, having been discussed with the RBA in November. Melbourne University researchers Yunho Cho, Shuyun May Li, and Lawrence Uren suggest their modelling shows that the removal of negative gearing would potentially lift homeownership rates by 5.5%, and that “renters and owner-occupiers are winners, but landlords, especially young with high earning landlords, lose”. They stress this is preliminary, but nevertheless it adds to the weight of evidence that negative gearing should be reformed. Their data also again shows how a small number of affluent landlords are benefiting disproportionately at the expense of the tax payer .
The welfare analysis suggests that eliminating negative gearing would lead to an overall welfare gain of 1.5 percent for the Australian economy in which 76 percent of households become better off.
This is significant, given the annual government expenditure
on negative gearing is estimated to be $2 billion, or 5 percent of the budget deficit for the year 2016. Eliminating negative gearing would reduce housing investments and house prices, and increase the average home ownership rate. The supply of rental properties falls, rents increase but only marginally because its demand also falls.
The data in their report also underlines the significant growth in property investors, and the consequential rise in mortgage lending and negative gearing.
The left panel in Figure 1 shows that the proportion of landlords has risen by around 50 percent over the last two decades. The right panel in Figure 1 shows that the real housing loan approvals have also increased dramatically during the same period. In particular, the loan approvals for investment purposes increased more sharply than that for owner-occupied purposes, surpassing it by around $0.5 billion in the early 2010s.
Figure 2 documents the proportion negatively geared landlords and the aggregate net rental income across the period from 1994 to 2015. The left panel in Figure 2 shows that the proportion of negatively geared landlords has increased from 50 percent in 1994 to around 60 percent in 2015. The right panel in Figure 2 shows that the aggregate net rental income became large negative from the early 2000s onwards. Evidence shown in Figures 1 and 2 suggest that Australian households increasingly participate in the residential property investment and take advantage of negative gearing, reducing tax obligations with the flow loss incurred from their housing investment.
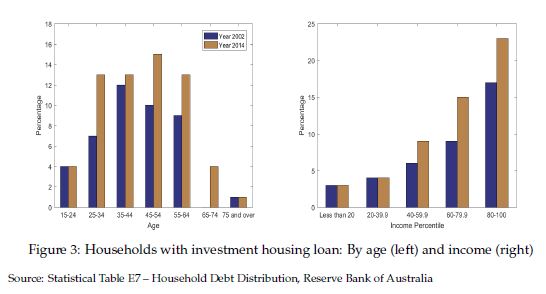
Figure 3 compares the share of households with home loans for investment by age (left panel) and income percentile (right panel) for the years 2002 and 2014. There has been a significant increase in the share, particularly among young to middle-aged households.
The largest increase was occurred in the age group 25 – 35, increased by 85 percent from 7 percent to 13 percent. From the right panel, we find that the share of households with investment housing loans has increased mainly among those in upper income percentiles.
These evidence are in line with the arguments by opponents of negative gearing that the policy essentially benefits the rich households who borrow and speculate in the property market. The fact that the distribution of housing investment loans is different across age and income also motivates our use of a heterogeneous agents incomplete markets model to study the implications of negative gearing.
This is consistent with our own surveys and analysis on negative gearing. Good data and analytics can negate political rhetoric, even it takes time…!
Finally, of course is the important point, should interest rates rise then the value of negative gearing claimed will rise, putting a heavier burden on the Treasury, at a time when the cost of Government borrowing would be also rising. A double whammy – a multiplier effect.

