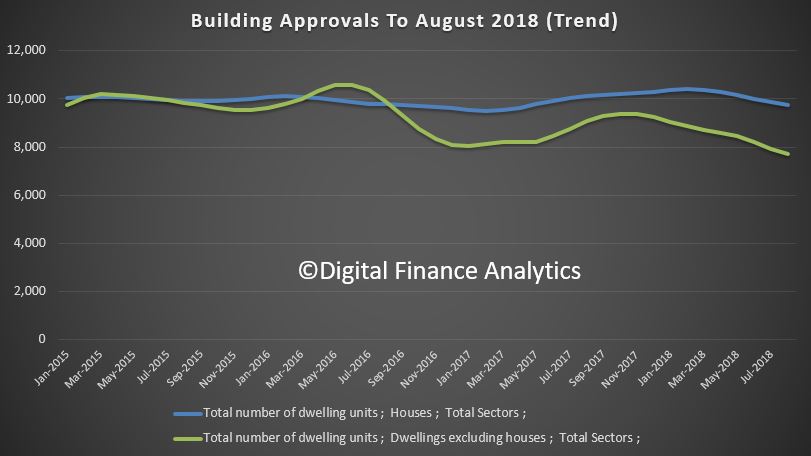
The ABS data released today shows that the number of dwellings approved in Australia fell by 1.9 per cent in August 2018 in trend terms.
In seasonally adjusted terms, total dwellings fell by 9.4 per cent in August, driven by a 17.2 per cent decrease in private dwellings excluding houses. Private houses fell 1.9 per cent in seasonally adjusted terms.
We will continue to base our analysis on the trend data, but this will understate more recent falls…
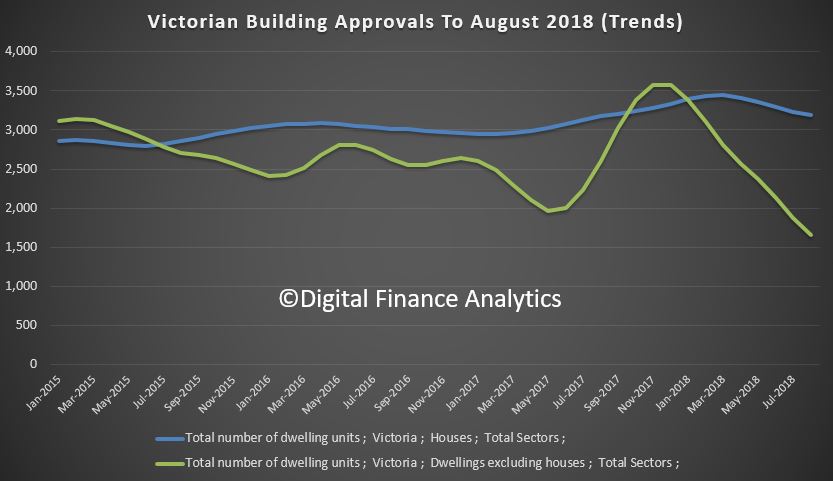
 The cause is simple, a significant fall in the number of new high-rise residential development applications, especially in Victoria. Recent falls in demand and prices suggests a significant reduction in momentum is on the cards there.
Justin Lokhorst, Director of Construction Statistics at the ABS said “The fall was mainly driven by private dwellings excluding houses, which decreased by 2.7 per cent in August, Private sector houses also fell, by 1.2 per cent.”
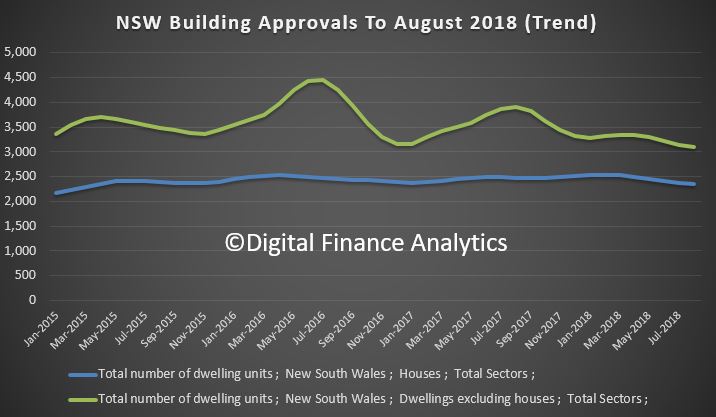
 Among the states and territories, dwelling approvals fell in August in Victoria (5.1 per cent), South Australia (3.6 per cent) and New South Wales (1.6 per cent) in trend terms.
 Dwelling approvals rose in trend terms in Western Australia (2.7 per cent), Tasmania (2.3 per cent), Northern Territory (1.5 per cent) and Australian Capital Territory (0.1 per cent). Dwelling approvals were flat in Queensland. But the significant falls in the two most populated states swamps any better news elsewhere.
In trend terms, approvals for private sector houses fell 1.2 per cent in August. Private sector house approvals fell in Queensland (3.3 per cent), Victoria (1.4 per cent), New South Wales (1.1 per cent) and South Australia (0.7 per cent), but rose in Western Australia (1.4 per cent).
The value of total building approved fell 1.3 per cent in August, in trend terms, and has fallen for nine months. The value of residential building fell 0.8 per cent while non-residential building fell 2.3 per cent.
Now, its worth comparing this approvals data with the latest RLB Crane Index, an interesting measure of construction activity (especially high-rise development).
Their Q3 2018 data – the 13th edition of the RLB Crane Index has seen
Australia reach a new record high of 173. Nationally, the number of cranes rose 7%, to 735, the highest count. Melbourne and Newcastle saw a strong crane increases, overtaking the record levels reached six months earlier. Sydney continues to decline from the peak reached in Q4 2017, falling 6%.
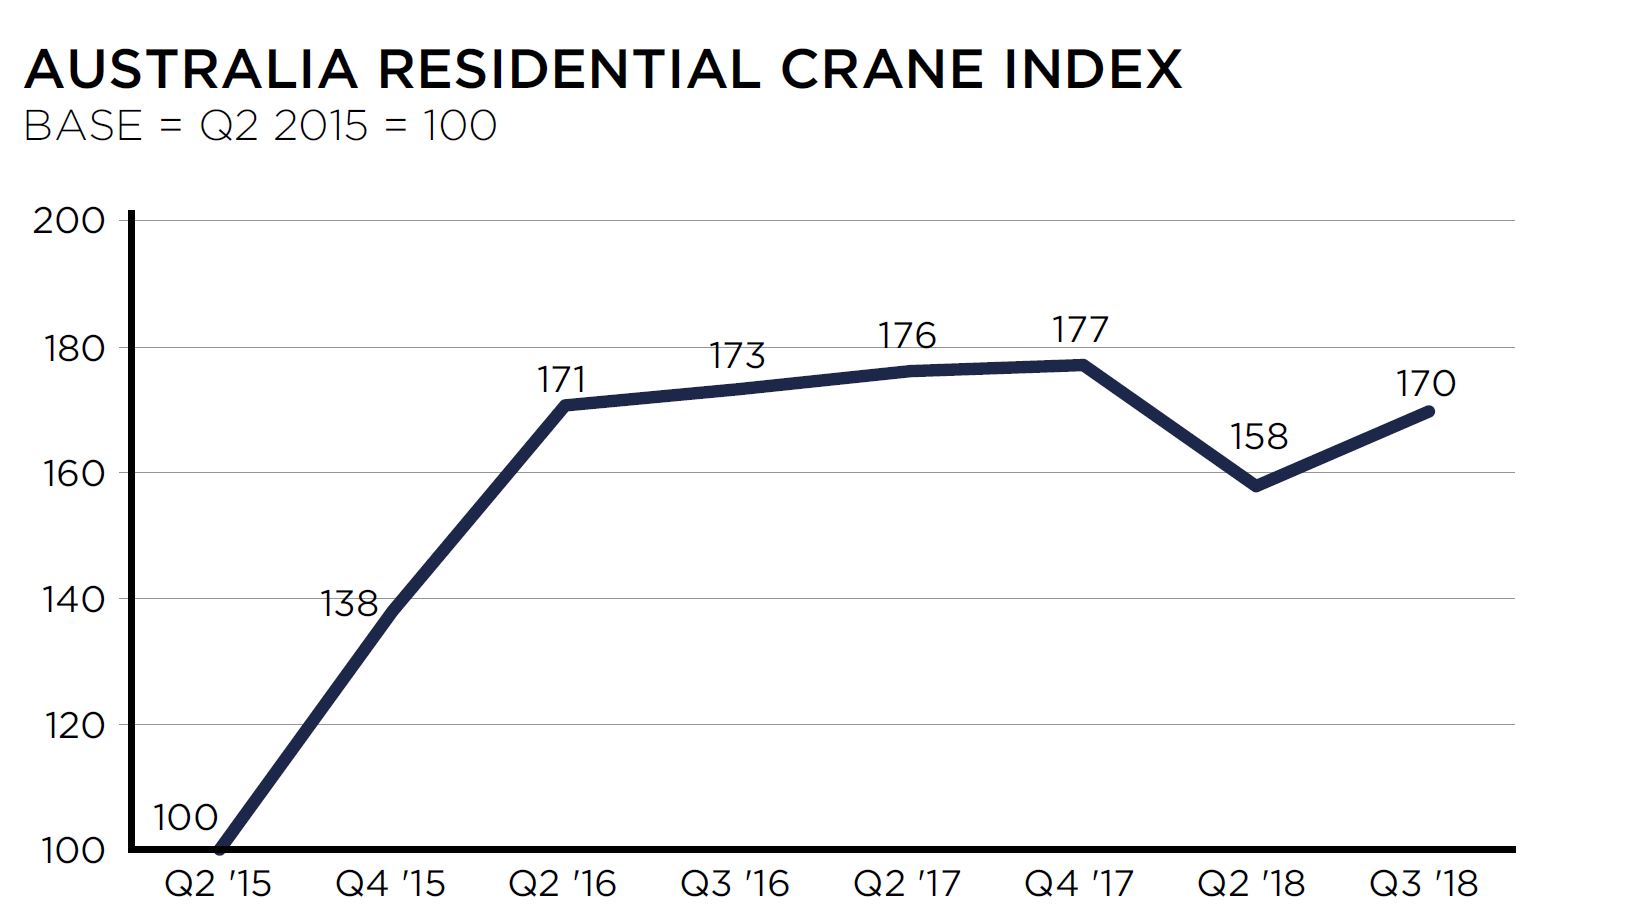
They say that the residential index pick up from its fall in Q2 2018, increasing 8%, to 170. Additionally, the non-residential index continued its rise, increasing 7%, recording a new high of 180. Recent construction statistics released by the Australian Bureau of Statistics highlight the ongoing strength of the construction industry. For FY 2018,total construction in Australia reached $221 billion.
Strong increases were seen in the non-residential and engineering construction sectors of 11.1% and 20.7% respectively, while the residential building sector remained constant at $74 billion.
They say that Melbourne’s crane numbers rose, increasing by 35 cranes. Driving this rise is the civil sector with the introduction of 13 new cranes. All
other sectors remained strong, either maintaining or increasing cranes from the count six months ago.
Since its peak in Q3 2017, Sydney’s crane count has been falling, driven by a declining residential sector. The residential crane count has fallen by 55 cranes from its peak in Q4 2017, while the non-residential sector recorded an increase of 26 cranes.
Brisbane has bounced back from its dip in the last edition, driven by a rise in mixed-use projects. While the residential sector remained stable, 11 new cranes were added to the mixed use sector.
 The Residential Crane Index at 170 is just below the peak in late 2017 of 177. Note this is NOT the number of cranes. However, we suspect construction momentum is easing, so the number is likely to fall in the months ahead, and the index will decline – Melbourne looks likely to be worst hit in the months ahead.
