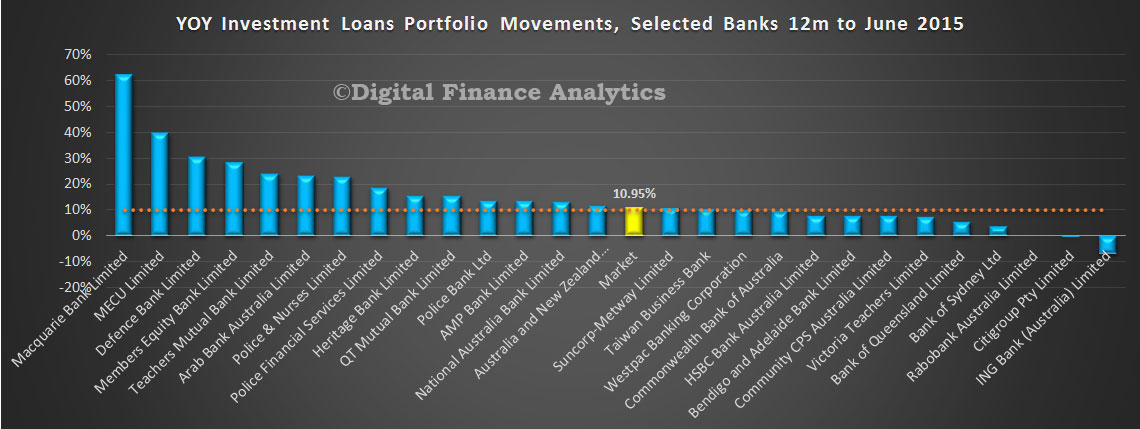
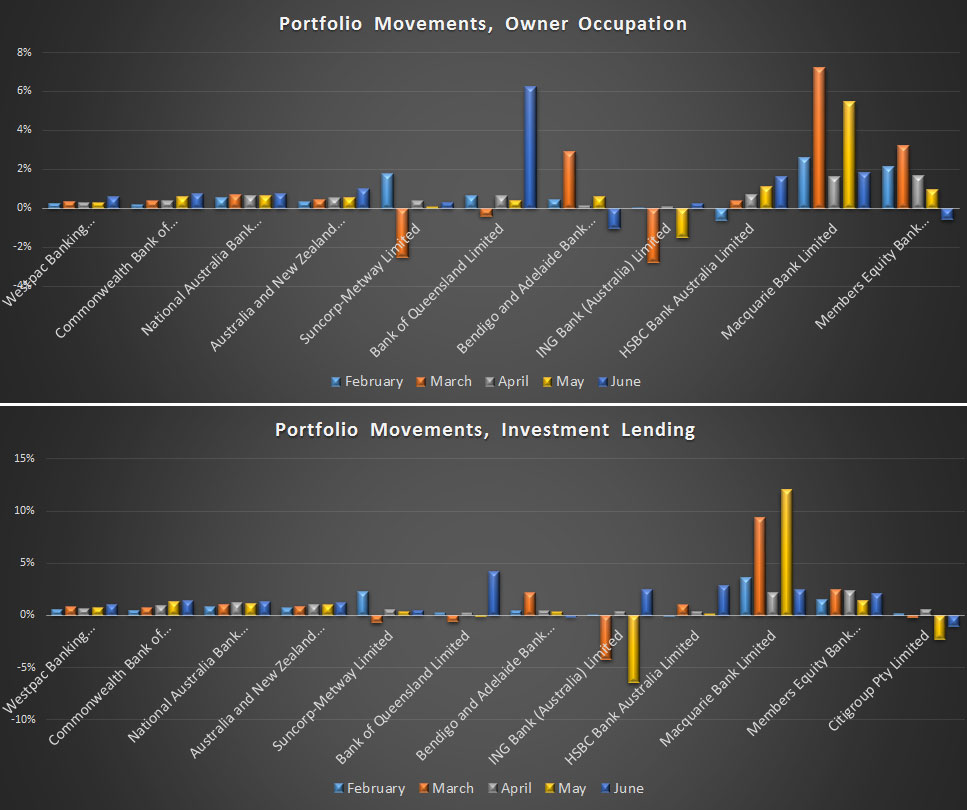
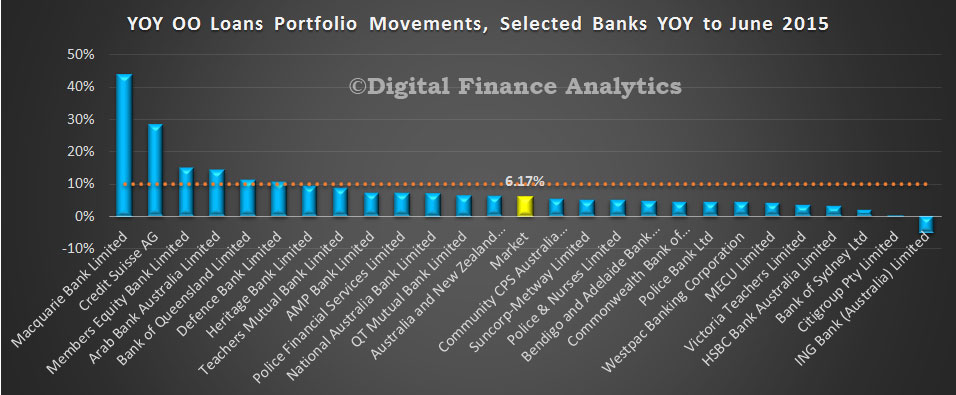
Now we have the data from ANZ, we have revised the APRA data sets for the last year, to see the true position with regards to movements in the home loans portfolios. This post revises that made Friday, (though the data is correct based on the released APRA figures.
We have adjusted the ANZ and market total lines by the changes ANZ announced late Friday. As a result, ADI market growth for investment loans is 10.95% (based on the total movements over the 12 months to June 2015). A number of players remain well above the 10% speed limit.
 The next charts show the portfolio movements for both owner occupied and investment loans.
 Finally, here is the revised owner occupied loans data. Annual growth 6.17%. There is no 10% speed limit from the regulator, but we put the line in for comparison purposes.
 A final observation, the investment loan growth depends how you calculate it, and where you draw the numbers from. Our preferred approach is to take the growth each month, and add 12 months data together to make the 10.95%. The other approach is to take the data from June 2015, and compare it with July 2014. In that case the market growth is 10.6%. Some analysts gross up the last three months to give annualised rate of over 13%. The RBA data (which includes the non-banks) shows a 12 month growth rate of 10.4% (both original and seasonally adjusted) by summing the monthly changes, or 12.4% if you take the last 3 months data and annualise that. The conclusion is that investment loan growth rates were showing no signs of slowing to June. Lets see what happens in future months. Also, consider this. APRA imposed the speed limit at 10%, but with no explanation why 10% was a good number. DFA is of the view that the hurdle rate should be significantly lower to have any meaningful impact.
