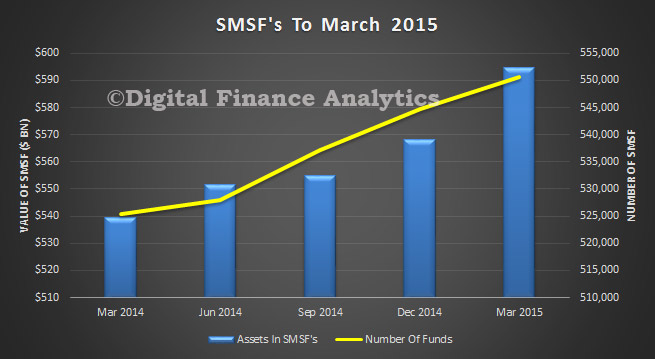
APRA released their quarterly superannuation stats today. Superannuation assets totalled $2.0 trillion at the end of the March 2015 quarter, up by $115 billion from December. Self Managed Super Funds continued to power ahead, both in number of funds (up by 5,911 funds) and value (up $26.6 billion), though relative share fell slightly.
Over the 12 months from March 2014 there was a 14.3 per cent increase in total superannuation assets. The total value lifted $115 billion in the last 3 months.
Total assets in MySuper products totalled $420.2 billion at the end of the March 2015 quarter. Over the 12 months from March 2014 there was a 23.1 per cent increase in total assets in MySuper products.
There were $23.7 billion of contributions in the March 2015 quarter, up 4.4 per cent from the March 2014 quarter ($22.7 billion). Total contributions for the year ending March 2015 were $101.6 billion.
Outward benefit transfers exceeded inward benefit transfers by $641 million in the March 2015 quarter.
There were $14.4 billion in total benefit payments in the March 2015 quarter, an increase of 9.2 per cent from the March 2014 quarter ($13.2 billion). Total benefit payments for the year ending March 2015 were $57.5 billion.
Net contribution flows (contributions plus net benefit transfers less benefit payments) totalled $8.7 billion in the March 2015 quarter, a decrease of 1.4 per cent from the March 2014 quarter ($8.8 billion). Net contribution flows for the year ending March 2015 were $39.3 billion.
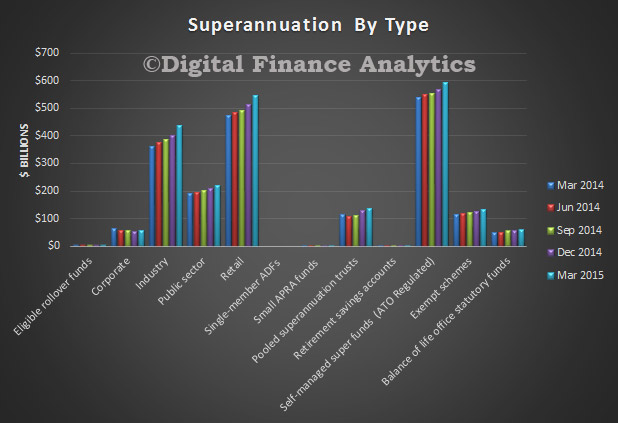
Looking at the splits, the trend growth was strong in industry, retail and SMSF.
 Looking at SMSF, both asset values and number of funds show a steady rise.
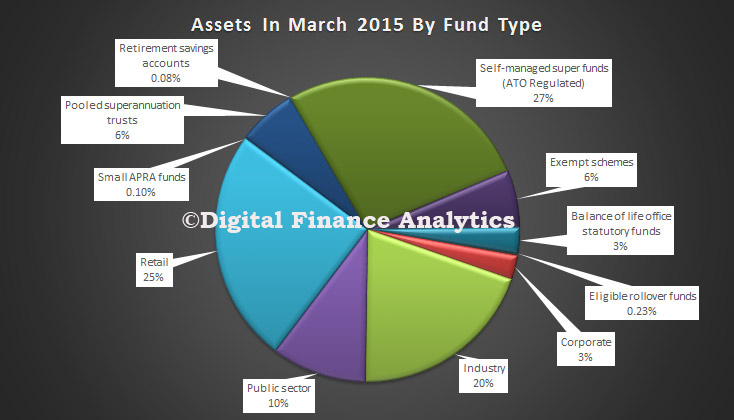
 However whilst 27% of all superannuation funds are now held in SMSF, this decreased by 1% from a year ago.
 The annual industry-wide rate of return (ROR) for entities with more than four members for the year ending March 2015 was 13.0 per cent. The five year average annualised ROR to March 2015 was 8.0 per cent.
As at the end of the March 2015 quarter, 52 per cent of the $1.35 trillion investments for entities with at least four members were invested in equities; with 24 per cent in Australian listed equities, 22 per cent in international listed equities and 5 per cent in unlisted equities. Fixed income and cash investments accounted for 32 per cent of investments; 19 per cent in fixed income and 13 per cent in cash. Property and infrastructure accounted for 12 per cent of investments and 4 per cent were invested in other assets, including hedge funds and commodities.

One thought on “Super Tops $2 Trillion”