Census uncovers Australia’s most advantaged and disadvantaged areas

Ku-ring-gai on Sydney’s upper north shore is Australia’s most advantaged Local Government Area (LGA) according to new data released today from the ABS 2016 Census of Population and Housing.

Home to just over 118,000 residents on Census night, the leafy area is officially the most advantaged LGA in the country based on the ABS’ Socio-Economic Indexes for Areas (SEIFA), which ranks areas in Australia according to relative socio-economic advantage and disadvantage.

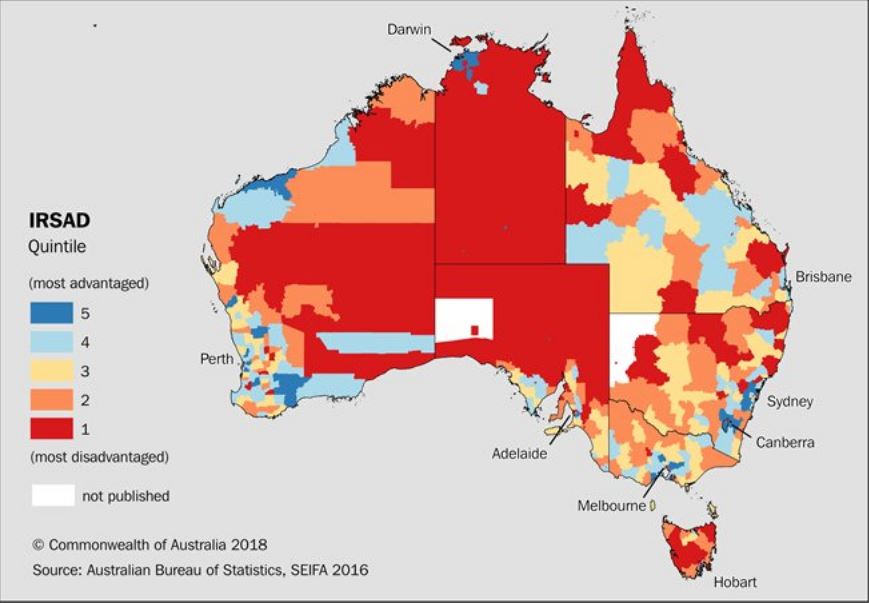
Another Sydney LGA, Mosman, which includes the affluent suburbs of Balmoral, Beauty Point and Clifton Gardens, has also been ranked amongst the most advantaged. In fact, SEIFA data shows the 10 most advantaged LGAs in Australia are all located around the Northern and Eastern areas of Sydney Harbour and in coastal Perth.

The most disadvantaged LGA is Cherbourg, approximately 250 kilometres north-west of Brisbane (QLD), followed by West Daly (NT). The 10 most disadvantaged LGAs in Australia can be found in Queensland and the Northern Territory.

SEIFA can help governments, communities and businesses determine areas needing additional funding and improved services, identify potential business opportunities, and research the relationship between health and education outcomes and the socio-economic conditions of an area.

The latest data has found that more than 30 per cent of people born in China, South Africa and Malaysia live in advantaged areas and less than 10 per cent reside in disadvantaged areas. Meanwhile, 40 per cent of Vietnamese-born live in disadvantaged areas and only a small proportion (11 per cent) live in advantaged areas.

People of Aboriginal and/or Torres Strait Islander origin are more likely to live in the most disadvantaged areas with 48 per cent living in the bottom fifth most disadvantaged LGAs, compared to 18 per cent of non-Indigenous people. Overall, only 5.4 per cent of Aboriginal and/or Torres Strait Islander people live in areas of high relative advantage compared with 22 per cent of non-Indigenous people.

New for 2016 SEIFA are easy-to-use features and data visualisation tools, including interactive maps on the ABS website, making interpreting Census data even easier.

For local rankings, go to the 2016 SEIFA publication. The full suite of online Census data products is available on the ABS website.

10 MOST ADVANTAGED AREAS


Rank
Local Government Area
Usual Resident Population

1
Ku-ring-gai (NSW)
118,053
2
Mosman (NSW)
28,475
3
Woollahra (NSW)
54,240
4
Cottesloe (WA)
7,597
5
Peppermint Grove (WA)
1,636
6
Nedlands (WA)
21,121
7
North Sydney (NSW)
67,658
8
Lane Cove (NSW)
36,051
9
Cambridge (WA)
26,783
10
Hunters Hill (NSW)
13,999

10 MOST DISADVANTAGED AREAS


Rank
Local Government Area
Usual Resident Population

1
Cherbourg (Qld)
1,269
2
West Daly (NT)
3,166
3
Belyuen (NT)
164
4
Woorabinda (Qld)
962
5
Central Desert (NT)
3,677
6
Aurukun (Qld)
1,269
7
Yarrabah (Qld)
2,559
8
Doomadgee (Qld)
1,405
9
Napranum (Qld)
957
10
Palm Island (Qld)
2,446


Unemployment Ticks Up (Seasonally Adjusted)

According to latest figures released by the Australian Bureau of Statistics (ABS), the seasonally adjusted unemployment rate increased to 5.6 per cent and the labour force participation rate increased by less than 0.1 percentage points to 65.7 per cent.  The number of persons employed increased by 18,000 in February 2018.

The preferred monthly trend unemployment rate remained steady at 5.5 per cent in February 2018,

“While the unemployment rate remained steady, the underemployment rate decreased by 0.1 percentage points to 8.3 per cent over the quarter, and is now at its lowest point since November 2015,” the Chief Economist for the ABS, Bruce Hockman, said.

Over the past year, the trend underutilisation rate, which includes both unemployment and underemployment, decreased by 0.6 percentage points to 13.8 per cent.

Employment and hours

Monthly trend full-time employment increased for the 16th straight month in February 2018. Full-time employment grew by a further 8,000 persons in February, while part-time employment increased by 12,000 persons, underpinning a total increase in employment of 19,000 persons.

“Full-time employment has now increased by around 293,000 persons over the past year, and makes up the majority of the 400,000 increase in employment,” Mr Hockman said.

Over the past year, trend employment increased by 3.3 per cent, which is above the average year-on-year growth over the past 20 years (1.9 per cent).

The trend monthly hours worked decreased slightly, by 1.4 million hours (0.1 per cent), with the annual figure continuing to show strong growth (2.7 per cent).

The labour force participation rate increased to 65.7 per cent, the highest it has been since December 2010. The female labour force participation also increased, to a further historical high of 60.6 per cent.

States and Territories

Over the past year, the states and territories with the strongest annual growth in trend employment were the ACT (4.7 per cent) Queensland (4.6 per cent) and New South Wales (3.9 per cent).

ABS Confirms Sydney Home Price Falls

The ABS released their home price data series to December 2017 today.  Sydney prices fell over the past quarter, along with Darwin. Other centres saw a rise, but the rotation is in hand.

The price index for residential properties for the weighted average of the eight capital cities rose 1.0% in the December quarter 2017. The index rose 5.0% through the year to the December quarter 2017.

The capital city residential property price indexes rose in Melbourne (+2.6%), Perth (+1.1%), Brisbane (+0.9%), Hobart (+3.9%), Canberra (+1.7%) and Adelaide (+0.6%) and fell in Sydney (-0.1%) and Darwin (-1.5%).

Annually, residential property prices rose in Hobart (+13.1%), Melbourne (+10.2%), Canberra (+5.7%), Sydney (+3.8%), Adelaide (+3.6%) and Brisbane (+2.1%) and fell in Darwin (-6.3%) and Perth (-1.7%).

The total value of residential dwellings in Australia was $6,869,006.7m at the end of the December quarter 2017, rising $92,858.9m over the quarter.

The mean price of residential dwellings rose $6,500 to $686,700 and the number of residential dwellings rose by 40,400 to 10,003,100 in the December quarter 2017.

Homeless numbers will keep rising until governments change course on housing

From The Conversation.

Ten years ago the Australian government launched a National Partnership Agreement on Homelessness (NPAH). It injected A$800 million into homelessness services and A$300 million to build 600 new homes for people experiencing homelessness. It was later announced that another A$400 million would be available under the National Affordable Housing Agreement (NAHA) to build new housing and supported accommodation for the homeless. Total recurrent expenditure (at 2016-17 prices) on homelessness services has increased by 28.8%, from A$634.2 million in 2012-13 to A$817.4 million in 2016-17.

But despite this, the number of people experiencing homelessness and the rate of homelessness have both increased. Our research points to problems in the public housing system as one of the more important causes of these increases.

According to census figures released on Wednesday by the Australian Bureau of Statistics (ABS), the number of homeless people in Australia has risen by 14% to 116,427. The rate of homelessness has increased from 47.6 people per 10,000 of the population in 2011, to 49.8 per 10,000 now. (The ABS defines homelessness here.)

There is some good news: the numbers of Indigenous homeless and homeless children and youth (aged 12-18) have declined by 26%, 11% and 7% respectively since 2011. But on the downside, increases are particularly pronounced in New South Wales (where the homelessness rate rose by 27% and among people aged over 65 (by just over 30%) and overseas-born migrants (by 40%).

Why are we still going backwards?

Changes in Australian housing and welfare systems and wider social and economic developments appear to have more than offset any benefits from the NPAH and NAHA. Our research sheds some light on the role played by Australia’s housing system. Using the internationally recognised and unique Journeys Home longitudinal survey, we find that public housing is the most important factor in preventing homelessness among vulnerable people.

Public housing is particularly effective because it is affordable. It has also traditionally offered a long-term refuge for precariously housed people. This is because public housing leases provide the benefits of security of tenure commonly associated with home ownership.

It is perhaps no accident that NSW was one of the first states to introduce fixed-term tenancies in public housing. This eroded one of the major attributes of tenure, in a state that has seen relatively large increases in homelessness numbers.

The empirical evidence also suggests that community housing fails to provide the same protection for people at risk of homelessness. While community housing is affordable, the security of tenure is weaker, which may explain these findings.

Despite such evidence, the stock of public housing continued to decline between the 2011 and 2016 censuses. State government-initiated transfers of stock to the community housing sector accelerated this trend. In 2013 Australia had a public housing stock of 325,226 dwellings. This declined by 3.2% to 314,864 usable dwellings in 2017.

Where are the additional homeless coming from?

One of the more alarming changes is a sharp increase in the number of homeless people over 65. This partly reflects Australia’s ageing population. However, the increase is such that the elderly’s share of the total homelessness count has also risen.

Furthermore, our research suggests that this trend could become protracted. This is because the homeless elderly have much less chance of escaping into formal housing than younger people experiencing homelessness. We have little understanding of the reasons for this, but gaps in service provision to the aged could be partly responsible.

The other group who feature prominently among the homeless are overseas migrants. They now make up 46% of the homeless, despite representing just 28% of the Australian population. The number of homeless overseas-born migrants has soared by 40% since the 2011 Census, from 38,085 to 53,606 people.

It turns out that homeless overseas-born migrants are concentrated among those living in severely overcrowded dwellings – a little over half of those living in these conditions were born overseas. We know little about these homeless people. Discrimination could be a factor, though some characterise this group as students living in group households who should not be considered homeless. But this is speculation and further study is certainly required.

In view of the latest census results, it is clear to us that governments need to reassess their approach to what is turning into an intractable social problem.

We do not deny that situational factors, such as drug abuse, domestic violence and so forth, are important here. But equally, there is strong evidence that structural problems in our housing market are a significant cause of growth in the numbers of homeless people.

Until these problems are resolved, service provision and support will remain a band-aid masking deeper social and housing system issues.

Gavin Wood, Emeritus Professor of Housing and Housing Studies, RMIT University; Guy Johnson, Professor, Urban Housing and Homelessness, RMIT University; Juliet Watson, Lecturer, Urban Housing and Homelessness, RMIT University; Rosanna Scutella, Senior Research Fellow, Centre for Applied Social Research, RMIT University

Overall Finance Stronger On Commercial Lending In January 2018

The ABS released their finance series today, which completes the monthly data.  As normal we analyse the trend series, which smooths some of the monthly data noise. Overall lending across all categories was up 0.71% to $71 billion in the month.  Commercial lending (excluding for investment housing) grew the most.

Within that, in trend terms, the total value of owner occupied housing commitments excluding alterations and additions rose 0.11%, the value of total personal finance commitments fell 0.1%. Fixed lending commitments fell 0.1% and revolving credit commitments fell 0.1%.

The trend series for the value of total commercial finance commitments rose 1.1%. Revolving credit commitments rose 2.5% and fixed lending commitments rose 0.7%. The trend series for the value of total lease finance commitments rose 0.1% in January 2018.

To look at what is really going on we need to back out the housing investment data from the commercial series, and also calculate the % of property investment to all lending, and % of commercial lending of the total.

We can look at the movements in monthly flows, by value and percentage change.

Lending for secured housing rose 0.14% or 28.8 million to $21.1 billion. Secured alterations fell 1%, down $3.9 million to $391 million.  Fixed personal loans fell 0.1%, down $1.2 million to $4.0 billion, while revolving loans fell 0.06%, down $1.3 million to $2.2 billion.

Investment lending for construction of dwellings for rent rose 0.86% or $10 million to $1.2 billion. Investment lending for purchase by individuals fell 1.34%, down $127.7 million to $9.4 billion, while investment lending by others rose 7.7% up $87.2 million to $1.2 billion.

Fixed commercial lending, other than for property investment rose 1.25% of $260.5 million to $21.1 billion, while revolving commercial lending rose 2.5% or $250 million to $10.2 billion.

The proportion of lending for commercial purposes, other than for investment housing was 45% of all commercial lending, up from 44.5% last month.

The proportion of lending for property investment purposes of all lending fell 0.1% to 16.6%.

So, we are seeing a rotation, if a small one, towards commercial lending for more productive purposes. However, lending for property and for investment purposes remains quite strong. No reason to reduce lending underwriting standards at this stage or other controls.

Housing Finance Softens In January

The ABS released the housing finance data today. The trend estimate for the total value of dwelling finance commitments excluding alterations and additions was unchanged. Owner occupied housing commitments rose 0.1% while investment housing commitments fell 0.3%.    The proportion of first time buyers rose to 18%, but the absolute number of loans was significantly lower.

The proportion of investment loans fell again but still sit above 35%.

There were small rises in refinancing and investment loans for entities other than individuals.  The number of commitments for owner occupied housing finance fell 0.7% in January 2018. In trend terms, the number of commitments for the purchase of new dwellings fell 1.4%, the number of commitments for the purchase of established dwellings fell 0.7% and the number of commitments for the construction of dwellings was flat.

The overall stock, in original terms rose 0.3% in the month, and growth continues to slow.

In original terms, the number of first home buyer commitments as a percentage of total owner occupied housing finance commitments rose to 18.0% in January 2018 from 17.9% in December 2017.  The absolute number of first time buyers fell, thanks mainly to falls of 22.3% in NSW and of 13.3% in VIC.

Here are the movements month on month.

The DFA FTB tracker, which overlays owner occupied loans from the ABS with first time investment loans from the DFA surveys, shows a significant. fall.

The ABS warns that the number of first home buyer commitments as a percentage of total owner occupied housing finance commitments recorded strong growth from July 2017 to November 2017. The increase has been driven mainly by changes to first home buyer incentive programs in New South Wales and Victoria. The ABS is working with APRA and the financial institutions to establish the size of the increase in first home buyer lending and improve the quality of first home buyer statistics more broadly. These numbers may be revised and users should take care when interpreting ABS first home buyer statistics.

Securitisation On The Up (and Up)

The ABS released their latest data on the Assets and Liabilities of Australian Securitisers.

At 31 December 2017, total assets of Australian securitisers were $132.5b, up $7.3b (5.9%) on 30 September 2017. During the December quarter 2017, the rise in total assets was primarily due to an increase in residential mortgage assets (up $6.0b, 6.0%) and by an increase in other loans assets (up $0.9b, 6.1%).

You can see the annual growth rates accelerating towards 13%. The non-banks are loosely being supervised by APRA (under their new powers), but are much freer to lend compared with ADI’s.  A significant proportion of business will be investment loans.

This is explained by a rise in securitisation from both the non-bank sector, which is going gangbusters at the moment, and also some mainstream lenders returning the the securitised funding channels, as costs have fallen.

There is also a shift towards longer term funding, and a growth is securitised assets held by Australian investors.  Asset backed securities issued overseas as a proportion of total liabilities decreased to 2.6%.

At 31 December 2017, total liabilities of Australian securitisers were $132.5b, up $7.3b (5.9%) on 30 September 2017. The increase in total liabilities was primarily due to an increase in long term asset backed securities issued in Australia (up $8.6b, 8.0%). This was offset by a notable decrease in short term asset backed securities issued in Australia (down $1.1b, 22.8%), and loans and placements (down $0.3b, 4.1%).

At 31 December 2017, asset backed securities issued in Australia as a proportion of total liabilities increased to 89.8%, up 0.7 percentage points on the September quarter 2017 proportion of 89.1%. Asset backed securities issued overseas as a proportion of total liabilities decreased to 2.6%, down 0.1 percentage points on the September quarter 2017 proportion of 2.7%.

Economy Grows 0.4 per Cent in December Quarter

The ABS has released the account aggregates to December 2017.  Overall the trend data on an annualised basis is still pretty weak. GDP has moved up just a tad, but GDP per capital is growing at 0.9% per annum, and continues to fall. Much of the upside in to do just with population growth. But net per capital disposable income rose at just 0.4% over the past year. Housing business investment and trade were all brakes on the economy.

These are not indicators of an economy in prime health!

Real remuneration is still growing at below inflation, so incomes remains stalled. More than two in three households have seen no increase. It rose by 0.3% in the December quarter and was up just 1.3% over the year to December 2017, compared with inflation of 1.9%.

In fact households continue to raid their savings to support a small increase in consumption, but this is not sustainable.  The household savings ratio recovered slightly to 2.7% from 2.5% in seasonally adjusted terms. Debt remains very high.

The Australian economy grew 0.4 per cent in seasonally adjusted chain volume terms in the December quarter 2017, according to figures released by the Australian Bureau of Statistics (ABS) today.

Chief Economist for the ABS, Bruce Hockman, said: “Growth this quarter was driven by the household sector, with continued strength in household income matched by growth in household consumption.”

Compensation of employees (COE) increased 1.1 per cent in the December quarter, the fourth consecutive quarter of solid growth. “The increase in wages is consistent with stronger employment data reported in Labour Force, as well as a lift in the growth rate in the wage price index observed over the past two quarters.” Mr Hockman added.

Household consumption rebounded to 1.0 per cent this quarter with strength recorded in discretionary spending on hotels, cafés and restaurants and recreation and culture. Private investment detracted from growth due to a decline in dwellings and a sharp fall in new engineering construction. However, private investment in machinery and equipment remained strong, as did construction of non-residential buildings.

Net trade detracted from growth due to declines in exports of rural goods, transport equipment and travel services. This is reflected in the Agriculture and Manufacturing industries which were the largest detractors from GDP this quarter. Healthcare and service based industries continued to grow reflecting increased demand from the household sector.

Retail Turnover Rises 0.3 Per Cent in January

The trend estimate for Australian retail turnover rose 0.3 per cent in January 2018 following a rise (0.3 per cent) in December 2017. Compared to January 2017, the trend estimate rose 2.3 per cent according to the latest Australian Bureau of Statistics (ABS) Retail Trade figures.

Retail turnover rose 0.1 per cent in January 2018, seasonally adjusted. This follows a 0.5 per cent fall in December 2017.


“There were offsetting movements by industry with rises in other retailing (1.0 per cent), household goods retailing (0.1 per cent), and cafes, restaurants and takeaways (0.1 per cent) being offset by falls in clothing, footwear and personal accessories (-0.7 per cent) and department stores (-0.6 percent),” Ben James, Director of Quarterly Economy Wide Surveys at the ABS, said. “Food retailing was relatively unchanged (0.0 per cent).”

In seasonally adjusted terms, there were rises in Queensland (0.4 per cent), Victoria (0.3 per cent), Western Australia (0.3 per cent), and Tasmania (0.3 per cent). The Australian Capital Territory was relatively unchanged (0.0 per cent). New South Wales (-0.2 per cent), South Australia (-0.6 per cent), and the Northern Territory (-0.5 per cent) fell in seasonally adjusted terms.

Online retail turnover contributed 4.7 per cent to total retail turnover in original terms in January 2018. In January 2017, online retail turnover contributed 3.6 per cent to total retail.

Dwelling approvals up 0.1 per cent in January

The number of dwellings approved rose 0.1 per cent in January 2018, in trend terms, after falling for the previous three months, according to data released by the Australian Bureau of Statistics (ABS) today.

“Dwelling approvals rose in January, driven by a large increase in private dwellings excluding houses,” said Justin Lokhorst, Director of Construction Statistics at the ABS. “Approvals for private sector houses have remained stable.”

Dwelling approvals increased in Victoria (2.6 per cent), Tasmania (2.0 per cent), Queensland (1.1 per cent) and Western Australia (0.5 per cent), but decreased in the Australian Capital Territory (32.6 per cent), the Northern Territory (9.3 per cent), South Australia (3.2 per cent) and New South Wales (2.3 per cent) in trend terms.

In trend terms, approvals for private sector houses fell 0.1 per cent in January. Private sector house approvals fell in Queensland (1.6 per cent) and South Australia (1.4 per cent), but rose in New South Wales (0.7 per cent), Victoria (0.3 per cent) and Western Australia (0.3 per cent).

The value of total building approved fell 1.4 per cent in January, in trend terms, and has now fallen for four months. The value of residential building rose 0.5 per cent while non-residential building fell 4.7 per cent.