Trend dwelling approvals fall 1.9 per cent in May

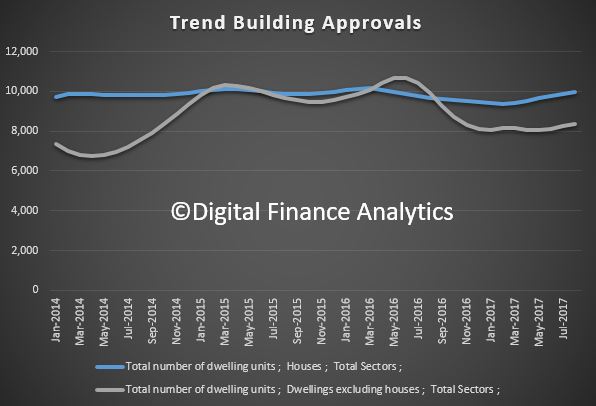
The number of dwellings approved fell 1.9 per cent in May 2017, in trend terms, and has fallen for three months, according to data released by the Australian Bureau of Statistics (ABS) today.

The peak in multi-unit construction is well and duly done, down 27% on a year ago. We are looking at approvals, and of course there is significant building underway at the moment, but this may ease later.

“Dwelling approvals continue to weaken in trend terms, falling by around 700 dwellings over the past three months,” said Daniel Rossi, Director of Construction Statistics at the ABS. “The May 2017 data showed that the number of dwellings approved is now 18 per cent below the peak in May 2016”.

Dwelling approvals decreased in May in the Australian Capital Territory (8.2 per cent), Victoria (3.9 per cent), Western Australia (3.7 per cent) and New South Wales (2.6 per cent), but increased in Queensland (2.2 per cent), Northern Territory (2.1 per cent), South Australia (1.6 per cent) and Tasmania (1.5 per cent) in trend terms.

In trend terms, approvals for private sector houses were flat in May. Private sector house approvals rose in South Australia (1.0 per cent), New South Wales (0.4 per cent) and Victoria (0.2 per cent), but fell in Queensland (0.9 per cent) and Western Australia (0.6 per cent).

In seasonally adjusted terms, dwelling approvals decreased by 5.6 per cent in May, driven by a fall in total dwellings excluding houses (12.6 per cent), while total house approvals rose 0.4 per cent.

The value of total building approved rose 0.8 per cent in May, in trend terms, and has risen for five months. The value of non-residential building rose 4.6 per cent while residential building fell 1.5 per cent.

The working poor: one-in-five households being left behind

From The New Daily.

It was heartening on Thursday to see job ads continue to tick up, rising 1.7 per cent in the three months to the end of May, or 9.2 per cent in the past year.

But before we get too excited, this week’s census data raises real concerns that the kinds of jobs being created aren’t paying enough for workers to live on.

The alarming fact is that one-fifth of households in 2016 recorded a gross income, including all government benefits, of less than $650 a week.

To put that in context, that’s less than the full couple rate for the aged pension ($670 a week) and less than a full-time worker on the minimum wage ($673).

Think about that for a minute. If 800,000 households say they have income of less than $650, and if that figure by definition excludes retiree couples living on the full pension, or on a higher combination of pension and super, we’ve got a huge problem.

The census, for some reason, compares the number of households on $650 or less with households falling under the same threshold five years ago.

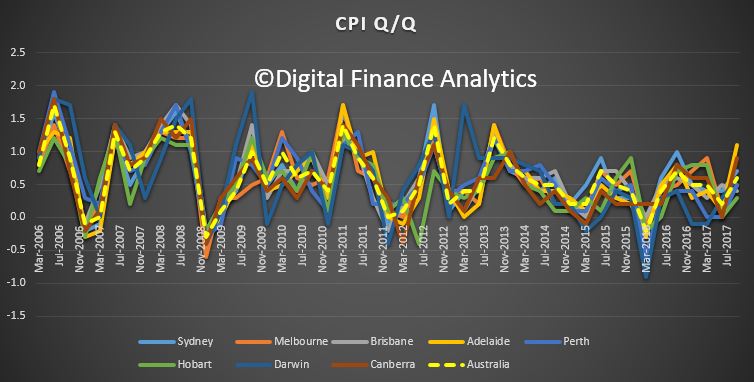
That’s a bit strange, because the consumer price index has risen a cumulative 9.85 per cent in that time. So you’d need $714 today to buy the same goods and services as in 2011.

For middle Australia, that’s proving less of a problem – real wages are not rising as quickly as GDP growth, which means companies are taking a larger share of growth as profits, but at least they’re ahead of inflation.

So while the economy expanded 6.2 per cent in real terms over five years, the median personal income was up 4.6 per cent , and median household incomes are up 6.1 per cent. Not great, but a lot better than for the sub-$650 group.

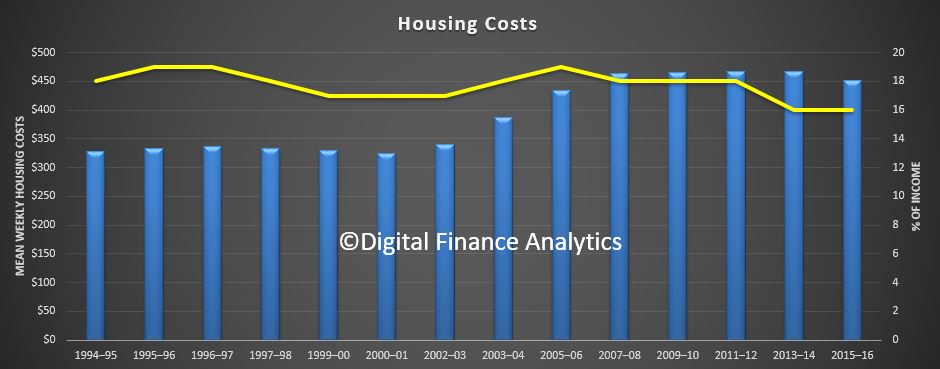
The Australian Council of Social Services estimates that 800,000 households are in housing stress – spending more than 30 per cent of their income on housing – and while that’s not an exact fit with the sub-$650 group, the overlap would be very large.

 Who are we forgetting?

When Bob Menzies spoke of a ‘forgotten people’ in his famous 1942 speech, he meant a middle class who were not wealthy, but neither backed by the then-huge union movement.

Well, times change. The census reveals an alarmingly large cohort of people forgotten for other reasons.

They are left behind by a skyrocketing housing market, stuck in the rut of under-employment, attacked as a drain on the budget or for not paying more tax, seeing their penalty rates cut, or forced to jump through undignified job-seeker hoops.

So yes, it’s natural for the political and media classes to welcome an uptick in job ads. But we have to ask if that’s going to do anything to lift the fortunes of the gradually swelling ranks of working poor.

This year’s census summary was released under the headline “Census reveals: we’re a fast changing nation”.

When one in five households live on less that the age pension and less than a single minimum wage, “a fast polarising nation” might be more apt.

Home ownership remains strong in Australia but it masks other problems: Census data

From The Conversation.

The great Australia dream of owning your own home is still alive despite the various problems plaguing housing affordability, new Census data shows. Even though the overall home ownership trend remains strong, it’s masking other issues.

The latest 2016 Census data assesses what the national home ownership and rental rates are and how these vary location. It also gives us a picture of mortgage and rental costs.

Comparing home ownership rates since the 2011 Census, there’s a slow but steady decline in home ownership rates overall – down by 2.9% from 64.9% of all Australian households in 2006, to 62.0% in 2016. However, 7.4% of households did not state their housing tenure in the 2016 Census. This accounts for some of the variation in reported rates of home ownership decline.

This contraction is nowhere of the scale of equivalent falls in home ownership in the US and UK and New Zealand over the same period.


What’s more interesting than the overall trend, is the greater decline in outright home ownership, involving no mortgage debt, from 31.0% to 29.6% between 2011 and 2016. There’s also a lesser decline in home owners who are purchasing with mortgage debt 33.3% in 2011 compared with 32.4% in 2016.

The opportunity households now have to borrow against their mortgage loans for spending undoubtedly accounts for some of this change. Also contributing to this is home purchasers are less likely to reach retirement age with no remaining mortgage debt, in the same numbers as previous eras.

Another aspect of housing affordability is masked by these numbers – the wide variation in being able to purchase a home according to age and income. Recent evidence indicates would-be-home-owners try various means including very high mortgage debt and moving to outer urban locations away from employment and into smaller dwellings, to be able to buy a house. Some even delay having kids.

Census figures show that for people wanting to purchase a home, a change in state or city location may be an option. According to the data Darwin was the most expensive city to buy in, whereas Hobart was the cheapest for home purchasers.


For households across the income spectrum, 7.2% of purchasers are paying more than 30% of their income on mortgage costs, the data shows. This figure is likely to be far higher among the lowest income (40% of households) for whom such costs place them in housing poverty.

Given the national obsession with investment in private rental, it’s no surprise that the proportion of all Australian households now renting has also increased. Census 2016 results show the private rental sector grew in size, from 20.2% in 2006, to 22.0% in 2011 and to 23.6% in 2016.


In 2016 a total of 2,089,633 Australian households rented privately, either from real estate agents or private landlords.

The growth of the private rental sector largely reflects the high costs of home purchase. Many households who rent have a relative lack of security and control over rental increases.

For those unable to pay rent in the private market, social housing is likely to provide little relief. Census data shows overall rates of social housing declining from 4.7% in 2006 to 4.0% in 2016. In this context, the growth in rates of homelessness in the last decade is perhaps not surprising.

For Indigenous Australians, the housing picture is different. Census 2016 data show among households in which at least one resident is Aboriginal and/or Torres Strait Islander, 12.2% are outright owners, 25.9% are purchaser owners, 32.4% are renting privately. Around a fifth of households, 21.5%, live in social housing, reflecting targeted social housing programs in metropolitan, rural and regional areas.

Overall, home ownership has not changed as dramatically in the last decade, as some would have anticipated. However, it’s likely with the labour market being what it is and the adaptations people are making to try and buy a home, there may be longer-term problems to be seen in future.

Excessive household debt, polarisation of cities into low and high income earning areas and deepening family housing constraints indicate these Census figures likely mask bigger problems. This may translate over time into a more costly social problem, as increasing proportions of households require housing assistance of some form. Australian society could become even more divided on the basis of housing wealth and opportunity, if these trends continue, as we expect they will.

Authors: Wendy Stone, Associate Professor, Centre for Urban Transitions, Swinburne University of Technology; Kath Hulse, Research Professor, Centre for Urban Transitions, Swinburne University of Technology; Margaret Reynolds, Researcher, Centre for Urban Transitions, Swinburne University of Technology; Terry Burke, Professor of Housing Studies, Centre for Urban Transitions, Swinburne University of Technology

Census Shows How We Are Changing

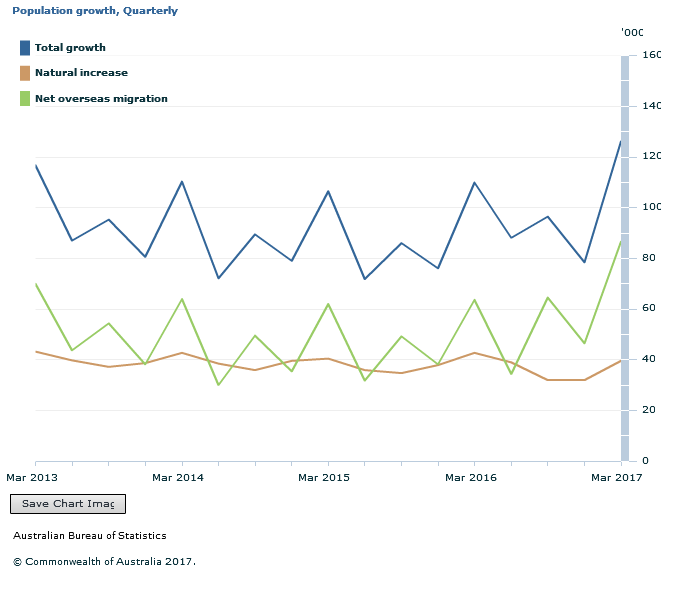
The early data from the latest census, released by the ABS today highlights the momentum in population growth across the nation.

The 2016 Census counted 23,717,421 people in Australia on Census night, which included 23,401,892 people who usually live in Australia– an 8.8 per cent increase from 2011. On Census night, over 600,000 Australians were travelling overseas.

In the last 10 years the population has been growing by  1.7% each year, compared with 1.4% in the prior decade.

1.3 million new migrants have come to call Australia home since 2011, hailing from some of the 180 countries of birth recorded in the Census, with China (191,000) and India (163,000) being the most common countries of birth of our new arrivals.

Strong migration, plus births, and people living to a great age are all putting upward pressure on the numbers.  This momentum is expected to continue putting more pressure on infrastructure and creating more congestion especially in our major urban centres.

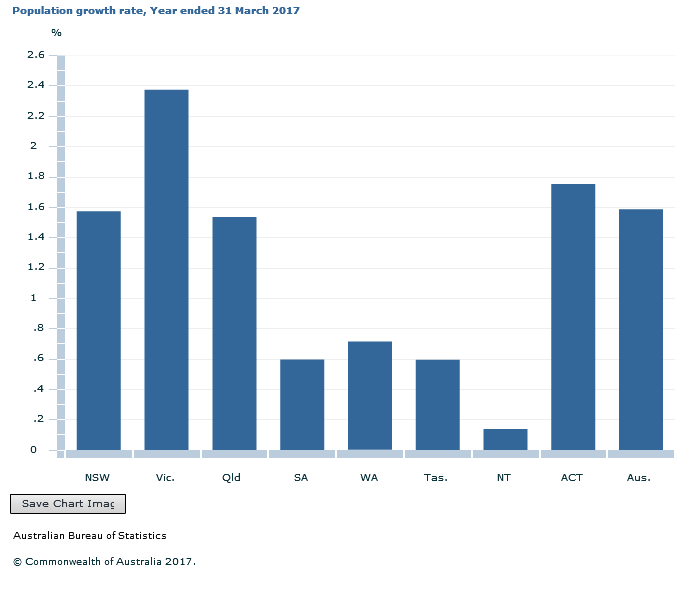
The Census found that New South Wales remains our most populous state, with 7,480,228 people counted, ahead of Victoria in second (5,926,624 people) and Queensland in third (4,703,193 people).

Yet it’s the home of the nation’s capital – the Australian Capital Territory (ACT) – that experienced the largest population growth of any state or territory over the past five years, adding more than 40,000 new residents – an increase of 11 per cent.

Located approximately 45 kilometres from the Perth CBD in the woody hills of the Darling Scarp, Serpentine – Jarrahdale showed the fastest regional growth in the country, with a population increase of 51 per cent to 27,000 people – up from 18,000 people in 2011. Gungahlin, a thriving northern area in the ACT, continues to flourish and is now home to 71,000 people, up from 47,000 in 2011 – an increase of 50 per cent.

Stretching from the beaches of Bondi and Manly to the Blue Mountains, Greater Sydney once again came in as Australia’s largest population centre, with 4,823,991 people, with around 1,656 new people calling the Harbour City home every week since the last Census. However, the cultural hub of Greater Melbourne is closing in fast with 4,485,211 people, increasing by around 1,859 people every week since 2011.

The average age – the median –  has moved up from 36 years to 38 and there are more people over the age of 65 years, with an increase from 14% to 16% of the population. The 2016 Census found that there are 664,473 additional people aged 65 and over since 2011. The demographic shift here is significant in terms of healthcare, aged care and wealth management.

Median weekly household incomes rose from $1,234 in 2011 to $1,438 in 2016. The average individual income was $577, and is now $662.

The dwellings data is interesting, in that we see a 6.8% rise in the number of occupied dwellings between 2011 and 2016, from 7.7 million to 8.3 million. The average monthly mortgage repayment is $1,755 today, compared with $1,800 in 2011, whilst rents have risen by 17.5%, from a weekly $285 to $335.  There was little change in the mix between families, single persons and group households. There was no change to the average number of people in each dwelling, at 2.6 and the average number of bedrooms remained at 3.1.

More households are renting, up from the previous census in 2011, from 27% in 2011 to 31% in 2016. Clearly the rise in property values relative to income and poor housing affordability (refer population growth above) makes it more difficult to enter the market, to say nothing of the greater penetration of property investors.  We also see that apartments, flats and townhouses have increased as a share of all housing dwellings from 24% to 27% over the past decade.

The cultural mix in the country is changing, look back half a century and around 18% of Australians were born overseas. The latest data shows this now stands at 26%.

The ethic mix has also changed. Back in 1966 one third of these people were born in England but today this is 15%. The proportion from New Zealand also decreased over the same period from 9.1% to 8.4%.

In contrast, the proportion of overseas-born Australians born in China has jumped from 6% to 8.3% and from India from 5.6% to 7.4%.

Finally, a greater proportion of the population has no specific religious affiliation. The proportion of people reporting no religion increased to 30 per cent in 2016 – up from 22 per cent five years ago and nearly double the 16 per cent in 2001.

Residential property prices rise 2.2 per cent

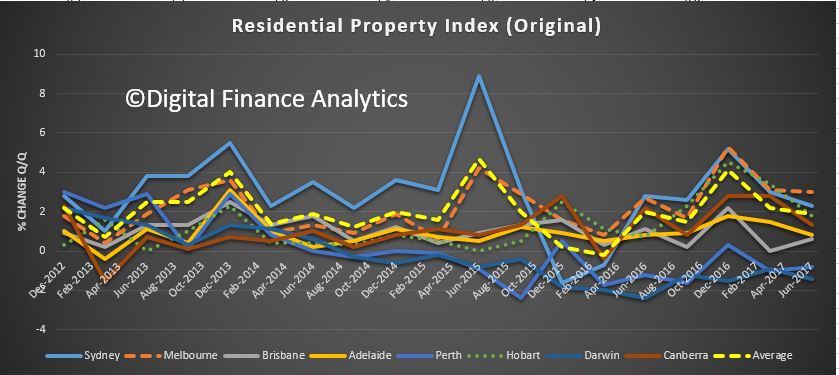
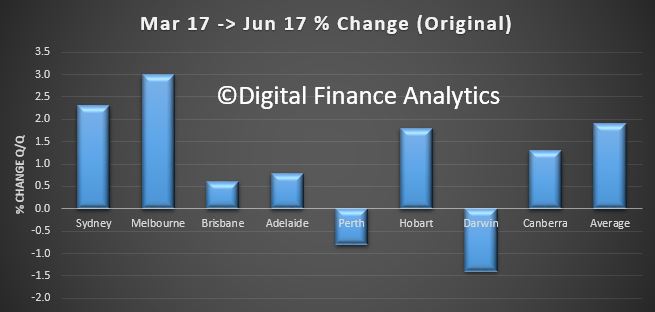
Residential property prices rose 2.2 per cent in the March quarter 2017, the fourth consecutive quarter of growth, according to figures released today by the Australian Bureau of Statistics (ABS).

Program Manager for Prices Branch, Marcel van Kints, said; “While residential property prices rose in most capital cities this quarter, Sydney and Melbourne continue to drive the national result.”

The price rises in Sydney (3.0 per cent) and Melbourne (3.1 per cent) were partially offset by falls in Perth (1.0 per cent) and Darwin (0.9 per cent).

Through the year growth in residential property prices reached 10.2 per cent in the March quarter 2017. Sydney recorded the largest through the year growth of all capital cities at 14.4 per cent, followed closely by Melbourne at 13.4 per cent.

The total value of Australia’s 9.9 million residential dwellings increased $163.1 billion to $6.6 trillion. The mean price of dwellings in Australia is now $669,700.

This ongoing rise may go counter to some recent data, although we note the CoreLogic data this week also shows rises in most centres, after recent softer data.

But of course the ABS data is prior to the recent regulatory interventions. As the HIA puts it:

“There is evidence that since March 2017 dwelling price growth has slowed following the introduction of additional restrictions by APRA and increased barriers to foreign investor participation imposed at federal and state level”.

So the next ABS series, due out in 3 months will be the one to watch.  Why do we need to wait so long for this data? The ABS is very slow to generate this particular series.


Trend Unemployment Unchanged, Again, But…

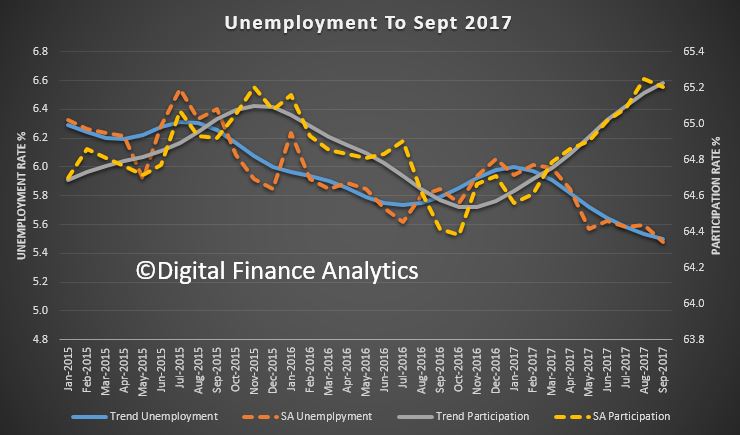
The May 17 trend unemployment remained at 5.7% according to ABS figures released today. Full time employment grew again, and participation was higher, but the trend underemployment rate, which is a quarterly measure of employed persons wanting more hours, increased from 8.7 per cent to 8.8 per cent between February and May 2017. Further pressure on household incomes.

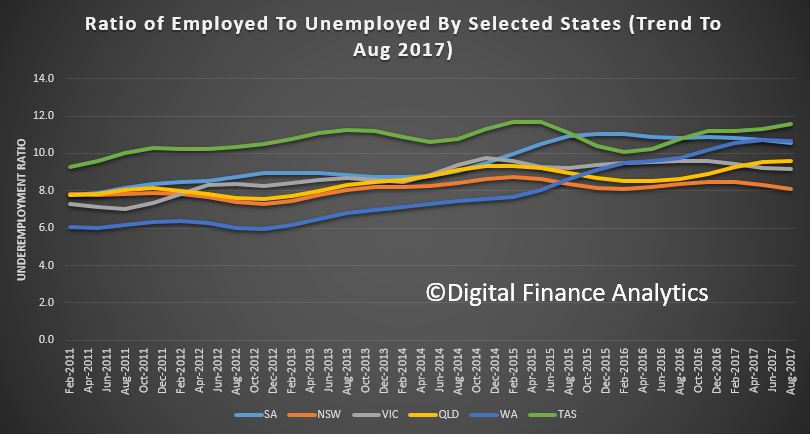
Significant state variations remain, with trend unemployment in SA at 7.1% and NT at 3.2%; the former rising, the latter falling.

Monthly trend full-time employment increased for the eighth straight month in May 2017, according to figures released by the Australian Bureau of Statistics (ABS) today. Full-time employment grew by a further 19,300 persons, while part-time employment increased by 5,900 persons, underpinning an increase in total employment of 25,200 persons.

“Full-time employment has increased by around 124,000 persons since September 2016, with particular strength over the past five months, at around 20,000 persons per month,” said Chief Economist for the ABS, Bruce Hockman.

Over the past year, trend employment increased by 194,200 persons (or 1.6 per cent), which is still below the average year-on-year growth over the past 20 years (1.8 per cent). It has increased since December 2016, when the year-on-year growth was at 0.8 per cent and reflected relatively low employment growth through most of 2016.

The trend monthly hours worked increased by 2.9 million hours (0.2 per cent) to 1,677.7 million hours in May 2017. Most of this increase was hours worked by full-time workers.

The trend unemployment rate in Australia remained at 5.7 per cent in May 2017. The trend underemployment rate, which is a quarterly measure of employed persons wanting more hours, increased from 8.7 per cent to 8.8 per cent between February and May 2017.

“The underemployment rate is an important indicator of the spare capacity of workers in Australia, and has risen for the sixth consecutive quarter to a historical high of 8.8 per cent,” Mr Hockman said.

The trend underutilisation rate, which includes both unemployment and underemployment, remained at 14.5 per cent in May 2017.

Trend series smooth the more volatile seasonally adjusted estimates and provide the best measure of the underlying behaviour of the labour market.

The seasonally adjusted number of persons employed increased by 42,000 in May 2017. The seasonally adjusted unemployment rate decreased by 0.2 percentage points to 5.5 per cent, and the seasonally adjusted labour force participation rate increased slightly to 64.9 per cent.

“The trend unemployment rate has been relatively stable over the past 18 months, at around 5.7 to 5.8 per cent, while the seasonally adjusted rate has also been relatively constrained, between 5.5 and 6.0 per cent,” Mr Hockman said.

Significant state variations remain, with SA at 7.1% and NT at 3.2%.

The Great Lending Rotation Is Upon Us

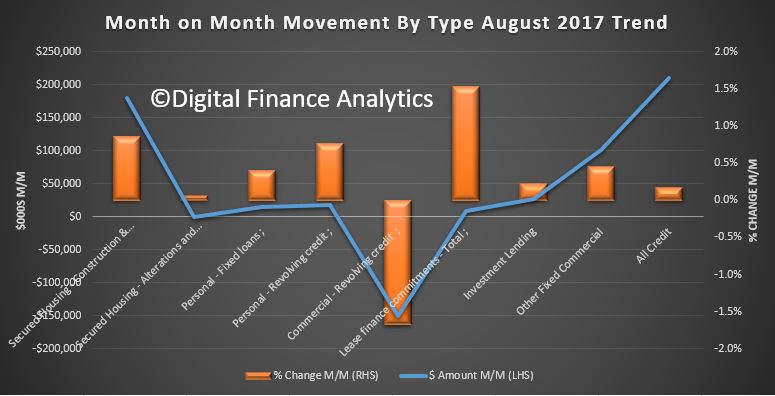
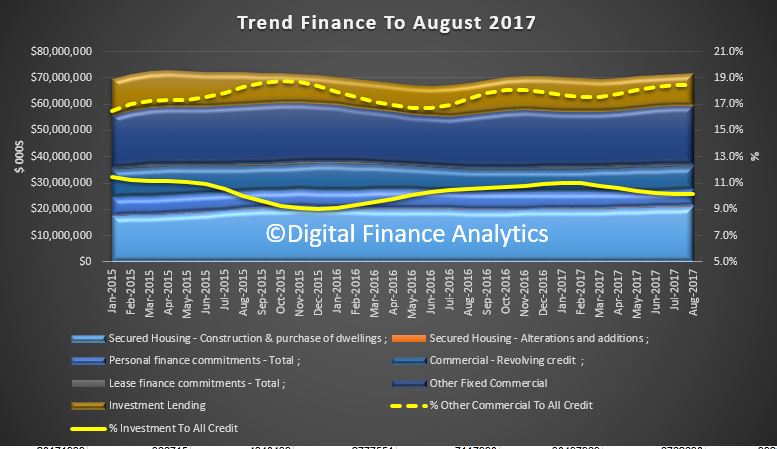
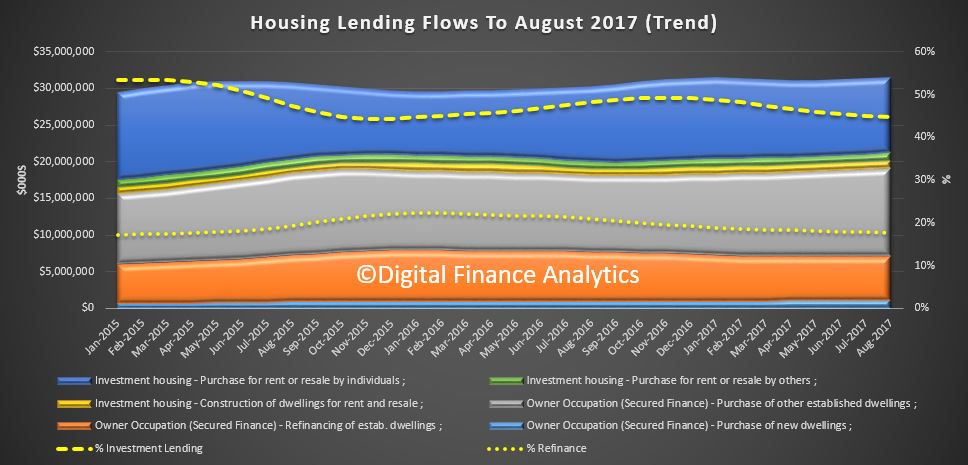
The bumper edition of ABS data today, just before the long weekend included both the housing finance data and the lending finance data for April. Investor lending is on the turn now, and first time buyers are also retreating. The question now is what will this do to house prices, and the debt burden many households are currently under?

We think this marks a significant point of rotation for the housing market. However, business lending is not accelerating, leaving a significant growth hole in the economy.

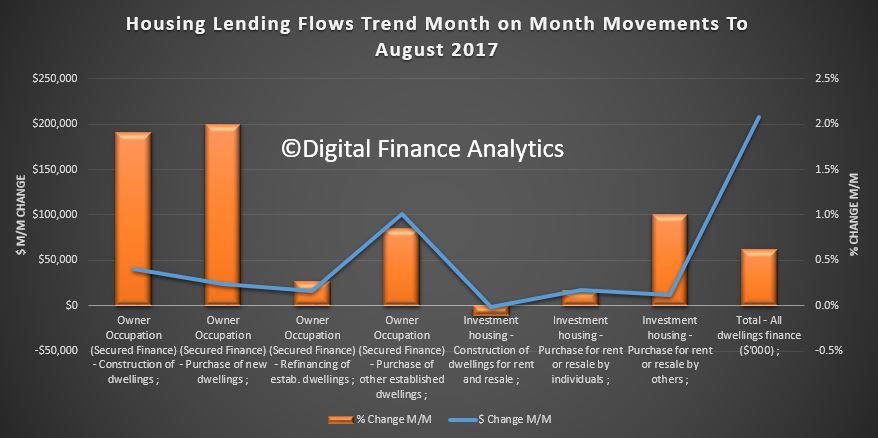
Looking at the housing lending, overall lending flows fell 0.4% in trend terms from March, to $32.8 billion. Within that owner occupied loans fell 0.1% to $19.9 billion and investment lending fell 1% to $12.6 billion.

Refinance loans fell significantly, and the proportion of loans for investment purposes also fell.

Looking at the number of commitments, overall this fell by 0.5% to 53,062, with the purchase of new dwellings down 0.7% to 44,443. Purchase of new dwellings was down 0.1% to 2,755 and the construction of dwellings was up 0.6% to 5,864.

Revisions to the data have changed the trends, with owner occupied loans stronger, and investment loans weaker.

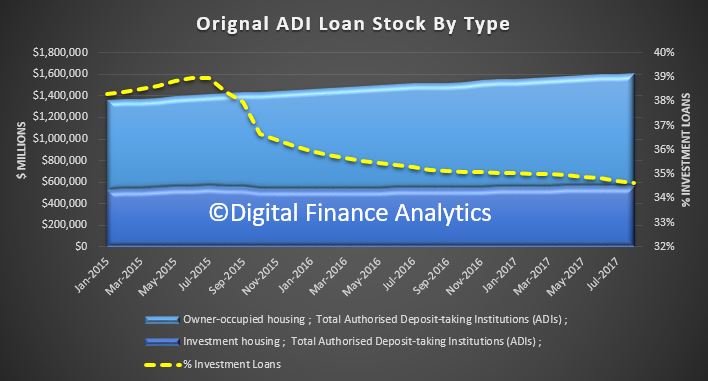
Looking at the stock of loans, overall values were higher again.

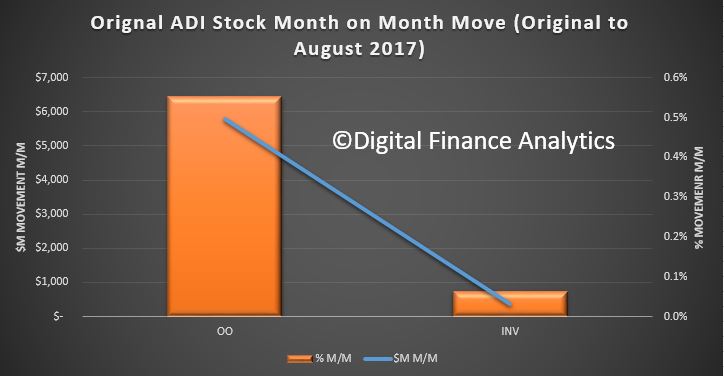
Owner occupied loans net rose $5.7 billion, or 0.56%, whilst investment loans rose $2.1 billion or 0.39%. Both Building Societies and Credit Unions saw a net loss in portfolio value.

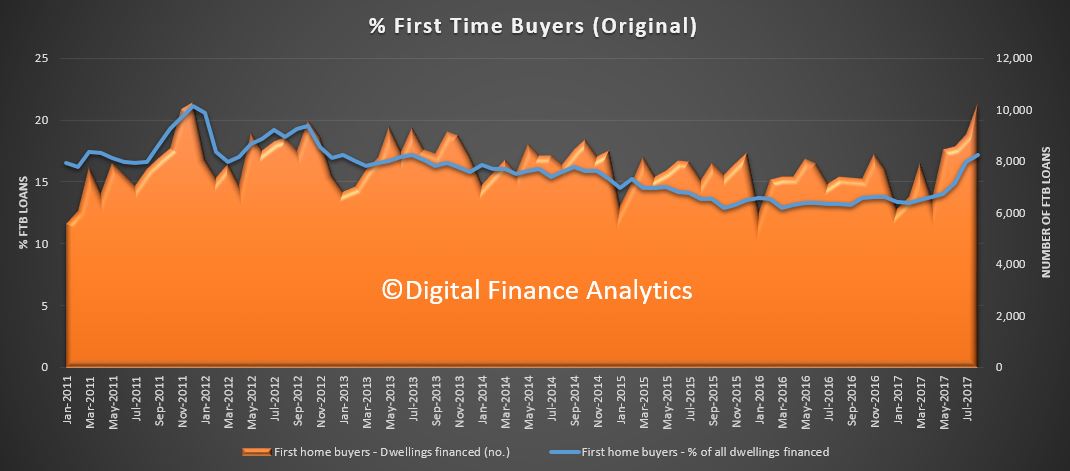
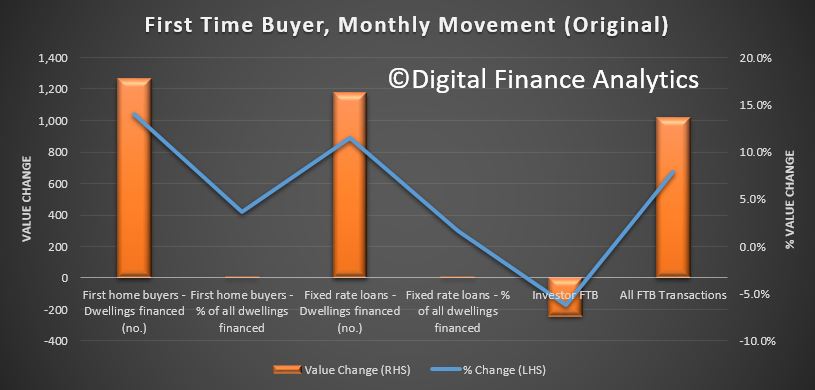
In original terms, the number of first home buyer commitments as a percentage of total owner occupied housing finance commitments rose to 13.9% in April 2017 from 13.5% in March 2017. The number of first home buyer commitments decreased by 17.5% to 6,547 in April from 7,939 in March; the number of non-first home buyer commitments also decreased.

There was a big fall in the number of first time buyer commitments, offsetting the rise in the previous month.

We continue to track momentum in investor first time buyers, another 4,000 joined the ranks this past month.

The ABS says that in this issue, revisions have been made to the original series as a result of improved reporting of survey and administrative data. These revisions have affected the following series:

  • Owner occupied housing for the month of March 2017.
  • Investment housing for the month of March 2017.
  • Housing loan outstandings to households for owner occupation series for the periods January 2017 to March 2017.


Securitisation Still Going Sideways

The ABS released their data on Australian securitisers today. At 31 March 2017, total assets of Australian securitisers were $121.6b, up $4.4b (3.8%) on 31 December 2016.

Residential mortgages continue to make up most of the transactions and there was a small overall lift, but in the past year the value of mortgages fell 0.9%. So whilst the securitisation conduits are open, and pricing reasonable (if higher than pre-GFC), overall volumes are still well below their 2007 peaks. This is because other forms of funding are available, including direct investment. Most securitisation instruments are sold to Australian investors.

During the March quarter 2017, the increase in total assets was primarily due to an increase in other loans (up $1.9b, 12.0%), residential mortgage assets (up $1.3b, 1.4%) and cash and deposits (up $1.0b, 27.2%).

At 31 March 2017, total liabilities of Australian securitisers were $121.6b, up $4.4b (3.8%) on 31 December 2016. The increase in total liabilities was due to an increase in long term asset backed securities issued in Australia (up $7.6b, 7.8%). This was partially offset by a decrease in short term asset backed debt securities issued in Australia (down $1.9b, 42.0%) and loans and placements (down $0.6b, 6.4%).

At 31 March 2017, asset backed securities issued in Australia as a proportion of total liabilities increased to 88.6%, up 1.5% on the December quarter 2016 proportion of 87.1%. Asset backed securities issued overseas as a proportion of total liabilities decreased to 3.8%, down 0.3% on the December quarter 2016 proportion of 4.1%.

Growth Slowed in the March Quarter to 0.3 per cent

Data from the Australian Bureau of Statistics (ABS) shows the pace of growth of the Australian economy slowed in the March quarter to 0.3 per cent in seasonally adjusted chain volume terms. Through the year, GDP grew 1.7 per cent.

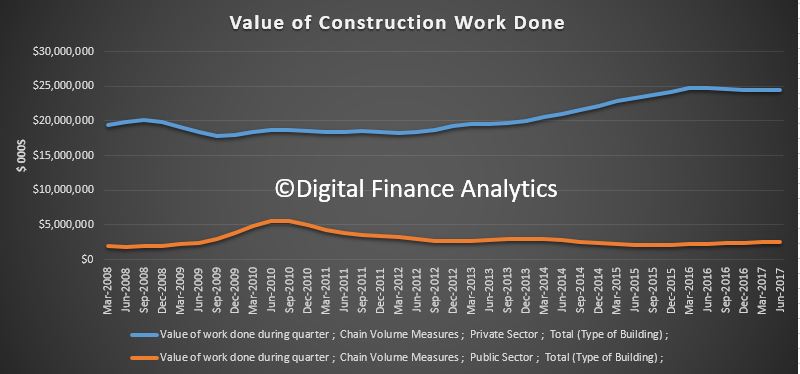
Investment in new housing fell by 4.4 per cent in the March Quarter 2017 which brings the sector down from record high investment in December 2016 and back to levels similar to those experienced at the start of 2016.

As Saul Estlake noted in The Conversation today:

It’s now been 103 quarters (25 years and 9 months) since Australia last had consecutive quarters of negative growth in real gross domestic product (GDP), in the March and June quarters of 1991.

Contrary to much-repeated claims, the Netherlands didn’t experience more than a quarter-century of economic growth without consecutive quarters of negative real GDP growth between the early 1980s and the global financial crisis.

The Netherlands’ real GDP declined by 0.3% in the June quarter of 2003, and by 0.01% in the September quarter of that year, according to data published by Statistics Netherlands and, separately, by the OECD. So, at best, the Netherlands went for only 22 years without experiencing a recession. Australia surpassed that benchmark in 2013.

Yes, that second quarterly decline in 2003 was almost imperceptible. But sporting records are delineated by margins as small as one one-hundredth of a second, so we can’t blithely discount a -0.01% fall in real GDP as “not relevant”.

Even if you blinked and missed that tiny second successive decline in real GDP in the September quarter of 2003, the Netherlands still wouldn’t hold the record for the longest run of continuous economic growth. That belongs to Japan – which, according to OECD data, went from the March quarter of 1960 to the March quarter of 1993 without ever registering two or more consecutive quarters of negative growth in real GDP. That’s 133 quarters, or more than 33 years.

Indeed, if Japanese GDP data were available on a quarterly basis earlier than 1960 it’s likely that this run of continuous economic growth would have been even longer, perhaps as long as 38 years, inferring from annual data available back to 1955. So Australia would need to avoid consecutive quarters of negative real GDP growth until at least 2024 if it is truly to be able to claim this “world record” as its own.

Even more importantly, the definition of a technical recession as (two or more consecutive quarters of negative growth in real GDP) is, as former RBA Governor Glenn Stevens said, “not very useful”. It was originally proposed in December 1974 by Julius Shishkin, who at that time was the head of the Economic Research and Analysis Division of the US Census Bureau (now the Bureau of Economic Analysis, which publishes the US national accounts).

It’s not used to identify recessions in the US. It takes no account of differences over time, or as between countries, in the rates of growth of either population or productivity – which are the key determinants of whether a given rate of economic growth is sufficient to prevent a sharp rise in unemployment. This is something which most people (other than economists) would use to delineate a recession.

While Australia has avoided consecutive quarterly contractions in real GDP since the first half of 1991, we’ve had two periods of consecutive quarterly declines in real per capita GDP (in 2000 and 2006). We’ve also had two periods of consecutive quarterly declines in real gross domestic income or GDI, which takes account of income gains or losses accruing from movements in Australia’s terms of trade (in 2008-09, and in 2014). Perhaps most meaningfully of all, Australia has had two episodes where the unemployment rate has risen by one percentage point or more in 12 months or less (in 2001 and 2009).

That’s still a better track record than almost any other advanced economy during the past quarter-century or so – and it reflects well on the quality of economic management (and the nature of our luck) over this period. Nonetheless, we shouldn’t be in the business of awarding ourselves prizes to which we’re not entitled.

And the long term trend also highlights a slowing, so we need new growth engines if we are to keep the growth ball in the air!

Growth was recorded across the economy with 17 out of 20 industries growing during the quarter. Strong growth was observed within the service industries including Finance and Insurance Services, Wholesale Trade, and Health Care and Social Assistance.

Agriculture, Forestry and Fishing decreased after strong growth in the previous two quarters, while Manufacturing decreased for the tenth time in eleven quarters.

Chief Economist for the ABS, Bruce Hockman said; “This broad-based growth was tempered by falls in exports and dwelling investment. Dwelling investment declined in all states, except Victoria, and overall is the largest decline for Australia since June 2009.”

Compensation of employees (COE) increased 1.0 per cent in the March quarter, a pick up from the negative growth recorded in the December quarter, and is consistent with other labour market data. COE is still only 1.5 per cent higher through the year, continuing to contribute to the reduction in the household saving rate. The household saving ratio fell to 4.7 in the March quarter, half the rate it was in March quarter 2013.

Mr Hockman said; “Even though there was a fall in dwelling investment this quarter, levels are still historically high. There was also positive growth in household consumption, albeit in non-discretionary items such as electricity and fuel purchases. The softer growth in household consumption is broadly in line with modest income growth.”

Current Account Deficit Narrows to $3.1 billion

For the third quarter in succession, higher export commodity prices contributed to a narrowing of the current account deficit in the March quarter 2017, according to latest figures from the Australian Bureau of Statistics (ABS).

The seasonally adjusted current account deficit fell $403 million (11 per cent) to $3,108 million in the March quarter 2017. In seasonally adjusted terms, the balance on goods and services surplus in the March quarter 2017 is the highest on record at $9,242 million. Exports of goods and services rose $4,852 million (5 per cent) and imports of goods and services rose $1,723 million (2 per cent). The primary income deficit widened $2,712 million (29 per cent).

In volume terms, imports grew this quarter while exports went down, and as a result international trade is expected to detract 0.7 percentage points from growth in the March quarter 2017 Gross Domestic Product. In seasonally adjusted chain volume terms, the balance on goods and services surplus decreased $2,966 million (85 per cent) to $543 million.

Australia’s net international investment position was a liability of $1,025.5 billion at 31 March 2017, a decrease of $2.7 billion on the revised 31 December 2016 position of $1,028.2 billion.

Australia’s net foreign debt liability decreased $13.6 billion (1 per cent) to a net liability position of $1,015.0 billion. Australia’s net foreign equity had a turnaround of $10.9 billion from a net asset position of $0.3 billion at 31 December 2016 to a net liability position of $10.6 billion at 31 March 2017.