Anemic Retail Sales Continues

The trend estimate for Australian retail turnover rose 0.1 per cent in April 2017 following a 0.1 per cent rise in March 2017. Compared to April 2016 the trend estimate rose 2.7 per cent according to the latest Australian Bureau of Statistics (ABS) Retail Trade figures.

There were rises in food retailing (0.2 per cent), cafes, restaurants and takeaway food services (0.2 per cent), department stores (0.4 per cent), and other retailing (0.4 per cent); whilst household goods retailing fell  (0.1 per cent) and clothing footwear and personal accessory retailing fell (0.4 per cent).

In April 2017, South Australia led the rise  (0.4 per cent), with rises also in Australian Capital Territory (0.3 per cent), Victoria (0.3 per cent), Tasmania (0.1 per cent), and New South Wales. Queensland and Western Australia did not change, the Northern Territory fell slightly. (0.1 per cent).

The more reported, but less reliable seasonally adjusted retail turnover rose 1.0 per cent in April 2017, following a fall of 0.2 per cent in March 2017, so look out for the “better than expected” commentary. We do not believe it.

Anyhow, for the records, in seasonally adjusted terms, there were rises in food retailing (1.2 per cent), cafes, restaurants and takeaway food services (1.1 per cent), department stores (2.5 per cent), other retailing (0.6 per cent), household goods retailing (0.4 per cent) and clothing, footwear and personal accessory retailing (0.3 per cent).

In seasonally adjusted terms there were rises in all states and territories. Queensland (2.4 per cent) led the rise, and there were also rises in Victoria (1.0 per cent), South Australia (1.1 per cent), Western Australia (0.4 per cent), New South Wales (0.1 per cent), Tasmania (1.2 per cent), the Northern Territory (1.8 per cent) and the Australian Capital Territory (0.9 per cent) in April 2017.

Online retail turnover contributed 3.4 per cent to total retail turnover in original terms.

Dwelling Approvals Rose A Little In April

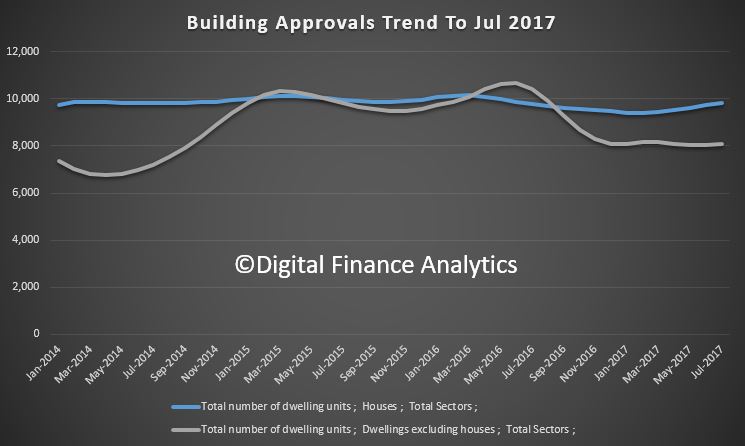
The number of dwellings approved rose 0.1 per cent in April 2017, in trend terms, and has risen for three months, according to data released by the Australian Bureau of Statistics (ABS) today.

Dwelling approvals increased in April in the Australian Capital Territory (3.6 per cent), Queensland (3.4 per cent), New South Wales (1.7 per cent), South Australia (1.6 per cent) and Tasmania (0.3 per cent), but decreased in Victoria (3.2 per cent), Western Australia (2.3 per cent) and the Northern Territory (2.2 per cent) in trend terms.

In trend terms, approvals for private sector houses fell 0.2 per cent in April. Private sector house approvals rose in South Australia (2.0 per cent), Victoria (0.3 per cent) and New South Wales (0.2 per cent), but fell in Queensland (2.0 per cent). Private house approvals were flat in Western Australia.

The movements across states show an upswing in SA, slight rises in VIC, NSW and WA, and a sharp fall in QLD.

In seasonally adjusted terms, dwelling approvals increased by 4.4 per cent in April, driven by a rise in total dwellings excluding houses (8.9 per cent) and total house approvals (0.8 per cent).

The value of total building approved rose 2.5 per cent in April, in trend terms, and has risen for three months. The value of residential building rose 0.2 per cent while non-residential building rose 6.9 per cent.

“Dwelling approvals have been relatively stable in trend terms over the past three months, after falling from record highs in mid-2016,” said Daniel Rossi, Assistant Director of Construction Statistics at the ABS. “The April 2017 data showed that the number of dwellings approved is now 14 per cent below the peak in May 2016”.

Construction Work Falls In March Quarter

The ABS preliminary trend data shows a fall overall of 6.8% compared with a year ago to $46.2 billion. Within that residential construction fell 1%, non-residential construction fell 3.5% and engineering fell 12.4%. The trend for total building work was down 1.1% in the March quarter.

In fact only the public sector non-residential construction held momentum. In other words, it is government spending which is holding the number up, whilst private sector investment is falling.

Within the residential data new houses and other residential both fell.

Once again the lack of business investment is taking its toll. With housing coming off, growth looks more uncertain, and only Government spending on infrastructure can it seems can save the day (but at what cost?)

Unemployment Rate at 5.8 per cent for the Fourth Consecutive Month

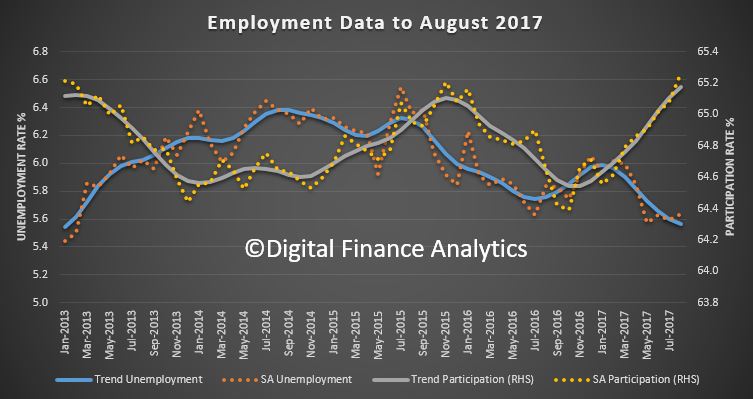
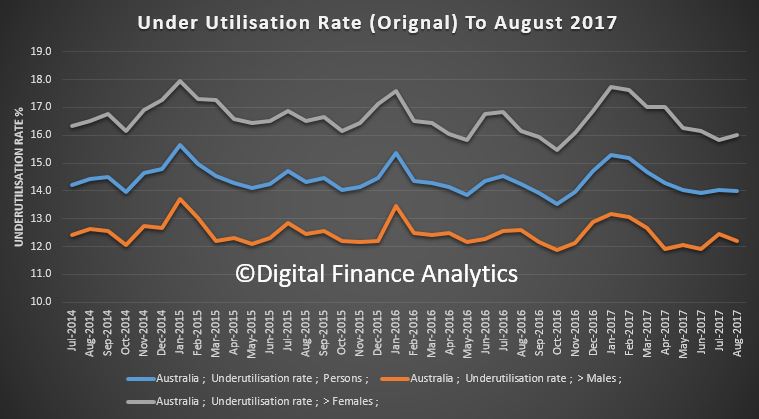
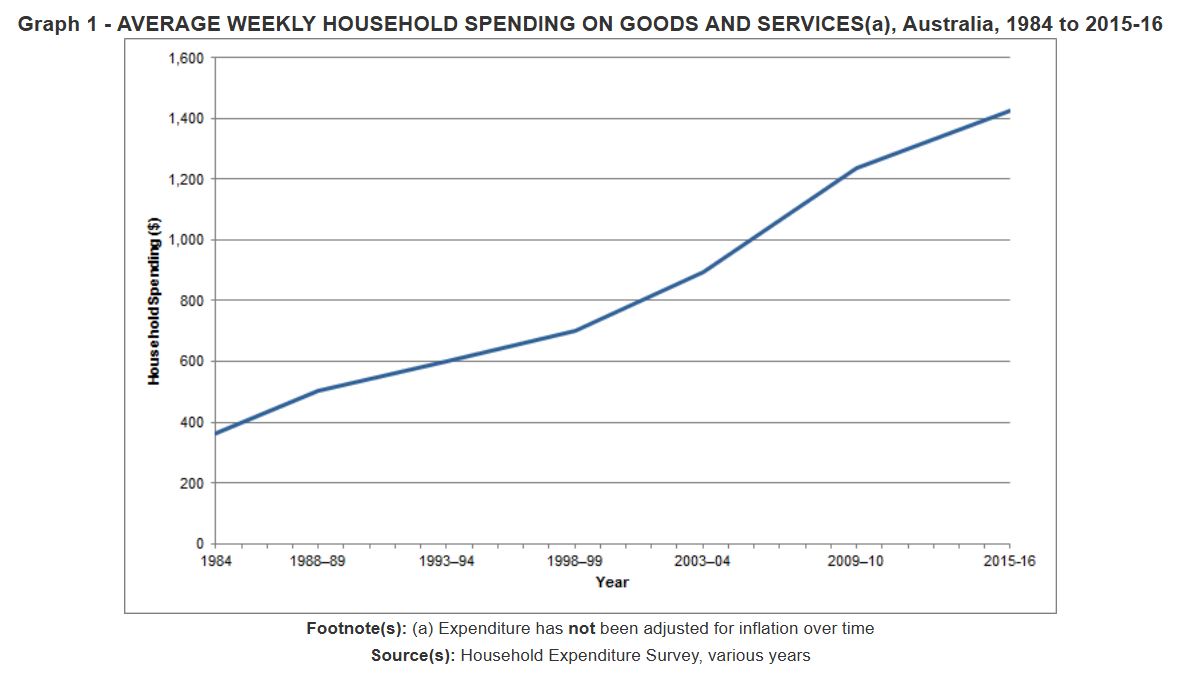
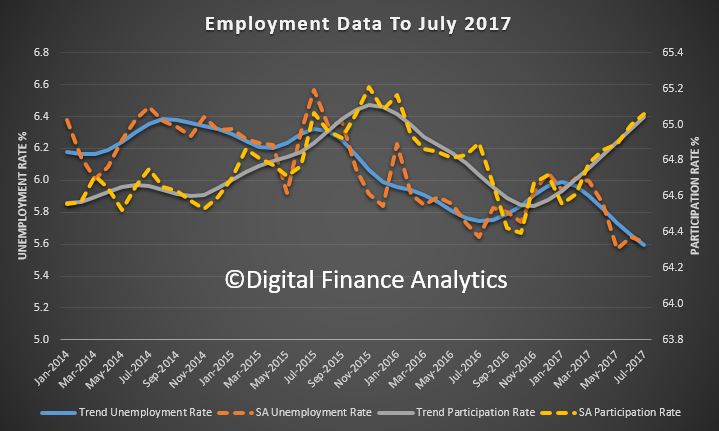
The latest employment data from the ABS does not look too bad on first blush, it beat expectations, especially if you go for the wobbly seasonally adjusted series. However the continued rise in part-time employment (up 3.6%) compared with full-time (up 0.1%) highlights the problem with low take home pay, and when added to the falling wage growth in real terms, it explains why household finances are taking a battering, and why mortgage stress is up again.  Also significant differences if you compare WA with NSW.

Trend employment increased by 19,900 persons to 12,071,300 persons in April 2017, according to figures released by the Australian Bureau of Statistics (ABS) today. Total employment growth over the year was 1.3 per cent, which remains below the average growth rate over the past 20 years of 1.8 per cent.

Over the past year there was a larger increase in trend part-time employment (102,800) than full-time employment (49,300) – around two-thirds of the total increase in employment. This was considerably more pronounced in the trend hours worked, which grew by 3.6 per cent for the part-time employed, and 0.1 per cent for those employed full-time.

Australia’s trend unemployment rate remained at 5.8 per cent for the fourth consecutive month.

“For almost 18 months, the trend unemployment rate has been relatively stable, at around 5.7 to 5.8 per cent” said Bruce Hockman, General Manager of the ABS Macroeconomic Statistics Division. “We haven’t seen this stability since the May 2007 to October 2008 period, when it remained around 4.2 to 4.3 per cent.”

The trend participation rate increased by less than 0.1 percentage points to 64.8 per cent.

Trend series smooth the more volatile seasonally adjusted estimates and provide the best measure of the underlying behaviour of the labour market.

The seasonally adjusted number of persons employed increased by 37,400 in April 2017. The seasonally adjusted unemployment rate decreased 0.2 percentage points to 5.7 per cent, and the seasonally adjusted labour force participation rate remained steady at 64.8 per cent.

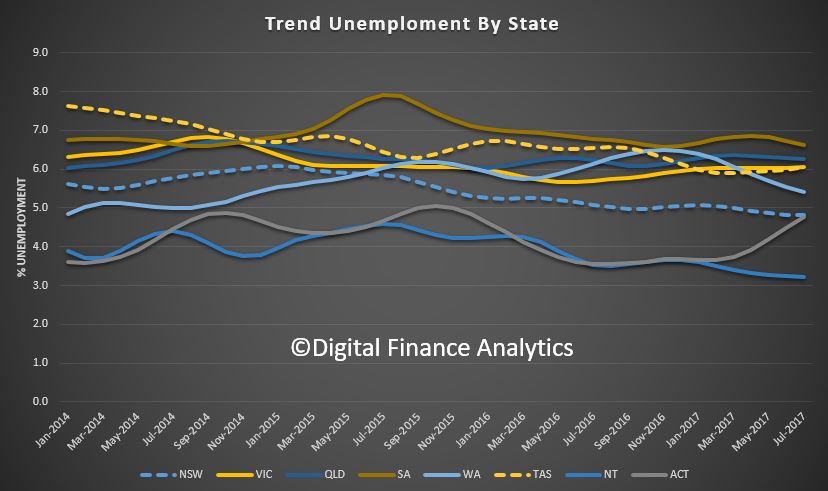
The comparison between the numbers in WA and NSW (the last and first placed states from an economic perspective) tells an interesting story.

Unemployment has been falling in NSW, and has turned the corner in WA, after a steady climb. However the participation rate in WA is significantly higher and is rising, whilst it is lower and falling in NSW. This reflects a range of factors, including demographic distribution, industry mix and part time work options.  The falling rate in NSW should be regarded as a warning of trouble ahead when it comes to looking at household finances.

Lending Finance In March Still About Housing

The ABS released their lending finance statistics for March 2017.  We see the problem again of not enough productive commercial lending, as banks chase property lenders. Revolving commercial credit did rise.

Overall trend finance flow in trend terms rose 1.3% to $70 billion, up $691 million. Within that, the total value of owner occupied housing commitments excluding alterations and additions rose 0.1% in trend terms, to $20.1 billion, up $26 million; and the seasonally adjusted series rose 0.9%.

The trend series for the value of total commercial finance commitments fell 0.3% to $42.3 billion, down $142 million. Fixed lending commitments fell 1.4% down $461 million to $33.5 billion, while revolving credit commitments rose 3.8%, up $319 million to $8.8 billion.

The seasonally adjusted series for the value of total commercial finance commitments rose 13.0%. Revolving credit commitments rose 36.8% and fixed lending commitments rose 7.1%.

Within the fixed commercial lending category, lending for investment housing fell 0.3%, down $44 million to $13.2 billion, whilst lending for other commercial purposes fell 2%, down $416 million to $20.3 billion. 39% of fixed commercial lending was for investment housing and this continues to climb.  Most of the investment in housing was in Sydney and Melbourne.

Once again the rise unproductive investment housing lending does not support true growth, and continues to create more pressure on home prices.

The trend series for the value of total personal finance commitments fell 1.3%. Fixed lending commitments fell 1.7% and revolving credit commitments fell 0.7%.

The seasonally adjusted series for the value of total personal finance commitments fell 1.7%. Fixed lending commitments fell 3.2%, while revolving credit commitments rose 0.8%.

The trend series for the value of total lease finance commitments rose 1.3% in March 2017 and the seasonally adjusted series fell 13.0%, following a fall of 32.1% in February 2017.

Net Wages Fell To March 2017

The pincer movement of higher inflation and lower wage growth now means that average wages are falling in real terms, especially for employees in the private sector where wage growth is anemic.  Not good for those with mortgages as rates rise flow though.

The ABS says the seasonally adjusted Wage Price Index (WPI) rose 0.5 per cent in March quarter 2017 and 1.9 per cent over the year, according to figures released today by the Australian Bureau of Statistics (ABS).

The WPI, seasonally adjusted, has recorded quarterly wages growth in the range of 0.4 to 0.6 per cent for the last 12 quarters (from June quarter 2014).

Seasonally adjusted, private sector wages rose 1.8 per cent and public sector wages grew 2.4 per cent through the year to March quarter 2017.

In original terms, through the year wage growth to the March quarter 2017 ranged from 0.6 per cent for the mining industry to 2.3 per cent for public administration and safety, education and training, and health care and social assistance industries.

Western Australia recorded the lowest through the year wage growth of 1.2 per cent and Tasmania the highest of 2.3 per cent.

Housing Finance On The Slide

Latest data from the ABS for March 2017 shows that the trend estimate for the total value of dwelling finance commitments excluding alterations and additions was $33.4 billion, down 0.1%. Owner occupied housing commitments was $20.1 billion up 0.1% while investment housing commitments was $13.2 billion down 0.3%.

Within the mix, owner occupied refinance flows fell 1.1% and investment finance by individuals fell 0.5%.  In trend terms, the number of commitments for the construction of dwellings rose 0.4% and the number of commitments for the purchase of new dwellings rose 0.2%. The number of commitments for the purchase of established dwellings fell 0.1%.

Investment housing lending comprised 40% of monthly flows, refinance 18.4% (and still trending down) whilst funding for new construction continued at about 8.7%.

Total ADI loan stock grew by 0.4%, with owner occupied loans growing just a little faster than investment loans.

Investment loans comprise 35% of the total book.

The number of owner occupied first time buyers rose in March by 20.5% to 7946 in original terms, a rise of 1,350.  In original terms, the number of first home buyer commitments as a percentage of total owner occupied housing finance commitments rose to 13.6% in March 2017 from 13.3% in February 2017.

The DFA surveys saw a small rise in first time buyers going to the investment sector as their first property purchase. Total first time buyers were up 12.3% to 12,756, still well below their peak from 2011 when they comprised more than 30% of transactions.

Note the ABS has revised the data series:

In this issue, revisions have been made to the original series as a result of improved reporting of survey and administrative data. These revisions have affected the following series:

  • Owner-occupied finance from May 2012 to February 2017.
  • Investment housing finance from July 2013 to February 2017.
  • Housing loan outstandings to households for owner occupation series for the periods May 2016 to January 2017.

The number and value of commitments for the purchase of newly erected dwellings have been revised for the period May 2012 to June 2013, and consequentially the number and value of commitments for the purchase of established dwellings have been revised for the same period.


Retail Turnover Down Again In March

Australian retail turnover fell 0.1 per cent in March 2017, seasonally adjusted, according to the latest Australian Bureau of Statistics (ABS) Retail Trade figures. This follows a fall of 0.2 per cent in February 2017. This continues the weakness which is related to big debt and flat incomes. QLD looks a particular concern.

In seasonally adjusted terms, there were falls in food retailing (-0.5 per cent), cafes, restaurants and takeaway food services (-0.5 per cent), department stores (-0.6 per cent) and household goods retailing (-0.1 per cent). These falls were offset by rises in other retailing (1.1 per cent) and clothing, footwear and personal accessory retailing (0.4 per cent).

In seasonally adjusted terms, there were falls in Queensland (-1.3 per cent), the Northern Territory (-1.8 per cent), South Australia (-0.1 per cent) and Tasmania (-0.2 per cent). There were rises in Victoria (0.4 per cent), New South Wales (0.1 per cent), the Australian Capital Territory (0.3 per cent) and Western Australia (0.1 per cent).

The trend estimate for Australian retail turnover was relatively unchanged (0.0 per cent) in March 2017 following a 0.1 per cent rise in February 2017. Compared to March 2016, the trend estimate rose 2.5 per cent.

Online retail turnover contributed 3.7 per cent to total retail turnover in original terms.

In seasonally adjusted volume terms, turnover rose 0.1 per cent in the March quarter 2017, following a rise of 0.7 per cent in the December quarter 2016. The main contributors to this rise were food retailing (0.6 per cent), household goods retailing (0.4 per cent) and other retailing (0.4 per cent).

Trend Dwelling Approvals Rise 0.8% in March, But…

The number of dwellings approved in Australia rose 0.8 per cent in March 2017, in trend terms, after falling for nine months, according to data released by the Australian Bureau of Statistics (ABS) today. However the more volatile seasonally adjusted series took another fall.

Dwelling approvals increased in March in New South Wales (3.0 per cent), Tasmania (1.6 per cent), Queensland (0.5 per cent) and Victoria (0.3 per cent), but decreased in the Northern Territory (19.1 per cent), Australian Capital Territory (7.1 per cent), Western Australia (1.9 per cent) and South Australia (0.1 per cent) in trend terms.

In trend terms, approvals for private sector houses fell 0.6 per cent in March. Private sector house approvals fell in Queensland (2.0 per cent), South Australia (0.4 per cent) and Victoria (0.3 per cent), but rose in New South Wales (0.3 per cent) and Western Australia (0.1 per cent).

In seasonally adjusted terms, dwelling approvals decreased by 13.4 per cent in March, driven by a fall in total dwellings excluding houses (22.0 per cent) and total house approvals (5.0 per cent).

The value of total buildings approved rose 0.1 per cent in March, in trend terms, after falling for seven months. The value of residential building approved rose 1.0 per cent while non-residential building approved fell 1.9 per cent.

Inflation rises 0.5 per cent in the March quarter 2017

The data from the ABS today shows that the Consumer Price Index (CPI) rose 0.5 per cent in the March quarter 2017. This follows a rise of 0.5 per cent in the December quarter 2016. The CPI rose 2.1 per cent through the year to March quarter 2017. The trimmed mean was 1.9 per cent. Housing costs rose 2.5 per cent is the past year.

In original terms, Melbourne prices rose 0.9% in the quarter, highlighting the pressure on households there. As we said the other day, average CPI is understating what is happening in Victoria at the moment.

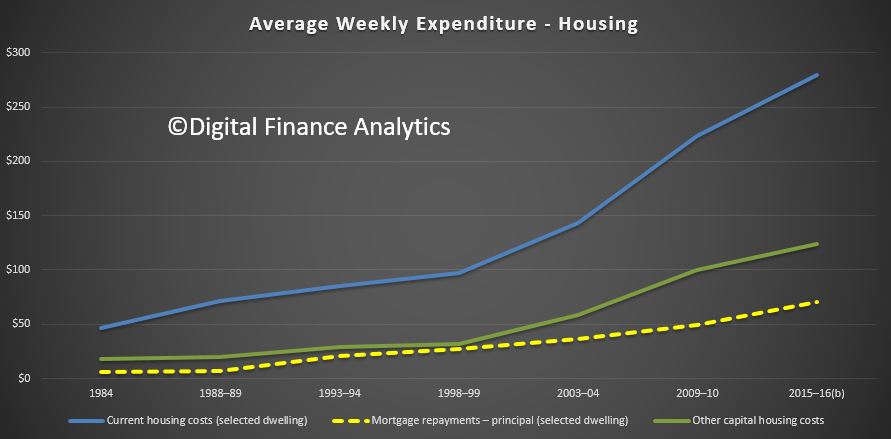
This data confirms the next RBA cash rate adjustment is more likely up, than down. It also underscores the flat, or falling income growth households are experiencing. More pressure, more mortgage stress as cost of living rises outstrip income growth, in a rising mortgage rate market.

The most significant price rises this quarter are automotive fuel (+5.7 per cent), medical and hospital services (+1.6 per cent) and new dwelling purchase by owner-occupiers (+1.0 per cent). These rises are partially offset by falls in Furnishings, household equipment and services (-1.0 per cent) and Recreation and culture (-0.7 per cent).

Vegetable prices have risen 13.1 per cent through the year to March quarter 2017. Adverse weather conditions in major growing areas over previous periods continue to impact supply for particular vegetables (potatoes, salad vegetables, cabbages and cauliflower). Offsetting these rises are price falls for capsicums and broccoli.