ABS Confirms Property Price Rises

From The HIA.

ABS data released today confirms acceleration in the rate of growth in residential property prices in late 2016, said the Housing Industry Association.

In the year to the December 2016 quarter, dwelling price growth remained fastest in Melbourne (+10.8 per cent), followed by Sydney (+10.3 per cent). Dwelling prices also grew over the year to the December 2016 quarter in: Tasmania (+8.8 per cent); the Australian Capital Territory (+5.5 per cent); and Queensland (+3.8 per cent). Dwelling prices continued to decline in Western Australia (-4.1 per cent) and the Northern Territory (-7.0 per cent).

“This result for the December 2016 quarter shouldn’t surprise anybody. Nor should the large divergence in growth rates between Australia’s eight capital cities,” said HIA Chief Economist, Dr Harley Dale.

“The growth rate for attached dwelling prices is far slower than for existing houses, while Sydney and Melbourne price growth is way of ahead of other markets,” noted Harley Dale. “Sydney and Melbourne represent 40 percent of Australia’s population and some concern regarding the trajectory of house price growth in these two markets is warranted. Elsewhere, people still scratch their heads when it comes to a supposed housing price ‘boom’ because that simply hasn’t been their experience this cycle, even allowing for some recovery in prices in recent times.

“On the same day as we have received an update on dwelling prices there has also been speculation regarding some tension between members of Australia’s Council of Regulators, plus an (appropriate) questioning of banks’ out of cycle interest rate hikes.”

“People can make of that what they will, but let’s not lose sight of the main goal. Yes, there is some need to tighten lending conditions for some Australian housing markets in terms of geographical areas and dwelling types,” concluded Harley Dale. “However, a blanket tightening of lending conditions – as now seems to be emerging again – is the wrong policy and risks damaging Australia’s financial stability. That is the very opposite to the ideal outcome authorities want to achieve.”

Employment Data Disappoints

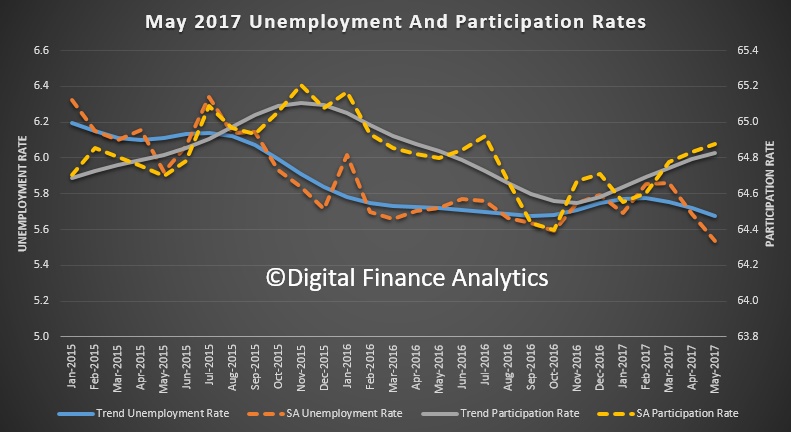
The ABS data on employment to February 2016 revealed a nasty surprise with trend unemployment restated higher, and seasonally adjusted also up. The question of course must be, given the various tweaks done by the ABS are these numbers accurate? The trend unemployment rate in Australia was 5.8 per cent. The trend participation rate was unchanged at 64.6 per cent.

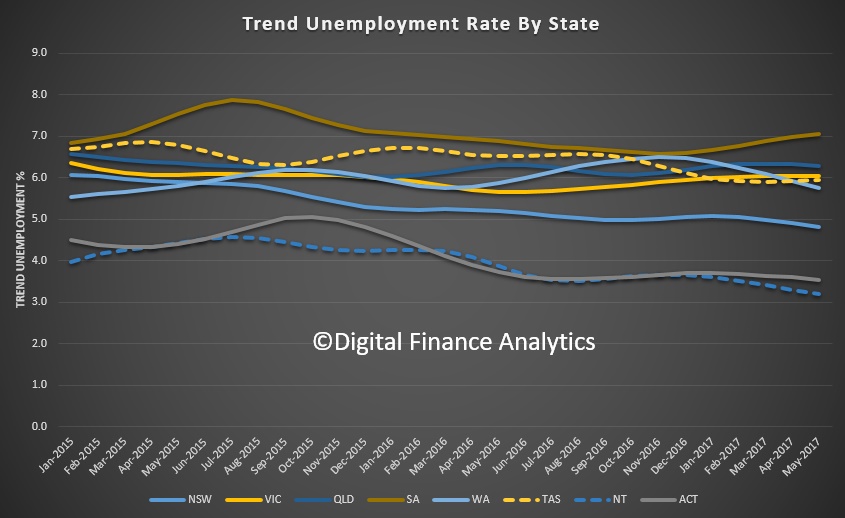
Full time jobs were up a little by 27,100, but part time jobs fell 33,500; hence a net drop. Across the states, Victoria added 10,600 jobs, but Western Australia and Queensland jobs fell by 5,500 and 11,500, respectively.

New South Wales has the lowest rate at 5.2 per cent whereas Queensland had the highest rate at 6.7 per cent. Weirdly, in Western Australia the rate fell 0.4 per cent but this was to a fall in the state participation rate.

“Over the past year, we have continued to see a relatively steady trend unemployment rate between 5.7 per cent and 5.8 per cent,” said the Acting General Manager of ABS’ Macroeconomic Statistics Division, Jacqui Jones. It should be noted that January 2017 trend unemployment rate was revised up from 5.7 per cent to 5.8 per cent, as part of the standard monthly revisions.

The quarterly trend underemployment rate remained at 8.6 per cent. “The underemployment rate is still at a historically high level for Australia, but has been relatively unchanged over the past two years,” said Ms Jones.

Trend employment increased by 11,600 persons to 12,005,000 persons in February 2017, reflecting an increase in both full-time (4,600) and part-time (6,900) employment. This was the fifth straight month of increasing full-time employment, after eight consecutive decreases earlier in 2016.

Total employment growth over the year was 0.8 per cent, which was less than half the average growth rate over the past 20 years (1.8 per cent).

The trend monthly hours worked increased by 1.2 million hours (0.1 per cent), with increases in total hours worked by both full-time workers and part-time workers.

The trend participation rate was unchanged at 64.6 per cent.

Trend series smooth the more volatile seasonally adjusted estimates and provide the best measure of the underlying behaviour of the labour market.

The seasonally adjusted number of persons employed decreased by 6,400 in February 2017. The seasonally adjusted unemployment rate increased by 0.2 percentage points to 5.9 per cent, and the seasonally adjusted labour force participation rate was unchanged at 64.6 per cent.

Investors Rule (For Now)

The latest data from the ABS for Lending Finance in January just reinforces the story that investor loans were so, so strong.  Owner occupation housing finance grew 0.5%, to $20.1 billion, personal finance was up 0.4% to % 6.9 billion and overall commercial lending fell 0.9%, down to $43 billion (thanks to significant falls in non-investment housing)

However, the share of lending for investment properties, of fixed commercial lending rose to 38.4%, the highest proportion since May 2015, and the share of commercial lending for investment property now stands at 19.1% of all lending, again the highest since May 2015.

The individual monthly movements reinforce how strong investment lending was.  There was also a 5.1% fall in revolving commercial lending.

Another view, which looks just at housing confirms the story, with construction lending for investment up 5%, and investment lending for investment up well over 1%.

The state level data also confirms that the bulk of the investment property lending is in Sydney and down the east coast to Melbourne.

We say again, this is not good news, because such strong growth in finance for investment properties simply inflates banks balance sheets and home prices, raises household debt, and escalates systemic risks. We need to funnel investment into productive business enterprise, not more housing.

Expect regulatory intervention soon.  Better (very) late than never.

New Home Lending falls back in January

Figures released today by the ABS indicate that the volume of loans for new homes eased back during January, said the Housing Industry Association.

During January 2017, the total number of owner occupier loans for the purchase or construction of new homes fell by 1.0 per cent and was 0.4 per cent lower than a year earlier. The volume of loans for new home purchase declined by 0.3 per cent during January with lending for the construction of new dwellings dipping by 1.4 per cent.

In January 2017 the number of loans to owner occupiers constructing or purchasing new homes increased in three states. Compared with January of last year, the volume of loans rose most strongly in Queensland (+13.1 per cent), followed by South Australia (+9.2 per cent) and Victoria (+8.8 per cent). The largest reduction occurred in Western Australia (-9.3 per cent), followed by Tasmania (-3.5 per cent) and New South Wales (-1.2 per cent). The volume of lending rose by 22.1 per cent in the ACT but was down by 54.8 per cent in the Northern Territory over the same period.

“Despite the reduction during January, the actual volume of loans for new homes remains at a very elevated level – about 99,620 loans were made over the year to January 2017,” noted HIA Senior Economist Shane Garrett.

“There are two dynamics going on with respect to new home loans. With 2016 representing the strongest year for new dwelling starts since the end of WWII, a huge number of new homes are now becoming available for purchase making lending volumes in this area accordingly high. However, the number of loans to people constructing their own home has actually been falling back since mid-2014 and this trend has affected overall lending activity,” Shane Garrett concluded.

Investors Boom, First Time Buyers Crash

The ABS released their Housing Finance data today, showing the flows of loans in January 2017. Those following the blog will not be surprised to see investor loans growing strongly, whilst first time buyers fell away. The trajectory has been so clear for several months now, and the regulator – APRA – has just not been effective in cooling things down.  Investor demand remains strong, based on our surveys. Half of loans were for investment purposes, net of refinance, and the total book grew 0.4%.

In January, $33.3 billion in home loans were written up 1.1%, of which $6.4 billion were refinancing of existing loans, $13.6 billion owner occupied loans and $13.5 billion investor loans, up 1.9%.  These are trend readings which iron out the worst of the monthly swings.

Looking at individual movements, momentum was strong, very strong across the investor categories, whilst the only category in owner occupied lending land was new dwellings.  Construction for investment purposes was up around 5% on the previous month.

Stripping out refinance, half of new lending was for investment purposes.

First time buyers fell 20% in the month, whilst using the DFA surveys, we detected a further rise in first time buyers going to the investment sector, up 5% in the month.

Total first time buyer activity fell, highlighting the affordability issues.

In original terms, total loan stock was higher, up 0.4% to $1.54 trillion.

Looking at the movements across lender types, we see a bigger upswing from credit unions and building societies, compared with the banks, across both owner occupied and investment loans. Perhaps as banks tighten their lending criteria, some borrowers are going to smaller lenders, as well as non-banks.

We think APRA should immediately impose a lower speed limit on investor loans but also apply other macro-prudential measures.  At very least they should be imposing a counter-cyclical buffer charge on investment lending, relative to owner occupied loans, as the relative risks are significantly higher in a down turn.

The budget has to address investment housing with a focus on trimming capital gain and negative gearing perks.  The current settings will drive household debt and home prices significantly higher again.

Managed Funds Climb Higher, Again, To $2.8 Trillion

The ABS released their quarterly managed funds data to December 2016, which shows a significant hike in market value, to $2.8 trillion. The asset bubble continues.

At 31 December 2016, the managed funds industry had $2,841.8b funds under management, an increase of $61.4b (2%) on the September quarter 2016 figure of $2,780.4b.

The main valuation effects that occurred during the December quarter 2016 were as follows: the S&P/ASX 200 increased 4.2%; the price of foreign shares, as represented by the MSCI World Index excluding Australia, increased 1.5%; and the A$ depreciated 5.2% against the US$.

Superannuation funds held the largest share of assets.

At 31 December 2016, the consolidated assets of managed funds institutions were $2,237.9b, an increase of $49.2b (2%) on the September quarter 2016 figure of $2,188.7b.

The asset types that increased were shares, $22.9b (3%); overseas assets, $19.4b (4%); land, buildings and equipment, $1.9b (1%); units in trusts, $1.9b (1%); short term securities, $1.8b (1%); deposits, $1.6b (1%); bonds, etc., $1.3b (1%) and other non-financial assets, $0.7b (6%). These were partially offset by decreases in other financial assets, $2.0b (6%) and loans and placements, $0.4b (1%). Derivatives were flat.

At 31 December 2016, there were $498.3b of assets cross invested between managed funds institutions.

At 31 December 2016, the unconsolidated assets of superannuation (pension) funds increased $54.3b (3%), life insurance corporations increased $2.4b (1%), public offer (retail) unit trusts increased $0.3b (0%) and common funds increased $0.2b (2%). Cash management trusts decreased $0.6b (2%). Friendly societies were flat.


Retail Turnover Rises In January

Australian retail turnover rose 0.2 per cent in January 2017, in trend terms, following a 0.3 per cent rise in December 2016. Compared to January 2016, the trend estimate rose 3.2 per cent according to the latest Australian Bureau of Statistics (ABS) Retail Trade figures.  Victoria showed the strongest growth. We think the lift was thanks to bargains available in the January sales.

Clothing, footwear and personal accessories rose the most in trend terms.

But in seasonally adjusted terms, there were rises in household goods retailing (1.4 per cent), cafes, restaurants and takeaway food services (1.1 per cent), food retailing (0.2 per cent), and other retailing (0.1 per cent).

These rises were offset by falls in clothing, footwear and personal accessory retailing (-0.4 per cent) and department stores (-0.5 per cent). This follows a fall of 0.1 per cent in December 2016.

The main contribution to the rise in household goods retailing was the Electrical and electronic goods industry subgroup, which rose 2.4 per cent in January in seasonally adjusted terms.

In seasonally adjusted terms, there were rises in Victoria (1.1 per cent), New South Wales (0.2 per cent), South Australia (0.6 per cent), Western Australia (0.3 per cent), the Australian Capital Territory (1.2 per cent) and Tasmania (0.4 per cent). There was a fall in the Northern Territory (-0.8 per cent). Queensland was relatively unchanged (0.0%).

Online retail turnover contributed 3.6 per cent to total retail turnover in original terms.

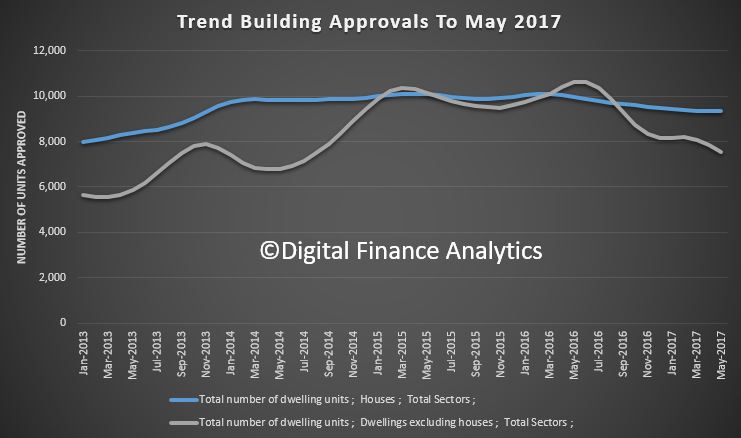
Dwelling approvals continue to fall in January

The number of dwellings approved fell 2.1 per cent in January 2017, in trend terms, and has fallen for eight months, according to data released by the Australian Bureau of Statistics (ABS) today.

Here is the data charted by the HIA. They say “new dwelling approvals have been falling back over the past year, particularly due to a reduced inflow of new multi-unit projects”.

In trend terms, dwelling approvals decreased in January in the Australian Capital Territory (19.4 per cent), Queensland (6.8 per cent), New South Wales (4.8 per cent), Northern Territory (1.7 per cent) and Western Australia (0.3 per cent). Dwelling approvals increased, in trend terms, in Tasmania (3.0 per cent), Victoria (2.9 per cent) and South Australia (1.1 per cent).

In trend terms, approvals for private sector houses fell 1.2 per cent in January. Private sector house approvals fell in New South Wales (2.2 per cent), South Australia (1.4 per cent), Western Australia (1.4 per cent), Queensland (1.0 per cent) and Victoria (0.3 per cent).

In seasonally adjusted terms, dwelling approvals increased by 1.8 per cent in January, driven by a rise in total dwellings excluding houses (6.6 per cent). Total house approvals fell 2.2 per cent

The value of total building approved fell 2.9 per cent in January, in trend terms, and has fallen for six months. The value of residential building fell 0.9 per cent while non-residential building fell 6.8 per cent.

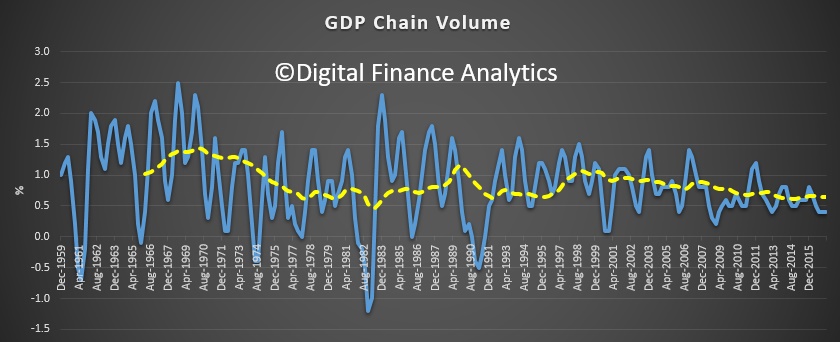
Economy grows 1.1 per cent in December quarter

So Australia dodged the “recession bullet” thanks to a rebound in the December quarter. It was helped by resources sector income from higher prices especially coal and iron ore,  households who raided their savings to lift expenditure over the Christmas season, and Government sector infrastructure spending.

But the underlying contribution from business excluding resources looks weak, and it seems the whole confection of managing the mining sector slow-down by stoking the housing sector is to be questioned.  Growth at 2.4 per cent is lower than the 3 per cent plus target.  Low interest rates are not encouraging business to invest. Even lower rates won’t help.  Low wage growth is part of the problem, but it is a symptom of underlying disease.

Data from the Australian Bureau of Statistics (ABS) shows that the Australian economy recorded broad-based growth of 1.1 per cent in seasonally adjusted chain volume terms in the December quarter 2016, a rebound from the previous quarter’s decline of 0.5 per cent,  Australia’s Gross Domestic Product (GDP) has now grown 2.4 per cent through the year.

Growth was recorded in 15 out of 20 industries. Strongest growth was observed in Mining, Agriculture, forestry and fishing, and Professional scientific and technical services, each industry contributed 0.2 percentage points to GDP growth.

Household final consumption expenditure contributed 0.5 percentage points to GDP growth. Net exports contributed 0.2 percentage points. Public and private capital formation both contributed 0.3 percentage points this quarter after both detracted from GDP growth last quarter.

The Terms of trade grew by 9.1 per cent in the December quarter due to strong price rises in Coal and Iron ore. The terms of trade is now 15.6 per cent higher than December quarter 2015. Nominal GDP grew by 3.0 per cent to be 6.1 per cent higher through the year. Real net national disposable income increased by 2.9 per cent for the quarter.

The strength in commodity prices helped drive a 16.5 per cent increase in Private non-financial corporation’s Gross operating surplus. Compensation of employees decreased 0.5 per cent for the quarter to be 1.5 per cent higher through the year. This is in line with the subdued wage price index (1.9 per cent through the year) and employment growth (0.7 per cent through the year) previously published by the ABS.

Wages growth remains at record low

The seasonally adjusted Wage Price Index (WPI) rose 1.9 per cent through the year to the December quarter 2016, according to figures released today by the Australian Bureau of Statistics (ABS). This result equals the record low wages growth recorded in the September quarter 2016.

Those in the public sector are doing better than in the commercial sector.

Seasonally adjusted, private sector wages rose 0.4 per cent and public sector wages grew 0.6 per cent in the December quarter 2016.

In original terms, through the year wage growth to the December quarter 2016 ranged from 1.0 per cent for mining to 2.4 per cent for health care and social assistance and education and training. Mining industry wage growth has continued to slow over the last three years.

Western Australia recorded the lowest through the year wage growth of 1.4 per cent and Tasmania the highest of 2.4 per cent.

If you correct for inflation, wages in real terms are hardly growing at all.  The trajectory is towards zero!

This is really bad news for those highly in debt households, who on any measure you care to select, have a massive burden thanks mainly to excessive home price growth and mortgage lending. As we have said before, this is a toxic mix, and as mortgage rates rise, as they will, more households will struggle to balance their budgets, dampening discretionary spending and having to wrestle with greater mortgage stress.  According to our research 20% of households would struggle with even a small lift in rates.