The Chill Wind of Underemployment

Whilst the headline ABS data on unemployment may have read ok, there is a critical issue which is having a draining effect on productivity, growth, household incomes and confidence. This is the spectre of underemployment.

The trend data tells the story. There are more than one million people who, though they have some work, want more. This equates to around nine percent of the working population. Some may have just a few hours work each week, yet are counted as employed.

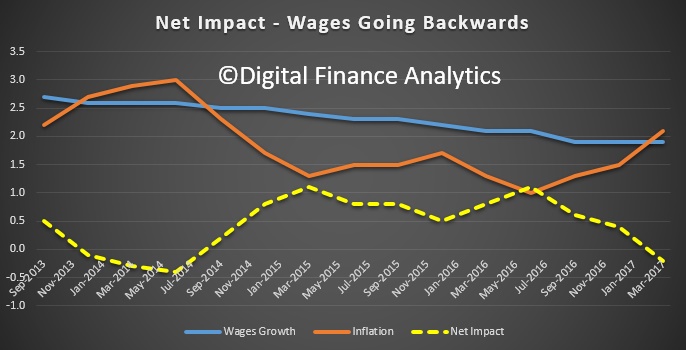
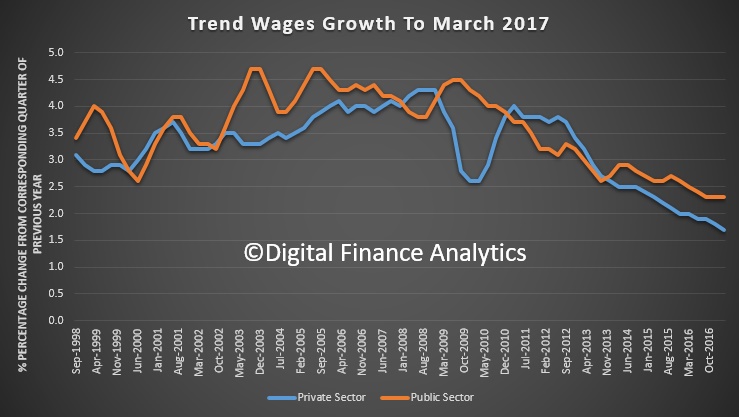
This has a drag effect on wage growth (which is for many at zero currently) and this flows into lower household incomes, despite rising debt and other household costs.

The mirror image is those in full time work but who are working for longer, and out of core hours thanks to the digital transformation in hand. For many of these people, work-life balance is also shot!

Full-time employment increased for fourth straight month

Monthly trend full-time employment increased by 6,500 in Australia in January 2017, according to figures released by the Australian Bureau of Statistics (ABS) today. This was the fourth consecutive month of increasing full-time employment, after eight consecutive decreases earlier in 2016.

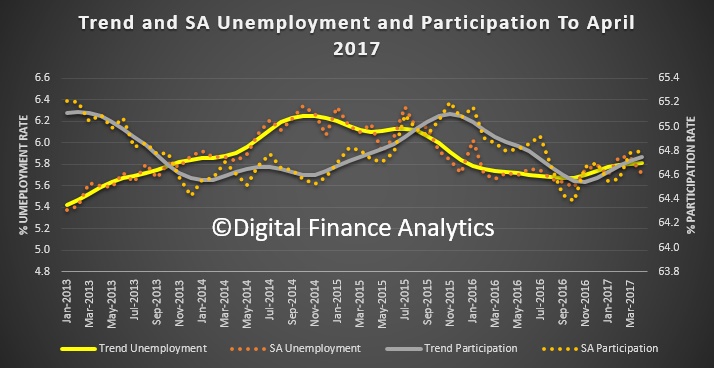
The trend unemployment rate was 5.7 per cent for the ninth consecutive month. The trend participation rate was unchanged at 64.6 per cent.


Total trend employment increased by 11,700 persons to 11,984,300 persons in January 2017, reflecting an increase in both full-time (6,500) and part-time (5,100) employment. Total employment growth over the year was 0.8 per cent, which was less than half the average growth rate over the past 20 years (1.8%).

“We are still seeing strong growth in part-time employment in January 2017, and in recent months, increasing growth in full-time employment. There are now around 129,800 more people working part-time than there were a year ago, and around 40,100 fewer people working full-time,” said the General Manager of ABS’ Macroeconomic Statistics Division, Bruce Hockman.

The trend monthly hours worked increased by 3.6 million hours (0.2 per cent), with increases in total hours worked by both full-time workers and part-time workers.

Trend series smooth the more volatile seasonally adjusted estimates and provide the best measure of the underlying behaviour of the labour market.

The seasonally adjusted number of persons employed increased by 13,500 in January 2017. The seasonally adjusted unemployment rate decreased by 0.1 percentage points to 5.7 per cent, and the seasonally adjusted labour force participation rate decreased by 0.1 percentage points to 64.6 per cent.

Lending Still Running Ahead Of Inflation

The latest release from the ABS provides lending flow data to December 2016. It reconfirms the growth in investment property loans at 36% of commercial lending (especially in Sydney which is at a 5 month peak), but also reveals more momentum in lending for other commercial proposes, (potentially a good thing if for productive business purposes) and a Christmas led growth in personal debt. Total trend borrowing grew 1.52%  or $1.9 billion in the month (which would be a 12 month rate of 18.3%), way ahead of the current inflation rate of an annual (yes annual) rate of 1.5%! Total debt flows rose to $73 billion in the month. Australia is borrowing its way to obviation.

Looking in more detail at the trend data (which smooths out the monthly noise), owner occupied loans rose just 0.2% to $20 billion, lending for property alterations fell 0.6%, and personal finance rose 0.69% to $6.9 billion (fixed loans were up 0.52% to $4.4 billion and revolving loans/credit cards rose 0.97% to $2.5 billion.

Investment housing loans rose 1.68% to 13.2 billion, (equivalent to an annual rate of 20.2%) other commercial fixed lending rose 2.86% to $23 billion and revolving commercial loans rose 1.62% to $8.7 billion.

Recent regulator moves are likely to slows investment housing lending in the next few months, but households are burdened with massive debts, which will start to bite should interest rates rise.

Meantime bank shareholders will be “laughing all the way TO the bank” thanks to higher loan volumes and improved margins following recent out of cycle rate rises.

Home Lending Roared Away In December

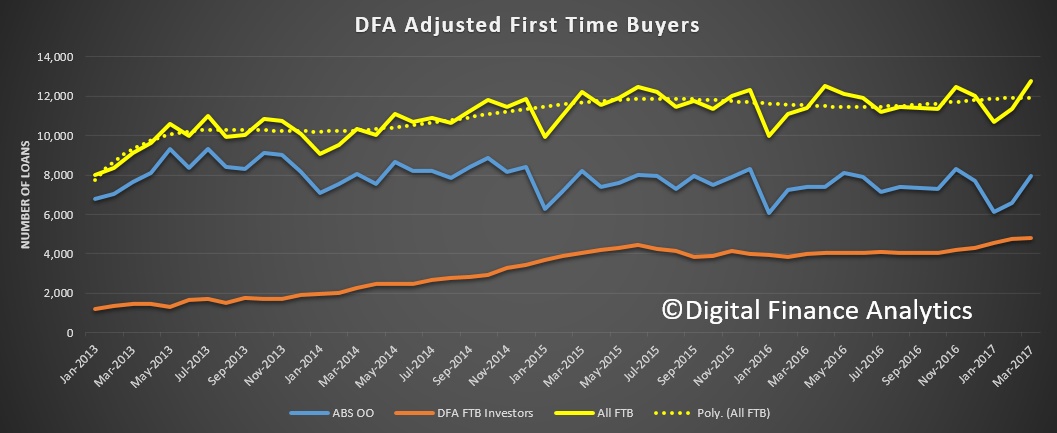
The ABS data on home finance for December 2016 confirms what we already knew, lending momentum was strong. But now we see that the number of OO first time buyers were down, whilst investment lending was strongly up.

Overall lending flows were up 0.8% in trend terms to $33.2 billion, with owner occupied loans up 0.23% ($20 billion) and investment loans up 1.68% ($13.2 billion). As a result, investment loans were 39.79% of all loans written in the month! Much of this went to the NSW market, where demand is hot, and prices are up.

Within the owner occupied data, refinancing of existing loans fell, down 1.23% to $6.38 billion, whilst other OO lending grew 0.93% to $13.6 billion. The largest percentage swing was borrowing for new dwellings, up 1.49%.

Given rates are now on the rise, we expect refinance volumes to continue to slide.

Looking at the original first time buyer data, there was 7% fall in the number of first time buyer OO loans written, down to 7,690; whilst investment loans by first time purchasers (not captured by the ABS as a separate category) is estimated to be up 1.4% to 4,236 based on the DFA household survey data. Many purchasers are going straight to the investment sector.  The average loan was $319,000 for FTB and $384,000 for other borrowers.

Finally, the original stock data shows overall loan growth on ADI’s books rose 0.67 (which if repeated for a year would equate to 8%!), way above inflation, so no wonder household debt is still building. The investment loan book grew 0.63% or $3.4 billion, whilst the OO book grew 0.7% or $7.0 billion. The total ADI book was worth 1.56 trillion and investment loans made up 34.91% of the book in December.

Trend Retail Turnover Up Just A Bit In December

Australian retail turnover rose 0.3 per cent in December 2016 following a 0.3 per cent rise in November 2016. Compared to December 2015, the trend estimate rose 3.2 per cent, according to the latest Australian Bureau of Statistics (ABS) Retail Trade figures.  We would have expected a higher number, given the Christmas rush, but perhaps households waited until the January sales.


In Seasonal adjusted terms, turnover fell 0.1 per cent in December 2016, seasonally adjusted, this follows a rise of 0.1 per cent in November 2016.

In seasonally adjusted terms, there were falls in household goods retailing (-2.3 per cent), and other retailing (-0.2 per cent). These falls were offset by rises in food retailing (0.5 per cent), clothing, footwear and personal accessory retailing (1.4 per cent), cafes, restaurants and takeaway food services (0.2 per cent), and department stores (0.3 per cent).

The fall in household goods retailing is the result of a fall in the Hardware, building and garden supplies retailing industry subgroup, which fell 6.6 per cent in December after rises in each of the previous four months.

In seasonally adjusted terms, there were falls in Victoria (-0.4 per cent), New South Wales (-0.3 per cent), and the Australian Capital Territory (-0.7 per cent). There were rises in South Australia (1.2 per cent), Western Australia (0.6 per cent), the Northern Territory (1.1 per cent) and Tasmania (0.5 per cent). Queensland was relatively unchanged (0.0 per cent).

Online retail turnover contributed 3.8 per cent to total retail turnover in original terms.

In seasonally adjusted volume terms, turnover rose 0.9 per cent in the December quarter 2016, following a relatively unchanged result (0.0 per cent) in the September quarter 2016. The main contributors to this rise were household goods retailing (2.5 per cent), clothing, footwear and personal accessory retailing (1.5 per cent) and food retailing (0.3 per cent).

Trade Surprises On The Upside

The ABS released the latest International Trade in Goods and Services data today, and in trend terms, reported a surplus of $2,193m in December 2016, an increase of $916m (72%) on the surplus in November 2016. This was a bigger number than expected, although we cannot tell if this is a function of larger export volumes (at low prices) or volumes supported by rising prices. The latter would be better news than the former. Are we just peddling harder to earn more, of benefiting from price movements?

In seasonally adjusted terms, the balance on goods and services was a surplus of $3,511m in December 2016, an increase of $1,471m (72%) on the surplus in November 2016.

In seasonally adjusted terms, goods and services credits rose $1,679m (5%) to $32,630m. Non-rural goods rose $1,249m (6%), non-monetary gold rose $319m (23%), rural goods rose $104m (3%) and net exports of goods under merchanting rose $1m (20%). Services credits rose $6m. Goods and services debits rose $209m (1%) to $29,120m. Consumption goods rose $157m (2%), intermediate and other merchandise goods rose $132m (2%) and non-monetary gold rose $4m (1%). Capital goods fell $125m (2%). Services debits rose $42m (1%).

Overall, in 2016 and in original terms the balance on goods and services for 2016 was a deficit of $13.6b, a decrease of $23.4b (63%) on the deficit of $37.0b recorded in 2015, resulting from a $13.3b (4%) increase in goods and servicescredits and a $10.1b (3%) decrease in goods and services debits.

CPI Lower Than Expected To December 2016

The Consumer Price Index (CPI) rose 0.5 per cent in the December quarter 2016, according to the latest Australian Bureau of Statistics (ABS) figures.

This follows a rise of 0.7 per cent in the September quarter 2016. The CPI rose 1.5 per cent through the year to December quarter 2016.

This was below expectation, but is probably not sufficiently low to prompt the RBA to cut the cash rate further, given recent comments from the Governor, and rising trends in other countries, following the US election.

The most significant price rises this quarter are tobacco (+7.4 per cent), automotive fuel (+6.7 per cent) and restaurant meals (+1.1 per cent). These rises are partially offset by falls in furnishings, household equipment and services (-0.8 per cent) and communication (-0.8 per cent).

Vegetables rose 2.5 per cent in the December quarter 2016. Adverse weather conditions in major growing areas over previous periods continue to impact supply for particular vegetables (potatoes, capsicums, broccoli and cauliflower). Offsetting these rises are price falls for salad vegetables, tomatoes, lettuce and celery.

Vegetable prices have risen 12.5 per cent through the year to December quarter 2016.

CPI fell in Darwin, and was highest in Hobart in the quarter.

Property investors could force RBA’s hand

From InvestorDaily.

A resurgence in residential property investor lending could see the Reserve Bank lift the cash rate earlier than expected, according to a market analyst.

The latest ABS figures show that the value of investor housing finance increased by 4.9 per cent over November.

Investor lending is now up 21 per cent year-on-year, which is the fastest growth rate since the first half of 2015, which saw the implementation of APRA’s macroprudential regulations.

“I have a feeling that this is probably a bit of a wake-up call for the RBA,” Digital Finance Analytics (DFA) principal Martin North said.

“I think they will lift rates sooner rather than later because I think it has gotten out of hand. All indicators suggest that rates will rise.”

Mr North added that there are considerable proportions of households that are exposed to even small rate rises.

“Some of these are the more affluent households. They have such large mortgages and flat income growth,” he said. “The market could be up for a bit of a transformation in 2017.”

HSBC Australia chief economist Paul Bloxham believes most of the revival in investor activity is being driven in Sydney and Melbourne, where house prices posted strong gains in 2016.

“It has a number of implications, the first of which is, this is likely to make the RBA somewhat uncomfortable. This firms up our already held view that the RBA is unlikely to cut interest rates any further,” said Mr Bloxham.

“Our central case is that the RBA is on hold through 2017 and that they start to lift interest rates in 2018.”

Credit Grew In November 2016 Thanks to Commercial Flows

The latest trend finance data from the ABS shows that total lending flows were up in November 2016. Overall $72 billion of credit was written, up 2.3% from the previous month, thanks to momentum in the commercial sector.

Within that, secured lending for residential construction and purchase was $19.8 billion, down slightly from October, whilst finance for alterations and additions rose 0.13%. Personal finance grew just a little, at 0.07%.

Looking at total fixed business lending, this grew $1.4 billion, up 3.74% to $45 billion, comprising  a rise of $1.2 billion, or 5.26% to $23.2 billion for commercial lending other than housing investment, and $0.2bn for investment housing, up 1.6%, to $12.9 billion.

Revolving business credit flows grew 2.95% to $8.9 billion, and leasing rose 0.19% to 0.5 billion.

So we see a rise in investment housing lending to 39.5% of all housing lending flows, driven by strong growth in NSW mainly, and a slowing in owner occupied lending. We also see an overall rise in business lending, even after isolating investment lending. We need to see ongoing growth in non-housing related business investment if economic momentum is to be sustained.

December Trend Employment Data Steady

Monthly trend full-time employment increased by 7,000 in Australia in December 2016, according to figures released by the Australian Bureau of Statistics (ABS) today. Whilst employment growth remains sluggish, this was the third consecutive month of increasing full-time employment.

But the rotation to part-time work continues, the seasonally adjusted unemployment rate rose to 5.8% and the seasonally adjusted participation rate rose to 64.7%.

Total trend employment increased by 8,200 persons to 11,966,800 persons in December 2016, reflecting an increase in both full-time (7,000) and part-time (1,100) employment. However, year-on-year employment growth was 0.7 per cent, which was less than half the average growth, of 1.8 per cent, from the past 20 years.

“Over the past year we have seen a shift towards part-time employment, particularly in the first half of 2016. There are now around 120,900 more people working part-time than there were a year ago, and around 35,300 fewer people working full-time. Since December 2015, the share of part-time employment increased from 31.1 per cent to 31.9 per cent,” said the General Manager of the ABS’ Macroeconomic Statistics Division, Bruce Hockman.

The trend unemployment rate was 5.7 per cent for the ninth consecutive month.

The trend participation rate was unchanged at 64.6 per cent.

The trend monthly hours worked increased by 2.3 million hours (0.1 per cent), with increases in total hours worked by both full-time workers and part-time workers.

Trend series smooth the more volatile seasonally adjusted estimates and provide the best measure of the underlying behaviour of the labour market.

The seasonally adjusted number of persons employed increased by 13,500 in December 2016. The seasonally adjusted unemployment rate increased by 0.1 percentage points to 5.8 per cent, and the seasonally adjusted labour force participation rate increased by 0.1 percentage points to 64.7 per cent.