New Home Starts continue to Ease from Peak

ABS data on building activity indicate that new dwelling starts have passed their record peak, said the Housing Industry Association (HIA).

During the September 2016 quarter, only New South Wales (+5.4 per cent) and Queensland (+6.3 per cent) saw increases in new dwelling commencements. The largest decline was in the ACT (-39.6 per cent) followed by South Australia (-20.0 per cent). There were also large reductions in Western Australia (-13.6 per cent) and Victoria (-9.6 per cent). Falls in new dwelling starts also occurred in the Northern Territory (-7.6 per cent) and Tasmania (-0.6 per cent) during the September 2016 quarter.

“New dwelling starts hit all-time record levels during 2016, but today’s data provides further evidence that we’ve left the peak behind,” commented HIA Senior Economist, Shane Garrett.

During the September 2016 quarter, new dwelling commencements fell by 2.8 per cent in seasonally-adjusted terms to 55,070. Detached house starts were down by 1.8 per cent compared with the previous quarter, while multi-unit commencements dipped by 3.9 per cent. Over the year to September 2016, new dwelling commencements totalled some 229,336.

“The result for the September 2016 quarter represents the second consecutively quarterly decline in new dwelling starts, with a substantial portion of the reduction happening on the multi-unit side,” explained Shane Garrett.

“In contrast, detached house starts have been holding up quite well. The upturn in new home building between 2012 and 2016 was heavily influenced by increased apartment building with output more than doubling,” Shane Garrett pointed out.

“With new home building set to move lower over the next few years, we expect that the higher density market will have to absorb the bulk of the reduction. From a peak of over 230,000 starts during 2015/16, we anticipate that new home starts will continue to ease over the next couple of years and bottom out at around 172,000 during the 2018/19 financial year,” Shane Garrett concluded.

Home Lending On The Rise

The latest housing finance data from the ABS underscores the renewed momentum in home mortgage lending, especially in the investment sector, and there was also a rise in first time buyers accessing the market.

  • The trend estimate for the total value of dwelling finance commitments excluding alterations and additions rose 0.6%. Investment housing commitments rose 1.7%, while owner occupied housing commitments was flat.  In seasonally adjusted terms, the total value of dwelling finance commitments excluding alterations and additions rose 2.2%.
  • In trend terms, the number of commitments for owner occupied housing finance fell 0.1% in November 2016 whilst the number of commitments for the purchase of new dwellings rose 0.7%, the number of commitments for the construction of dwellings rose 0.2%, and the number of commitments for the purchase of established dwellings fell 0.2%.
  • In original terms, the number of first home buyer commitments rose by 13.4% to 8,281 in November from 7,302 in October; the number of non-first home buyer commitments also rose. The number of first home buyers as a percentage of total owner occupier commitments rose from 13.7% to 13.8%.

Total commitments in trend terms was $32.7 billion, of which $19.8 billion was owner occupied loans, and $12.9 billion for investment purposes. 39.5% of new lending was for investment purposes, and we see the proportion of investment loans continuing to rise, it is already too high.

Looking at the month on month movements, the seasonally adjusted changes highlight the rise in the investment funding for new construction, with a 40% rise on last month. Owner occupied refinancing fell.

The more reliable trend analysis shows the monthly movements, with a strong surge in investment loans by individuals, and a stronger fall in owner occupied refinancing.

Looking at total loan stock (in  original terms) around 35% of all loans outstanding are for investment purposes, and the slide we saw late 2015 appears to be easing.

Turning to the first time buyer, original data, the number of first time owner occupied buyers rose compared with last month, and the overall mix also increased.

Combining the first time buyer property investor data from our surveys, we see a spike in overall first time buyer activity.

Last month, around 1,100 more first time buyers entered the owner occupied market than the prior month (12%), and around 150 more in the investment sector.  We also saw a rise in the fixed rate loans, as borrowers try to lock in lower rates ahead of expected rises.

So overall, still strong momentum in the housing sector, and powered largely by an overheated investment sector.


We need to find new ways to measure the Australian labour force

From The Conversation.

Over the last few years, we’ve seen a massive shift in the way we work. Thousands of Australians have abandoned the traditional 40-hour work week to work fewer hours or take on ad-hoc work, such as driving for Uber or doing odd jobs on Airtasker.

But the way we measure the labour market has not kept up. We still rely on the Australian Bureau of Statistics’ labour force survey, a survey from the 1960s conducted according to international conventions that is no longer appropriate for today’s labour market.

Today’s economy – one of independent contractors, ad-hoc work, irregular and flexible hours – needs a new form of measurement.

How the government measures the workforce

Every month the Australian Bureau of Statistics (ABS) surveys about 0.32% of the civilian population aged over 15 years about their employment status.

In short, you’re counted as employed if you completed at least one hour of paid work in the week before the survey.

But this doesn’t sound quite right. Clearly, one hour of paid work per week doesn’t fit most people’s idea of employment.

In fact, over one million workers are counted as “underemployed”, meaning they would work more hours if they could. This raises the question of whether these people should really be considered “employed”. The answer depends on what policy question you are trying to address.

Is our unemployment rate right?

Let’s get right into how our unemployment rate is calculated.

If respondents haven’t done any paid work in the last week, they are asked two further questions – first, have they actively sought work in the last four weeks, and second, are they currently available to start work? They are only considered unemployed if they answer yes to both of these questions. Otherwise, they’re not counted as part of the labour force.

This means full-time homemakers, carers, the ill and non-working retirees aren’t considered unemployed.

The labour force is the sum of the employed and the unemployed. The unemployment rate is the percentage of the labour force who are unemployed.

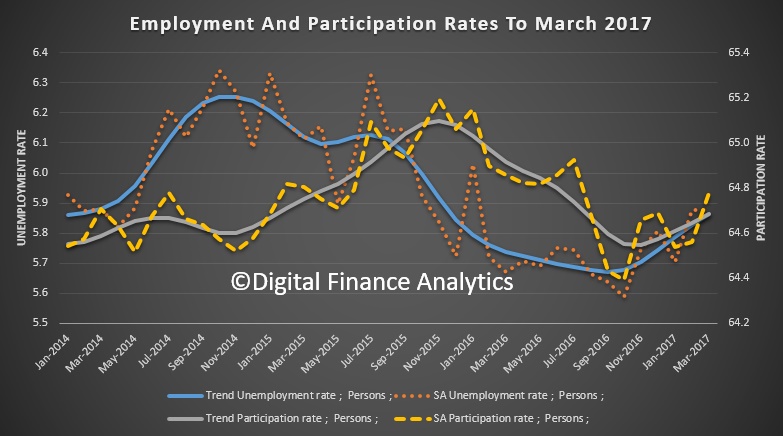
Lastly, the participation rate is the percentage of the population aged 15 and older who are in the labour force. According to the latest ABS trend estimates, the participation rate stood at 64.5% in November, no change from October.

The participation rate has been consistently trending upwards over time for women and falling for men. This does not mean women are increasingly doing more work but that over time they have switched from unpaid to paid work. One of the main reasons for falling participation among men is that unskilled manual jobs for older men have been declining over several decades and many men have been reclassified as unemployed, disabled or retired.

More issues with the survey

The Labour Force Survey only provides a measure of employment and not the number of jobs. For example, a person might work 20 hours per week at a supermarket and 10 hours per week as an Uber driver. Employment is always classified according to the “main job”, so the ABS deems them as one person employed part-time (working fewer than 35 hours) in the retail industry.

If that person worked five more hours as an Uber driver the next week, they would be classified as full-time (35 hours) but the supermarket job would still determine the industry in which they are employed.

The crucial problem here is that there are two jobs being done, but the ABS employment estimate only counts one. So be wary of commentators and politicians making statements like “the economy gained/lost 10,000 jobs last month”! What jobs are they measuring?

The labour force survey also fails to make distinctions between different types of workers. About two million Australians work as independent contractors like construction workers or other business operators such as hairdressers working from home. However, in the figures they are not distinguished from regular employees.

Whereas it might be relatively easy for an employee to know if they did any paid work in the week before the survey, it might not be so obvious for a non-employee. For instance, an author might work 50 hours on their book one week and three hours the next. Most of their work is basic research rather than writing. They receive a royalty payment twice a year. How would they answer the question of whether they did any paid work in the last week?

For non-employees the question of whether they are prepared to start work and have been actively looking for work can also be complex. Someone doing consultancy work might not actively look for work because clients seek them out instead.

We need something new

The ABS has tried tackling some of these issues by conducting some different surveys, including the Characteristics of Employment Survey which presents information on all employed persons according to their status of employment. However, the framework classifies jobholders by their main job. That is, only the job in which they usually worked the most hours. This doesn’t capture many of the issues of concern in, say, the “sharing” or “gig” economy

The ABS has also attempted to compare the number of filled jobs to the amount of employed people, using estimates in the labour force survey. This can reveal interesting information about the labour market. For instance, in February 2013 there were 11,628,300 employed people in Australia, but an estimated 12,287,200 filled jobs. That is, there were 658,900 more filled jobs than there were employed people.

But even then, the estimates still use the conventional definition of a job.

The ABS is still working on an Australian Labour Market Account, based on International Labor Organisation (ILO) methodology, which may address some of the issues discussed here. But this will still be based on traditional definitions of jobs, employment, and unemployment.

Our conventional employment measures are no longer equipped to inform us about important aspects of our labour force and a reliance on them could lead to inappropriate policy. We need labour force numbers than can capture the nuances of a modern economy.

Retail Turnover Higher in November

The trend estimate for Australian retail turnover rose 0.4 per cent in November 2016 following a 0.4 per cent rise in October 2016, according to the latest Australian Bureau of Statistics (ABS) Retail Trade figures.

Compared to November 2015 the trend estimate rose 3.4 per cent.

Online retail turnover contributed 4.1 per cent to total retail turnover in original terms.

In (the less reliable) seasonally adjusted terms, retail turnover rose 0.2 per cent in November, following a rise of 0.5 per cent in October 2016.

In seasonally adjusted terms, there were rises in food retailing (0.4 per cent), clothing, footwear and personal accessory retailing (1.7 per cent) and household goods retailing (0.2 per cent). There were falls in cafes, restaurants and takeaway food services (-0.8 per cent), department stores (-0.3 per cent) and other retailing (-0.1 per cent).

In seasonally adjusted terms, there were rises in New South Wales (0.5 per cent), Victoria (0.4 per cent), Queensland (0.1 per cent), Tasmania (0.1 per cent) and the Northern Territory (0.3 per cent). There were falls in Western Australia (-0.6 per cent), South Australia (-0.4 per cent) and the Australian Capital Territory (-0.1 per cent).


Building Approvals In November

The number of dwellings approved fell 2.9 per cent in November 2016, in trend terms, and has fallen for six months, according to data released by the Australian Bureau of Statistics (ABS) today. This is our preferred measure as it irons out some of the monthly data bumps.


In November dwelling approvals decreased, in trend terms, in the Northern Territory (5.0 per cent), New South Wales (4.3 per cent), Queensland (3.9 per cent), the Australian Capital Territory (3.4 per cent), Victoria (2.5 per cent) and South Australia (1.1 per cent). Dwelling approvals increased, in trend terms, in Western Australia (1.9 per cent) and were flat in Tasmania.

In trend terms, approvals for private sector houses fell 0.4 per cent in November. Private sector house approvals fell in New South Wales (1.0 per cent), Victoria (0.6 per cent) and South Australia (0.4 per cent), but rose in Queensland (0.3 per cent) and Western Australia (0.3 per cent).

In seasonally adjusted terms, dwelling approvals increased by 7.0 per cent in November, driven by a rise in total dwellings excluding houses (17.3 per cent). Total house approvals fell 0.4 per cent.

The value of total building approved fell 2.6 per cent in November, in trend terms, and has fallen for four months. The value of residential building fell 2.8 per cent while non-residential building fell 2.3 per cent.

However, the Housing Industry Association focused on the seasonally adjusted series saying that the volume of approvals for new dwellings bounced back strongly during the month of November, particularly on the multi-unit side.

“November was a particularly good month on the multi-unit side of the market with approvals increasing by 17.3 per cent during the month following a big fall in October. However, we anticipate that new dwelling starts will decline over the next 12 months, with this likely to be felt on the ground towards the end of this year”.


Trend Unemployment Steady In November

Monthly trend full-time employment was largely unchanged in Australia in November 2016, according to figures released by the Australian Bureau of Statistics (ABS) today.

Total trend employment increased by 3,100 persons to 11,949,300 persons in November 2016, reflecting an increase in part-time employment of 3,200 persons and a small decrease of 100 persons working full-time.

“Over the past year we have seen a shift towards part-time employment, particularly in the first half of 2016. There are now around 138,300 more people working part-time than there were a year ago, and around 51,000 fewer people working full-time,” said the General Manager of ABS’ Macroeconomic Statistics Division, Bruce Hockman.

The trend unemployment rate remained steady at 5.6 per cent for the second consecutive month, having fallen over the past two years from 6.2 per cent in November 2014.

The trend participation rate was unchanged at 64.5 per cent.

The trend monthly hours worked increased by 0.8 million hours (0.1 per cent), with decreases in total hours worked by full-time workers and an increase in hours worked by part-time workers.

The quarterly trend underemployment rate remained at 8.5 per cent for a third successive quarter. “The underemployment rate is still at a historically high level for Australia, but has been relatively unchanged over the past two years,” said Mr Hockman.

Trend series smooth the more volatile seasonally adjusted estimates and provide the best measure of the underlying behaviour of the labour market.

The seasonally adjusted number of persons employed increased by 39,100 in November 2016. The seasonally adjusted unemployment rate increased by 0.1 percentage points to 5.7 per cent, and the seasonally adjusted labour force participation rate increased by 0.2 percentage points to 64.6 per cent.

Participation improved this time.

The state level data shows that unemployment is highest in SA, WA and TAS, and lowest in NT and ACT.

Mix Bag Of Property Price Growth

The ABS released their property price data to September 2016.  It shows averaging across the states is meaningless. Prices fell hard in Darwin and Perth, but rose strongly in Sydney and Tasmania in the last quarter.  The total value of residential dwellings in Australia was $6.15 trillion.

The price index for residential properties for the weighted average of the eight capital cities rose 1.5% in the September quarter 2016. The index rose 3.5% through the year to the September quarter 2016.

The capital city residential property price indexes rose in Sydney (+2.6%), Melbourne (+1.7%), Adelaide (+0.9%), Brisbane (+0.2%), Canberra (+0.8%) and Hobart (+2.3%) and fell in Perth (-1.6%) and Darwin (-1.2%).

Annually, residential property prices rose in Melbourne (+6.9%), Hobart (+6.8%), Canberra (+5.5%), Sydney (+3.2%), Adelaide (+3.2%) and Brisbane (+3.1%), and fell in Darwin (-7.2%) and Perth (-4.0%).

The total value of residential dwellings in Australia was $6,155,225.1m at the end of the September quarter 2016, rising $112,142.3m over the quarter.

The mean price of residential dwellings rose $9,000 to $631,000 and the number of residential dwellings rose by 39,300 to 9,755,400 in the September quarter 2016.

Is Business Lending Momentum On The Turn?

The latest data from the ABS, Lending Finance for October 2016, shows total credit flows in October were $68.1 billion, up 0.72% compared with last month, in the more reliable trend terms. Within that, the total value of owner occupied housing commitments excluding alterations and additions fell 0.5% in trend terms, to $19.7 billion. Alterations and additions, fell 0.5%.

The trend series for the value of total personal finance commitments fell 1.2%. Revolving credit commitments fell 3.5%, while fixed lending commitments rose 0.1%. Total personal finance flows fell to $6.6 billion.

The trend series for the value of total commercial finance commitments rose 1.7% to $40.9 billion. Fixed lending commitments rose 2.0% to $32.8 billion and revolving credit commitments rose 0.4% to $8.1 billion

The trend series for the value of total lease finance commitments rose 0.1% in October 2016 and the seasonally adjusted series fell 11.8%, after a rise of 10.1% in September 2016.

What is possibly significant is that within the fixed business lending category, we have a combination of lending for investment property and lending for other business purposes. We are beginning to see a rise in other business lending, alongside lending for investment property. We need to see more of the former, and less of the latter.

Lending for investment property rose 1.5% to $12.5 billion, whilst lending for other business purposes rose 2.3% to $20.3 billion. As a result, the share of lending for business (other than for investment property) rose, whilst the share of commercial lending for investment property fell from 38.2% to 38%.

Looking at the investment property data, investors were hot to trot in Sydney, and Melbourne. Much of the investment property remains in these two centres.

Investment Loans Stronger In October

The latest housing finance statistics from the ABS, to October 2016 shows continued growth in investment mortgage lending, whilst owner occupied momentum slowed. In the month and in trend terms, $32 billion on new loans were written, up 0.25%. Within that, owner occupied flow fell 0.5% to $19.7 billion, whilst investment loans grew 1.5%, to $12.5 billion. Investment lending comprised 33.8% of all loans, up from 33.3% the previous month.

33.8% of owner occupied loans were a refinance of existing loans. 12.8% of loans were fixed rate, up from 11.2% last month – reflecting the low rate fixed offers which were available at the time.

Looking at the segmentals, owner occupied lending for construction rose 0.06% to $1.8 billion, purchase of new dwellings fell 0.17% to $1 billion, refinance of established dwellings fell 0.74% to $6.6 billion and purchase of established dwellings fell 0.5% to $10.2 billion.

On the investment side of the ledger, construction of new investment dwellings fell 0.46% to $842 million, purchase of property for investment by individuals rose 2.11% to $10.6 billion and purchase by other investors rose 0.45% to $1 billion.

Looking at ADI loan stock, in original terms, total loans grew by 0.61% in the month, up $9 billion. Investment loans rose 0.5% or $2.7 billion and owner occupied stock rose 0.67% or $6.7 billion.

Turning to first time buyers,the volume of new owner occupied loans to first time buyers remained around 7,300, but because the number of non-first time buyers fell, it rose to 13.7% of all loans, up from 13.1%. The average loan size for first time buyers rose to $327,000, up 1% from last month, whilst the average non-first time buyer loan is $380,000, up 1.6%.

Looking at the DFA survey data we saw a slight fall in the number of first time buyers going directly to the investment sector, but another 4,000 joined the property investor ranks in the month.

Finally, looking at the state-based data in trend terms, the largest falls in owner occupied loans were in NSW (down 1.2%) and ACT (down 2.1%). Tasmania was the only state to see a rise – up 0.7%.


Trade Gap Wider Than Expected In October

The ABS released their International Trade in Goods and Services to October 2016. The gap was bigger than expected, as exports rose slower than imports, and the value of exports was lower than some anticipated, given recent commodity price movements.

This is the first increase in the deficit since June this year, and was higher than the $800 million expected by economists.

Within this, the value of exports rose by 1% to $27.6 billion and imports jumped by 2% to $29.2 billion.

In trend terms, the balance on goods and services was a deficit of $1,565m in October 2016, a decrease of $154m (9%) on the deficit in September 2016.

In seasonally adjusted terms, the balance on goods and services was a deficit of $1,541m in October 2016, an increase of $269m (21%) on the deficit in September 2016.

In seasonally adjusted terms, goods and services credits rose $389m (1%) to $27,631m. Non-rural goods rose $223m (1%) and non-monetary gold rose $198m (13%). Rural goods fell $150m (4%) and net exports of goods under merchanting fell $3m (6%). Services credits rose $121m (2%).

In seasonally adjusted terms, goods and services debits rose $658m (2%) to $29,172m. Capital goods rose $490m (10%), consumption goods rose $100m (1%) and intermediate and other merchandise goods rose $97m (1%). Non-monetary gold fell $162m (26%). Services debits rose $135m (2%).