Australia is experiencing its fastest growth in Net Overseas Migration (NOM) in four years, according to the latest figures released by the Australian Bureau of Statistics (ABS).
These new arrivals need somewhere to live, another factor in the elevated demand for property!
ABS Demography Director Beidar Cho said that in the year ending 30 September 2016, NOM increased by almost 9 per cent, adding 193,200 people to the Australian population.
“This is in contrast to the declines of NOM of over 10 per cent experienced during 2014 and early 2015,” said Ms Cho. “But the current growth of NOM is well short of the record during 2009, when over 300,000 people were added to the population.”
Compared with last year, Queensland had the fastest growing NOM, increasing by 19 per cent. New South Wales and Victoria remain popular destinations for migrants, growing by 11 per cent and 13 per cent respectively. Tasmania was the only other state or territory to see an increase of NOM compared to last year, increasing by 9 per cent.
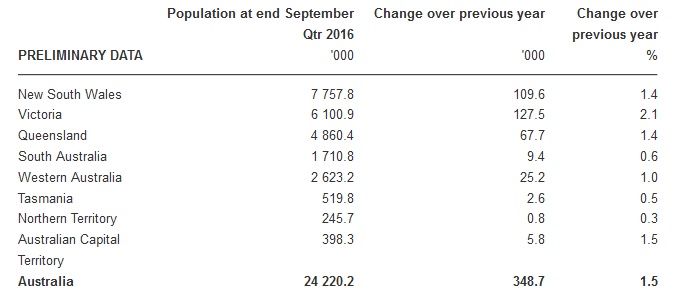
Overall, Australia’s population grew by 348,700 people to reach 24.2 million by the end of September 2016.
Net overseas migration added 193,200 people to the population, and accounted for 55 per cent of Australia’s total population growth.
Natural increase contributed 155,500 additional people to Australia’s population, made up of 315,000 births and 159,500 deaths.
Over the year, net overseas migration was the major contributor to population change in New South Wales, Victoria and South Australia, whilst natural increase was the major contributor in all other states and territories.