Investment Home Lending Up Again

The latest data from the ABS showing housing lending to September 2016 should make the RBA reconsider its stance on housing. This is because, whilst lending for owner occupation fell slightly, property investors were strongly active again. As a result more than 38% of all new loans in September were for investment purposes. This is too high, and will continue to drive debt and home prices ever higher.

As normal we look at the trend series, which irons out monthly variations. Overall new loans worth $32bn were written, up 0.19% on the previous month. However, of that $12.2bn were for investment housing purposes, up 1.32%, whilst loans for the purchase of owner occupied established dwellings were $10.3bn, down 0.77%. Owner occupied refinance was down 0.46%, to 8bn but comprising 21% of all transactions and 34% of all owner occupied transactions. Loans for new dwellings and construction were $2.8bn, up 0.4%.

housing-sept-2016-all-flowWe also saw the mix between banks and non banks continue to shift, with the non-bank lenders higher.

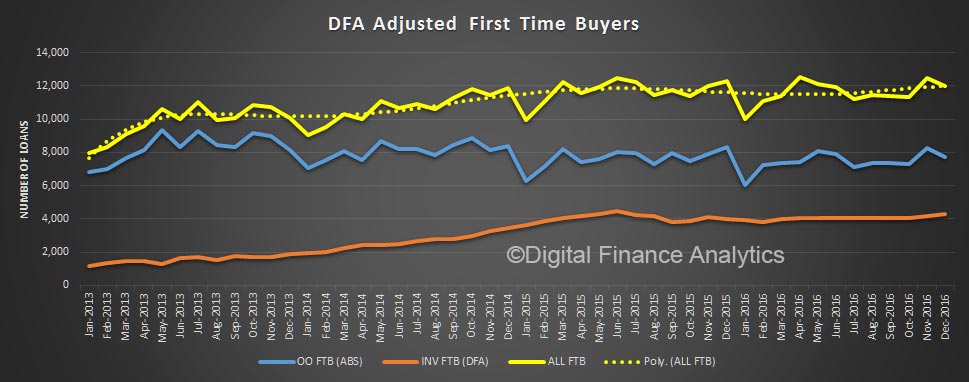
housing-sept-2016-bank-v-non-bank-trendLooking at first time buyers, we see that the number of first time buyers fell again 0.5%, to 7,334 (original), which is 13.1% of all owner occupied loans. The average first time buyer loan was $324k, up 1.9%. The data also shows the proportion of fixed loan fell to 11.2%.

housing-sept-2016-ftbThe DFA household survey identified an additional 4,000 first time buyers who whet direct to the investment sector – these are not caught in the ABS first time buyer stats.

housing-sept-2016-ftb-trackerAll this explains the high auction clearance rates, and short listing times current observed, especially in the eastern states.

Trend Retail Sales Moderate In September

The trend estimate for Australian retail turnover rose 0.2 per cent in September 2016 following a 0.3 per cent rise in August 2016. Compared to September 2015 the trend estimate rose 2.8 per cent, according to the latest Australian Bureau of Statistics (ABS) Retail Trade figures.

In trend terms,  there were rises in household goods retailing (0.2 per cent), cafes, restaurants and takeaway food services (0.9 per cent), clothing, footwear and personal accessory retailing (0.2 per cent) and food retailing (0.2 per cent). Department stores fell (-0.3 per cent). Other retailing was static (-0.0 per cent) in September 2016.

retail-sep16In trend terms, there were rises in Queensland (0.6 per cent), Australian Capital Territory (0.4 per cent), South Australia (0.3 per cent), New South Wales (0.2 per cent), Victoria (0.2 per cent) and Tasmania (0.1 per cent). Western Australia fell (0.1 per cent) and the Northern Territory fell (0.1 per cent).

retail-sep16-statesOnline retail turnover contributed 3.5 per cent to total retail turnover in original terms.

In seasonally adjusted volume terms, turnover fell 0.1 per cent in the September quarter 2016, following a rise of 0.3 per cent in the June quarter 2016. The main contributors to this fall were food retailing (-0.7 per cent) and department stores (-3.6 per cent).

Building Approvals Fall Again

The momentum of building approvals continued to ease in September especially in Sydney and Melbourne, indicating the massive construction bulge in residential building – especially apartments –  may be shrinking.

The latest data from the ABS show that building approvals to end September 2016 fell again. The trend estimate for total dwellings approved fell 0.6% in September and has fallen for four months. The seasonally adjusted estimate for total dwellings approved fell 8.7% in September and has fallen for two months.

Moreover, in seasonally adjusted terms, whilst private house approvals rose by 2.3% to 9,605, dwellings excluding houses, i.e. apartments, crashed by 16.3% to 9,166. Unit counts have been very volatile. In trend terms we are still building more units than houses nationally.

building-approvals-sept-2016Looking at the approvals (in original terms) across the main urban centres, in Greater Sydney approvals fell 16%, in Great Melbourne they were down 21%, in Great Brisbane they rose 12%, in Adelaide they were up 9%, whilst they fell in Perth.

building-approvals-sept-2016-stateThe trend estimate of the value of total building approved rose 2.1% in September and has risen for 10 months. The value of residential building fell 0.1% and has fallen for two months. The value of non-residential building rose 6.0% and has risen for eight months.

The seasonally adjusted estimate of the value of total building approved rose 29.9% in September following a fall of 7.7% in the previous month. The value of residential building fell 4.4% after rising for two months. The value of non-residential building rose 118.9% after falling for two months.

The CPI rose 0.7 per cent in the September quarter 2016

The Consumer Price Index (CPI) rose 1.3 per cent through the year to September quarter 2016, according to the latest Australian Bureau of Statistics (ABS) figures. This is a rise from 1% last time, and higher than expected. However much of the rise is a reaction to recent bad wealth with the prices of fruit and vegetables higher. This is a temporary effect.

Nevertheless, the RBA trimmed mean remains at 1.7%, and probably means no rate cut in the near future.

The CPI rose 0.7 per cent in the September quarter 2016. This follows a rise of 0.4 per cent in the June quarter 2016. This quantum is towards the higher end of expectations.

cpi-sept-2016-trend-statesSydney had the highest movement at 1%. Housing, and furnishings helped to lift the number here, as well as rising fruit and vegetables prices.

cpi-sept-2016-last-qNationally, the most significant price rises this quarter are fruit (+19.5 per cent), vegetables (+5.9 per cent), electricity (+5.4 per cent) and tobacco (+2.3 per cent). These rises are partially offset by falls in communication (-2.3 per cent) and fuel (-2.9 per cent).

cpi-sept-2016-mixThe rise in fruit and vegetable prices is due to adverse weather conditions, including floods, in major growing areas, impacting supply.

More On The Wacky Employment Data

Earlier today the ABS released some weird data, as we discussed earlier. We said then:

…the numbers seem a bit weird, with a fall in the number of full time jobs, a rise in part time jobs, and the participation rate down just a tad. Yet the number of hours worked rose significantly. Strange. Can we trust the data? Expectations were for a rise in jobs, so the results are below expectations.

We have looked in more detail at the data. If we plot the unemployment rate against the number of people not in the labour force, we immediately see a rise in the number who left the market in the past few months, allowing the employment rate to fall.

emp-sept-2016-not-in-marketSo, clearly one of the factors playing havoc with the numbers is the rise in those who have given up looking for work. In addition, we see a rise in the monthly hours worked. But hard to see how this is possible when the number of full time jobs fell, even offset by a rise in part-time work.

hours-workedThe Business Insider picked up comments from some of the economists reacting to the data.

After trying to digest the data and make something of it, even Australia’s economic community — usually guarded about criticising one of their own — appears to have had enough, presenting a less-than-glowing assessment of the figures, some more politely that others.

Here’s a selection of the commentary that we’ve read. It really does offer a damning assessment of what is the single-most important data release in Australia each and every month.

John Peters, Commonwealth Bank

The latest data also revealed a curious result in relation to the participation rate. The participation rate (% of population employed or unemployed) has actually fallen by 0.4% over the past 2 months – one of the biggest declines on record. It sits at odds with the leading indicators of participation. Big moves are typically a sign of survey problems. The participation rate will fall if you have underestimated the level of employment. So the bottom line is to take the latest headline jobs prints with a grain of salt.

The mixed September labour force report with the huge size of some of the reported moves raises a degree of scepticism about the results. The ABS goes some way in addressing this scepticism by noting in its latest report that the new group added into the survey had a lower employment intensity than the group that rotated out. This would have biased down jobs growth. There is a problem in QLD in particular.

Stephen Walters, Australian Institute of Company Directors

Today’s employment report for September was a dog’s dinner. Total employment fell again (the second straight monthly decline), dragged down by another plunge in full-time job places. But, the jobless rate fell (after revisions) to a three-year low, although this was only because more people left the labour force. Hours worked across the entire workforce rose, but the underemployment rate fell. All up, with the main indicators all over the place in what we now know is a very volatile data set, it’s extremely difficult to draw firm conclusions from today’s release.

Paul Dales, Capital Economics

There are two reasons, though, why we can’t rely on these data. First, job growth is probably stronger than it looks as September’s data will have been dragged down by the end of the temporary contracts of those people employed by the Census in August. That may have reduced it by around 10,000.

Second, there is reason to believe that job growth is worse than September’s figure suggests. The ABS stated that it has altered the headline figure because the incoming rotation sample for Queensland was “considerably different to the rest of the Queensland sample”. Part of the survey sample changes every month, but it is unusual for the ABS to actively reduce the influence of the incoming sample. Somewhat unhelpfully, when we phoned the ABS it wouldn’t say which direction it tweaked the data! But since the state breakdown shows that employment in Queensland fell by 4,100, we’re guessing that fall was smaller than would otherwise have been the case.

Michael Turner, Royal Bank of Canada

For September’s report, the ABS warns that a new part of the survey to rotate in from Queensland was “noticeably different in its labour force characteristics to the group that it replaced”. The ABS has therefore “temporarily reduced the influence of this rotation group for September estimates”. In short, it appears the ABS is struggling to take survey responses at face value, and is almost ignoring some of them. This is obviously less than ideal, and underscores widely held concerns over the veracity of the data on a month-to-month basis.

Ivan Colhoun, National Australia Bank

Overall a weaker-than-expected report, but once again with a heightened degree of uncertainty about the exact signals of the various series given a number of very unusual – and large – monthly moves.

In spite of the veracity questions, the trends are not likely to allay the RBA’s fears about the momentum of the labour market.

Paul Bloxham, HSBC

Other labour market indicators have not shown this kind of deterioration; business and consumer confidence are holding up at solid levels and job advertisements have continued to rise. The official labour market survey has also faced difficulties with changing seasonal patterns during the past few years, which mean that the other labour market measures may be giving a better read of actual conditions.

Shift to part-time employment continues

Monthly trend employment in Australia increased slightly in September 2016, according to figures released by the Australian Bureau of Statistics (ABS) today. But the numbers seem a bit weird, with a fall in the number of full time jobs, a rise in part time jobs, and the participation rate down just a tad. Yet the number of hours worked rose significantly. Strange. Can we trust the data? Expectations were for a rise in jobs, so the results are below expectations.

employment-number

In September 2016, trend employment increased by 3,900 persons to 11,959,500 persons – a monthly growth rate of 0.03 per cent. This is down from the monthly employment growth peak of 0.28 per cent in September 2015. Trend part-time employment growth continued, with an increase of 11,800 persons, while full-time employment decreased by 7,900 persons.

”The latest Labour Force release shows further increases in part-time employment. There are now 130,000 more persons working part-time than in December 2015, while the number working full-time has decreased by 54,100 persons,” said the Program Manager of ABS’ Labour and Income Branch, Jacqui Jones.

The trend monthly hours worked increased by 2.2 million hours (0.1 per cent), though it is still below the high in December 2015.

The trend unemployment rate decreased slightly (by less than 0.1 percentage points) to 5.6 per cent, and the participation rate decreased 0.1 percentage points but remained steady at 64.7 per cent in rounded terms.

sept-2016-employment

Trend series smooth the more volatile seasonally adjusted estimates and provide the best measure of the underlying behaviour of the labour market.

The seasonally adjusted number of persons employed decreased by 9,800 in September 2016. The seasonally adjusted unemployment rate for September 2016 decreased by 0.1 percentage points to 5.6 per cent, and the seasonally adjusted labour force participation rate decreased by 0.2 percentage points to 64.5 per cent.

The ABS seems to indicate concerns with the data quality: “The incoming rotation group in Queensland for September 2016 was considerably different to the rest of the Queensland sample and its influence has been temporarily reduced as part of the estimation process. The data will be further reviewed when October data are available”

Residential Building Booming

The latest data from the ABS shows that the trend estimate of the value of total building work done rose 1.5% in the June 2016 quarter to $26.1bn. The trend series smooths out some of the swings period to period, and provide a better view of the underlying trajectory of the numbers. Apartment building activity is driving much of the lift.

The trend estimate of the value of new residential building work done rose 2.1% in the June quarter. The value of work done on new houses was flat while new other residential building rose 4.5%. Total residential building was $17.2bn.

buidling-work-june-2016lThe trend estimate of the value of non-residential building work done rose 0.5% in the June quarter and worth $8.9bn.

The statistics were compiled using building approval details and returns collected from builders and other individuals and organisations engaged in building activity. Since the September quarter of 1990, the quarterly estimates have represented all approved public and private sector owned:

  • residential building jobs valued at $10,000 or more.
  • non-residential building jobs valued at $50,000 or more.


Mortgage Lending Flows Slowed In August

The latest home finance data from the ABS to August 2016 shows that overall housing lending fell slightly, down 0.22% to $31.7bn, in trend terms. But you need segmented analysis to understand what is going on.

Lending for investment purposes rose by 1% to 11.9bn, 37.5% of all lending, up from 37.1% last month, whilst in owner occupied property land, total volumes fell from 55,301 to 54,600 (down 1.27%) and the total value of new loans was $19.8 billion, down from $20 billion (down 0.93%) the previous month.

abs-housing-aug-2016Looking at all trend home lending flows, investment lending borrowing for an existing property rose by individuals 2.3% to $9.8bn, and there were small rises in loans for OO construction and new dwellings.

abs-housing-aug-2016-mom

Owner occupied refinance still remains high, at 39% of existing OO loans, though the volumes are down a little this month to $6.6bn. This is more than 20% of all loan transactions (OO and INV), and up from 17% in 2013.

abs-housing-aug-2016-ooand-refLooking at the OO month on month movements, construction ($1.8bn) and purchase of new dwellings ($1bn) were both up, by 0.56%, showing that demand for, and lending for new property is still being met. However, the value of purchase of established dwellings fell 1.18% to $16.9 bn. Refinanced loans also fell, by 1.31% to $6.6 bn.

abs-housing-aug-2016-oo-deltaFirst time buyers are impacted by ABS revisions, but overall we see a lift in the number of FTB OO buyers, up 3.5% to 7,372. They also made a larger share of all buyers, at 13.4%, but still way below their peak in 2009.

We track FTB investors, who are not caught in the ABS statistics, and last month another estimated 4,061 when straight to the investment property sector, a rise of 3.4%. So overall the FTB sector in total was 11,434, up 3.5% on the previous month. You can read more about the FTB changes to the ABS data here.

The overall trend trajectory however is lower, despite record low interest rates.

ftb-aug-2016-allLoans for investment purchases, refinance, and loans for new property are still supporting the market, whilst momentum in the large existing market sector, refinance apart, is slowing.


Retail trend turnover rises 0.1 per cent in August

The trend estimate for Australian retail turnover rose 0.1 per cent in August 2016 following a 0.1 per cent rise in July 2016 according to the latest Australian Bureau of Statistics (ABS) Retail Trade figures. Compared to August 2015 the trend estimate rose 2.6 per cent.

retail-aug-2016

Australian retail turnover rose 0.4 per cent in August 2016, seasonally adjusted. This follows a relatively unchanged (0.0 per cent) July 2016.

In seasonally adjusted terms, the largest rise was in department stores (3.5 per cent), which followed a fall in July of 5.8 per cent. There were also seasonally adjusted rises in cafes, restaurants and takeaway food services (1.2 per cent), food retailing (0.3 per cent) and household goods retailing (0.2 per cent). There were falls in other retailing (-0.6 per cent) and clothing, footwear and personal accessory retailing (-0.4 per cent).

retail-aug-2016-stateIn seasonally adjusted terms, there were rises in Victoria (0.7 per cent), New South Wales (0.5 per cent), Queensland (0.7 per cent), South Australia (0.4 per cent) and the Australian Capital Territory (0.7 per cent). There were falls in Western Australia (-0.5 per cent), Northern Territory (-0.5 per cent) and Tasmania (-0.1 per cent).

Online retail turnover contributed 3.3 per cent to total retail turnover in original terms.

First Time Buyer Numbers Lowered By ABS

The ABS has released revisions to its First Time Buyer Original data to unscramble FTBs from FTB grants. As a result, the number of owner occupied first time buyers is EVEN LOWER. At worst they were overstated by 14%.

ftb-revisions-sept-2016This underscores again the difficulty faced by this household segment, as we discussed last week. Without parental support they are finding it really tough.

However the ABS still fails to pick up the substantial number of FTBs going direct to the investment sector. They should. We run our own series using data from the household surveys.

This is what the ABS says.

The ABS publishes monthly statistics relating to first home buyers in Housing Finance, Australia (cat. no. 5609.0): Table 9a (Australia) and Table 9b (State) on the downloads tab; and in Table 9 in the PDF document. First home buyer and other ABS lending statistics are collected on behalf of the ABS by the Australian Prudential Regulation Authority (APRA).

First home buyers are defined as persons entering the home ownership market for the first time as owner occupiers. First time investors are not included.

This paper provides details on the changes to previously published first home buyer statistics as a result of improved reporting by lenders.

BACKGROUND

In 2014, it was established that some lenders were reporting only loans extended to first home buyers who had also received a First Home Owner Grant instead of all first home buyers. As this would have resulted in an underestimation of the number of first home buyers, the ABS adjusted the estimates to account for the under-reporting. The methodology used to adjust the estimates to account for the under-reporting was published in the Information paper: Changes to the method of estimating loan commitments to first home buyers, 2015 (cat. no. 5609.0.55.003) which was released on 4 February 2015.

REVISIONS TO FIRST HOME BUYER STATISTICS

The ABS and APRA worked successfully with lenders to ensure that, in the future, all loans to first home buyers are reported, regardless of whether or not they received a First Home Owner Grant. As a result, from August 2016, the number of first home buyers will no longer require adjustment as most lenders will be reporting correctly.

In the process of working with lenders, corrected historical data has been reported by some lenders and this improved data has been used to re-estimate the first home buyer statistics back to October 2012. This has resulted in revisions to the number of first home buyers for the period October 2012 to July 2016. These revisions impact on estimates for the number of first home buyers, the first home buyer ratio and the average loan size for first home buyers.

While the revised estimates show fewer first home buyers than previously reported over the period October 2012 to July 2016, the month to month movements are broadly consistent with the previously published series. For the most recent month (i.e. July 2016) the number of first home buyers in Australia has been revised down by 465 from 7,586 to 7,121.