Population On The Rise – Melbourne To Become Largest City

The ABS released their latest population data today, based on March 2016.  Sustained population and household growth is expected, which will support property values for some time to come. We have more than 9.2 million households and recent growth has been supported by net migration.

Total population is north of 24 million and overall Australia’s population grew by 327,600 people (1.4 per cent). Of this, net overseas migration added 180,800 people to the population (2 per cent higher than the previous year), and accounted for 55 per cent of Australia’s total population growth.

Natural increase contributed 146,800 additional people to Australia’s population, made up of 304,300 births (1.6 per cent lower than the previous year) and 157,500 deaths (1.7 per cent higher).

Over the year, net overseas migration was the major contributor to population change in New South Wales, Victoria, South Australia and Tasmania, whilst natural increase was the major contributor in all other states and territories.

pop-by-stateVictoria’s population has hit 6 million growing by 1.9 per cent, adding an extra 114,900 people to the population. This is the fastest population growth for Victoria since 2009 and is well above Australia’s growth rate of 1.4 per cent. New South Wales was the next fastest state, increasing by 1.4 per cent. Queensland and the Australian Capital Territory were not far behind, with both growing at 1.3 per cent.

Net overseas migration was the main contributor to growth in Victoria, adding 62,800 people to the population over the year ending March 2016. The remainder of Victoria’s population change was explained by natural increase (+37,600) and net interstate migration (+14,500).

The Victorian population is projected to reach 7 million in 2024 and the forward projections to 2036 show more households in Greater Melbourne than Greater Sydney.

pop-by-state-2036-citiesOverall household  estimates for 2036 show a population of more than 12 million households, up from 9.2 million in March 2016.

pop-by-state-states-2036Of course these long range estimates are indications only, but it would appear demand for property will be sustained – another reason why it is unlikely we will see a major property correction anytime soon.


Home Prices Rebound To June 2016; Worth $6 Trillion

Sydney property prices rose in June quarter 2016 after six months of falls, according to figures released today by the Australian Bureau of Statistics (ABS).

Prices for established houses in Sydney rose 3.2 per cent and attached dwellings rose 2.0 per cent.

Residential property prices fell in Perth and Darwin, while prices rose in all other capital cities.

abs-june-2016-house-prices-trendMelbourne recorded the strongest through the year growth of 8.2 per cent, followed by Canberra at 6.0 per cent.

Established house prices for the eight capital cities rose 2.3 per cent and attached dwellings rose 1.4 per cent in the June quarter 2016.

abs-june-2016-house-pricesThe total value of Australia’s 9.7 million residential dwellings increased $138.3 billion to $6.0 trillion. The mean price of dwellings in Australia is now $623,000.

Trend Unemployment Unchanged At 5.7%

Monthly trend employment in Australia increased in August 2016, according to figures released by the Australian Bureau of Statistics (ABS) today.

emp-aug-2106

In August 2016, trend employment increased by 9,900 persons to 11,965,100 persons – a monthly growth rate of 0.1 per cent. Trend part-time employment growth continued, with an increase of 10,200 persons, while full-time employment decreased by 400 persons.

”The latest Labour Force release shows continued strength in part-time employment growth, with the majority coming from increasing male part-time employment. Since December 2015, there are now around 105,300 more persons working part-time, compared with a 21,500 decrease in those working full-time,” said the Program Manager of ABS’ Labour and Income Branch, Jacqui Jones.

The trend monthly hours worked increased by 1.7 million hours (0.1 per cent), although it remained below the high in December 2015, reflecting the shift in full-time and part-time employment.

In considering the contribution of the Census to employment, the ABS confirmed that it will have resulted in an increase in hours that were worked during the month, more than the persons in employment. “Of the majority of the persons who were employed for the Census, most already had another job, but worked more hours during the month,” Ms Jones said.

The trend unemployment rate remained steady at 5.7 per cent. The participation rate was also unchanged at 64.8 per cent. Both of these figures have been relatively steady since May 2016.

The trend underemployment rate, which is a quarterly measure of employed persons who want and are available to work more hours, increased by 0.1 percentage points since May 2016, to 8.6 per cent in August 2016, the highest it has ever been.

Trend series smooth the more volatile seasonally adjusted estimates and provide the best measure of the underlying behaviour of the labour market.

The seasonally adjusted number of persons employed decreased by 3,900 in August 2016. The seasonally adjusted unemployment rate for August 2016 decreased by 0.1 percentage points to 5.6 per cent, and the seasonally adjusted labour force participation rate decreased by 0.2 percentage points to 64.7 per cent.

Business Lending Crunched – Investment Lending Apart

The final set of ABS data on finance for July 2016 includes all forms of lending, and does not tell a good story. Whilst investment housing lending grew, lending for productive business growth fell, again.

Here is the summary, having separated business lending for housing investment purposes, versus the rest. As normal we will focus on the trend data, which irons out some of the noise in the data, to see through to the underlying movements.

Lending for secured construction and purchase of dwellings fell 0.1%, or $20m, month on month, secured alterations rose just a little, personal finance rose 0.1% or $6m and overall commercial lending fell 1.75% or $671m compared with last month, and continues to fall.

Within the business or commercial flows, lending for investment property rose 1.1% or $127m, compared with last month, whilst lending for other commercial purposes fell 2% or $384m. Revolving commercial credit fell 5% down $416m.

So productive lending to business continues to fall, and overall lending is being supported by more investment housing. As a result, the proportion of business lending for investment housing rose again to 31% of commercial lending, whilst lending for other commercial purposes fell again to 48.2% of all commercial lending. These trends need to be reversed if we are to get real productive economic growth to kick in.

abs-fin-jul-2016-allFinally, for completeness, here is the housing data, once again showing the ongoing rise in the proportion of investment housing lending, up 1.1% or $127m on last month, and up from 35.9% to 36.1% of total flows.

abs-fin-jul-2016-housingWe think tighter macroprudential measures are overdue.

Investment Loans Still Growing

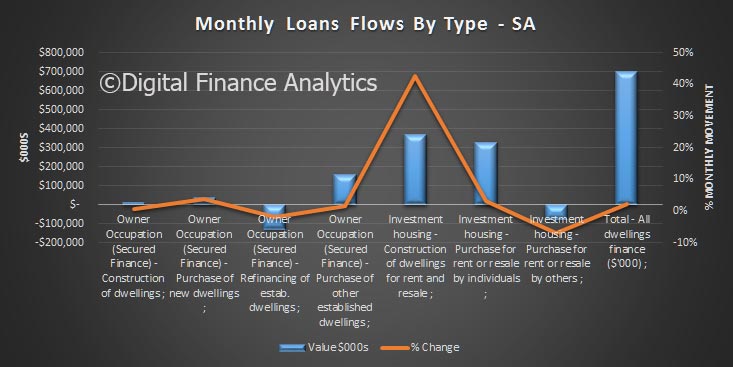
The latest lending finance data from the ABS, released today, shows the total value of dwelling finance commitments excluding alterations and additions rose 0.3%. Investment housing commitments rose 1.1%, while owner occupied housing commitments fell 0.1%. The less reliable seasonally adjusted measure showed the total falling by 1.8%. Many commentators will I am sure focus on this, and claim there is a “dramatic correction”.

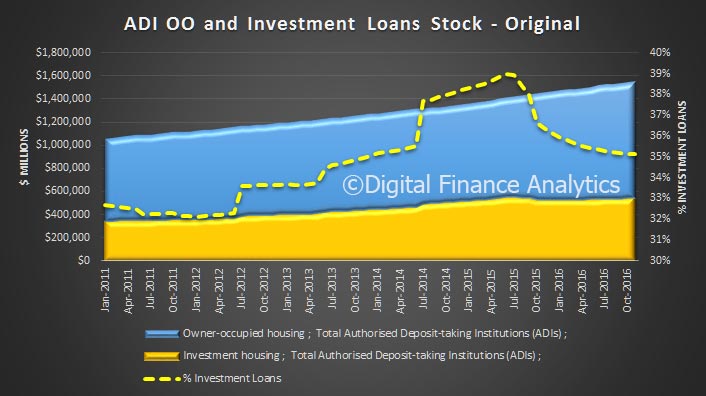
The original loan stock series shows an annual growth rate of housing lending still running close to 7%; with a slight slow down in recent months – not the significant slow down some have suggested.

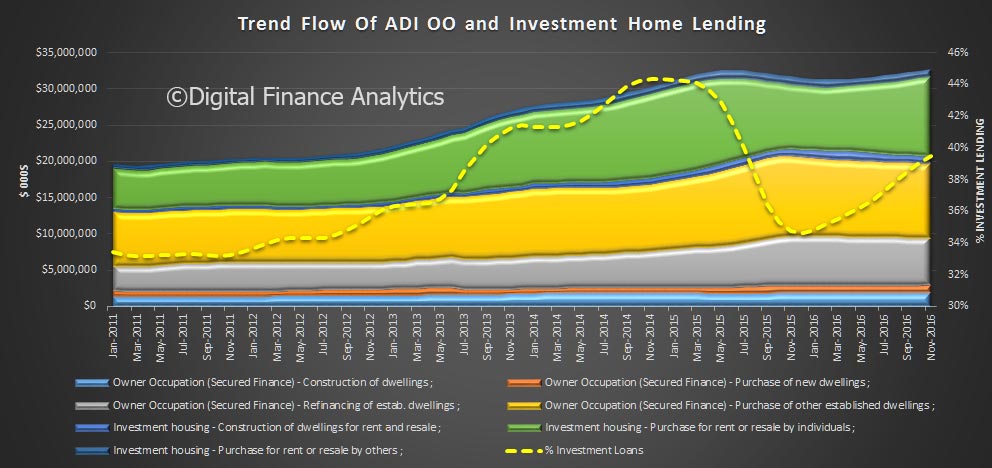
home-lenidng-trend-growth-july-2016-absTotal loans on book, in original terms, is $1.52 trillion, up 0.46%, of which 35.28% are for investment loan purposes, down from 35.36% last month. Investment lending stock rose $1.3 billion (up 0.24%) and OO lending stock rose 0.93%, up $9 billion. Remember, more than $1bn loans were reclassified in the month, so there is noise in the data.

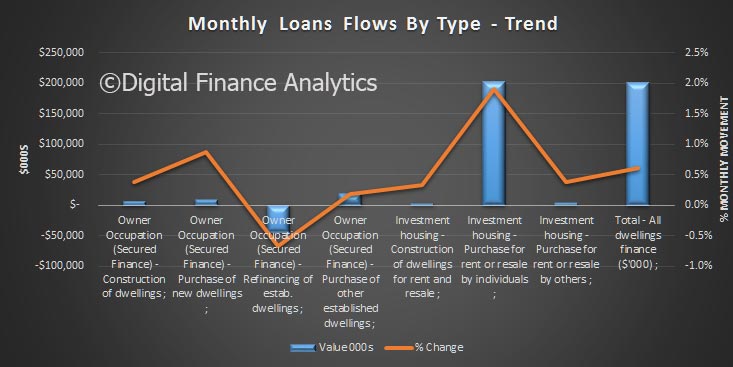
home-lenidng-trend-stock-july-2016-absLooking at the monthly trend flows,  momentum continues to ease, but more slowly.

home-lenidng-trend-oo-growth-july-2016-absLast month, construction loans fell 0.34% in number terms, down 19,000; and fell by $0.7m in value terms. There was a rise in the number of new dwellings purchased, up 0.45% or 12,000; and in value terms up 0.66% or $6.5m. The purchase of established dwellings fell by $26m, or 0.15%. The number of refinanced transactions continued to rise, up 42,000, or 0.2%, and up 0.06% or $4.3m. The proportion of refinanced transactions fell by 0.18% compared with last month, or $24m. Refinancing remains a critical driver of ongoing growth.

home-lenidng-trend-oo-flow-july-2016-absIn trend terms, the value of investment loans rose by $127m or 1.1%, and made up 36.6% of new transactions, up compared with 36.3% last month.

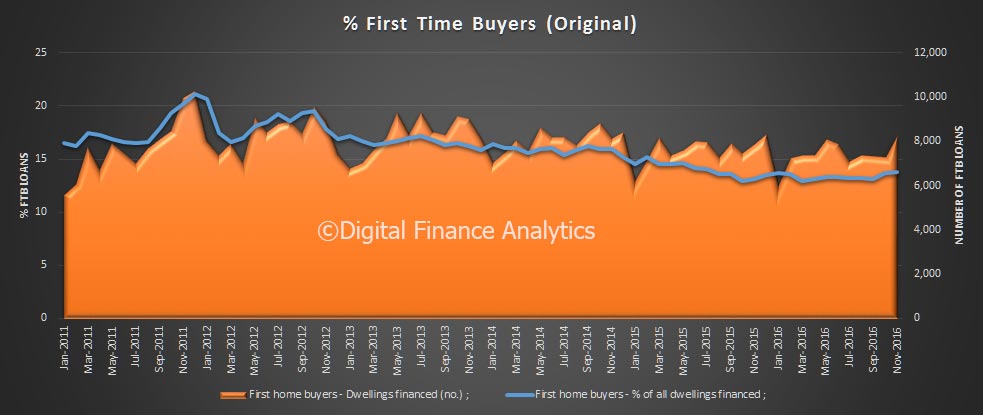
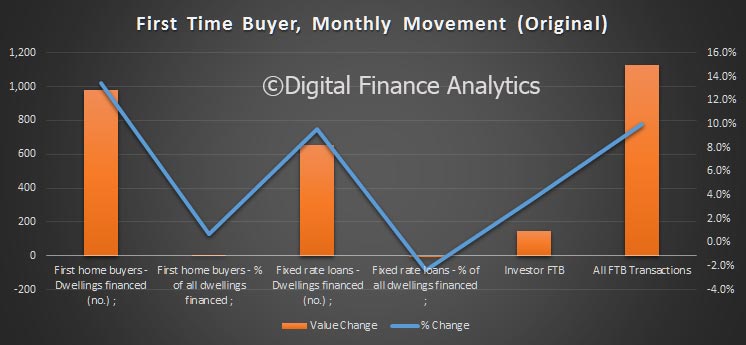
home-lenidng-trend-flow-july-2016-absFinally, in original terms, the number of first home buyer commitments as a percentage of total owner occupied housing finance commitments fell to 14.1% in July 2016 from 14.3% in June 2016. The number fell from 8,486 to 7,586, down more than 10%.  The average loan size was $335,600, 0.2% higher than last month.  Signs of tightening in lending conditions?

home-lenidng-ftb-july-2016-absA proportion of first time buyers continue to go direct to the investment sector, as shown in the chart below which overlays our survey data on the ABS data-set.

home-lenidng-all-ftb-july-2016-abs


Economy grows 0.5 per cent in June Quarter

Australia’s economic growth slowed in the June quarter. Data released by the Australian Bureau of Statistics (ABS) today show that Gross Domestic Product (GDP) grew 0.5 per cent in seasonally adjusted terms in the June quarter 2016, down on the growth of 1.0 per cent the economy experienced in the March quarter. GDP grew 3.3 per cent through the year bringing the annual growth for the 2015-16 financial year to 2.9 per cent.

In trend terms, which smooths out the series, growth fell again a little, with 0.7% growth in the quarter.

GDp-June-2016Net National Disposable Income improved, thanks for household and public spending. However household spending is slipping as low wage growth, and high debts bite. Government investment is filling some of the vacuum created by the mining sector slow down.

NNI-June-2016


The ABS says: GDP growth in the June quarter was driven by domestic final demand, which rose 0.6 per cent this quarter, supported by ongoing growth in household and public consumption. Total investment was flat in the quarter, with the continued reduction in engineering construction associated with the mining sector offset by growth in public investment.

International trade detracted from growth in the quarter due to strong growth in imports and a slowing in the rate of growth in exports. After strong growth in the March quarter, production in the mining industry was lower in seasonally adjusted terms in the June quarter.

Income growth was supported by an increase in profits of non-financial corporations associated with an improvement in Australia’s terms of trade. The terms of trade growth of 2.3 per cent in seasonally adjusted terms was the first increase since December 2013. Compensation of employees rose by a modest 0.5 per cent in the June quarter to be 3.1 per cent higher through the year. This is in line with the modest through the year growth observed in hours worked (0.7 per cent) and the Wage Price Index (2.1 per cent) previously published by the ABS.


Retail Turnover Unchanged In July

Australian retail turnover was relatively unchanged (0.0 per cent) in July 2016, seasonally adjusted, according to the latest Australian Bureau of Statistics (ABS) Retail Trade figures. This follows a rise of 0.1 per cent in June 2016.

The trend estimate rose 0.1 per cent in July 2016 following a 0.1 per cent rise in June 2016. Compared to July 2015 the trend estimate rose 2.7 per cent.

Retail-Trend-Jul-2016

In seasonally adjusted terms, there were rises in food retailing (0.7 per cent), cafes, restaurants and takeaway food services (1.2 per cent), other retailing (0.2 per cent) and clothing, footwear and personal accessory retailing (0.3 per cent). There were falls in department stores (-6.2 per cent) and household goods retailing (-0.7 per cent) in July 2016.

In seasonally adjusted terms, there were rises in Queensland (0.5 per cent), South Australia (0.5 per cent), Western Australia (0.3 per cent), the Australian Capital Territory (1.2 per cent), Tasmania (0.5 per cent) and the Northern Territory (0.4 per cent). There were falls in Victoria (-0.6 per cent) and New South Wales (-0.2 per cent).

Online retail turnover contributed 3.1 per cent to total retail turnover in original terms. Compared to July 2015, online retail rose 4.1 per cent.

Building Approvals Up In July

The number of dwellings approved rose 0.2 per cent in July 2016, in trend terms, and has now risen for eight months, according to data released by the Australian Bureau of Statistics (ABS) today. The number of units rose, whilst the number of houses fell.

Build-Approval-July-2016

Dwelling approvals increased in July in New South Wales (2.4 per cent) and Victoria (0.5 per cent) but decreased in Tasmania (3.7 per cent), Northern Territory (3.2 per cent), Australian Capital Territory (2.6 per cent), Queensland (1.8 per cent), South Australia (1.8 per cent) and Western Australia (1.8 per cent) in trend terms.

In trend terms, approvals for private sector houses fell 0.5 per cent in July. Private sector house approvals fell in South Australia (1.6 per cent), Western Australia (1.5 per cent) and Victoria (1.1 per cent). Private sector house approvals rose in Queensland (0.8 per cent) and were flat in New South Wales.

In seasonally adjusted terms, total dwelling approvals increased 11.3 per cent, driven by a rise in total other residential dwelling approvals (23.4 per cent). Total house approvals fell 0.6 per cent.

The value of total building approved rose 1.9 per cent in July, in trend terms, and has risen for seven months. The value of residential building rose 0.9 per cent, while non-residential building rose 3.9 per cent.

Mortgage Securitisation On The Up

The latest ABS data covering the Assets and Liabilities of Australian Securitisers was released today, to June 2016. Total assets of Australian securitisers were $138.7b, up $2.6b (1.9%) on 31 March 2016, though still well below the GFC peak. The increase in total assets was mainly due to an increase in residential mortgage assets (up $1.4b, 1.2%), other loans (up $0.8b, 5.4%) and; cash and deposits (up $0.2b, 4.5%).  This rise is linked to the momentum in the mortgage market, and includes the non-bank sector, who are lending more, using securitised funding.

Secuiritisers-Jun-2016---AssetsThe bulk of issuance was within Australia, quite different from pre-GFC. Asset backed securities issued in Australia as a proportion of total liabilities decreased to 76.4%, down 0.9% on the March quarter 2016 proportion of 77.3%. Asset backed securities issued overseas as a proportion of total liabilities increased to 4.6%, up 0.1% on the March quarter 2016 proportion of 4.5%.

Secuiritisers-Jun-2016---LiabAt 30 June 2016, total liabilities of Australian securitisers were $138.7b, up $2.6b (1.9%) on 31 March 2016. The increase in total liabilities was due to an increase in loan and placements (up $1.7b, 7.1%), long term asset backed securities issued in Australia (up $1.1b, 1.1%), and asset backed securities issued overseas (up $0.3b, 4.2%).


Trend employment growth continues

Monthly trend employment in Australia increased in July 2016, according to figures released by the Australian Bureau of Statistics (ABS) today. However, there are significant state variations as well as movements between full-time and part-time work. Younger Australians and females are more likely to be unemployed.  Beware the national averages!

The trend unemployment rate remained steady at 5.7 per cent. The participation rate also remained steady at 64.8 per cent. These figures have been constant since May 2016.

July16UnemploymentIn July 2016, trend employment increased by 11,800 persons to 11,955,100 persons – a monthly growth rate of 0.1 per cent. Trend part-time employment growth continued, with an increase of 10,600 persons, while full-time employment increased by 1,200 persons.

“The latest Labour Force release shows continued strength in part-time employment growth. Over the past six months there has been an increase of 82,600 people working part-time, compared with a 21,600 decrease in those working full-time,” said the Program Manager of ABS’ Labour and Income Branch, Jacqui Jones.

The trend monthly hours worked in all jobs increased by 0.9 million hours (0.06 per cent), although it remained slightly below the high in December 2015.

Trend series smooth the more volatile seasonally adjusted estimates and provide the best measure of the underlying behaviour of the labour market.

The seasonally adjusted number of persons employed increased by 26,200 in July 2016. The seasonally adjusted unemployment rate for July 2016 decreased by 0.1 percentage points to 5.7 per cent and the seasonally adjusted labour force participation rate remained unchanged at 64.9 per cent.

It appears that full-time and part-time unemployment are moving differently, with a rise in both male and female part-time rates.

July16Unemployment1Younger Australians have much higher, and rising unemployment.

July16Unemployment2There are significant variations across states, with several, including WA, QLD, TAS and SA above 6%, whilst ACT and NT have much lower rates.

July16Unemployment3The trends tell the story, with rates falling in NSW and VIC, whilst rising in QLD and WA.

July16Unemployment4