Dwelling approvals rise in April

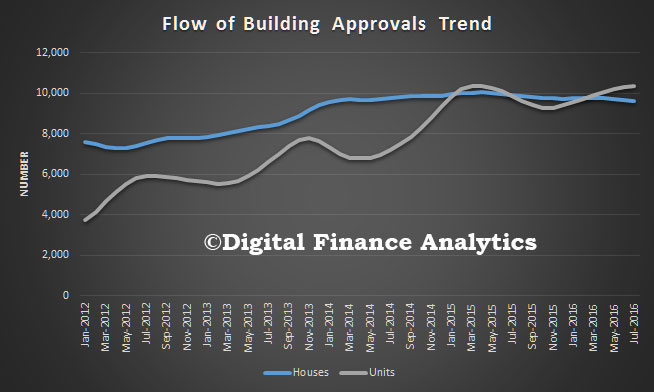
The number of dwellings approved rose 1.2 per cent in April 2016, in trend terms, and has risen for five months, according to data released by the Australian Bureau of Statistics (ABS) today.

Dwelling approvals increased in April in the Australian Capital Territory (6.7 per cent), Queensland (2.9 per cent), South Australia (2.2 per cent), Tasmania (1.9 per cent) and New South Wales (1.4 per cent). Dwelling approvals decreased in the Northern Territory (15.2 per cent) and Western Australia (0.1 per cent) in trend terms, and were flat in Victoria.

In trend terms, approvals for private sector houses rose 0.2 per cent in April. Private sector house approvals rose in South Australia (2.0 per cent), Victoria (0.7 per cent) and New South Wales (0.7 per cent), but fell in Western Australia (1.4 per cent) and Queensland (0.6 per cent).

In seasonally adjusted terms, dwelling approvals increased 3.0 per cent, driven by private sector dwellings excluding houses which rose 8.7 per cent. Private sector house approvals fell 2.3 per cent in seasonally adjusted terms.

The value of total building approved rose 1.1 per cent in April, in trend terms, and has risen for three months. The value of residential building rose 1.6 per cent while non-residential building was flat.

Private Capex Spend Grinds Lower

The latest ABS data on new private business capital expenditure highlights a further fall, with the trend volume estimate falling by 2.8% in the March quarter 2016 while the seasonally adjusted estimate fell by 5.2%. Within that, the estimate for buildings and structures fell by 3.6% in the March quarter 2016 while the seasonally adjusted estimate fell by 7.9% while the trend volume estimate for equipment, plant and machinery fell by 1.0% in the March quarter 2016 while the seasonally adjusted estimate fell by 0.5%.

The proportion of mining related expenditure continues to fall, relative to other sectors.

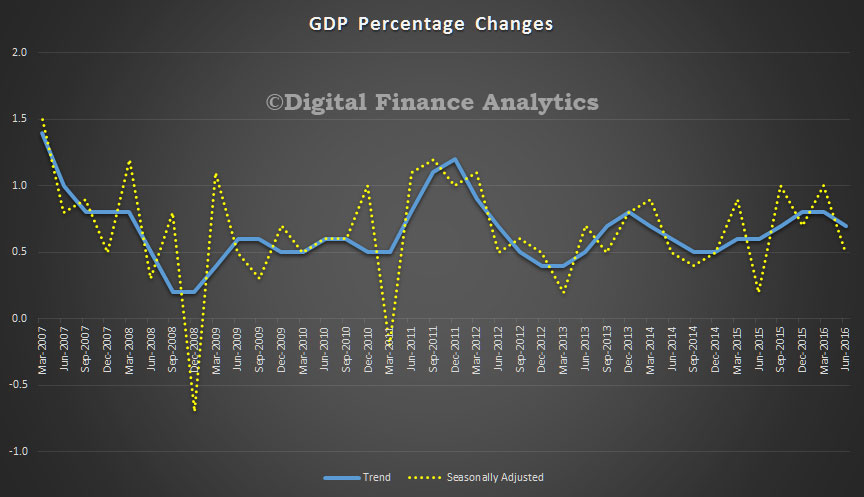
Capex-Mar-Mix2016However. non-mining sectors also took a dive. Further evidence of a lack of business confidence and a reluctance to invest. Not good for prospective economic growth.

Capex-Mar-2016

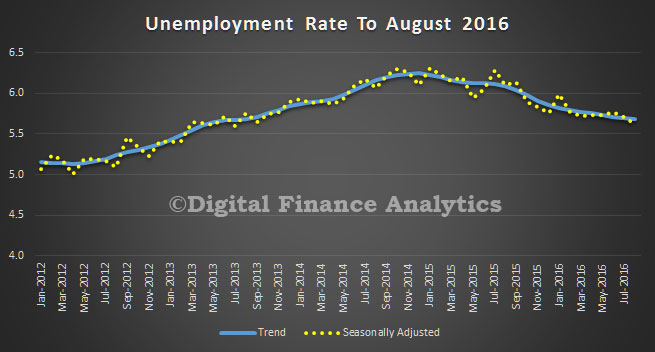
Trend Unemployment Rate Remained 5.7%

Trend employment growth in Australia continued to ease from the relatively strong growth seen in late 2015, according to figures released by the Australian Bureau of Statistics (ABS) today.

Over the past month, trend employment increased by 4,100 persons to 11,910,800 persons – a monthly growth rate of 0.03 per cent. This monthly growth rate was below the monthly average over the past 20 years (0.15 per cent), and down further from the recent peak of 0.26 per cent in October 2015.

“The trend in part-time employment growth continued from March into April, with the 10,500 increase in part-time employment being the eleventh consecutive monthly increase of more than 10,000 persons. In contrast, trend full-time employment decreased by 6,400 persons, its third consecutive monthly decrease,” General Manager of ABS’ Macroeconomic Statistics Division, Bruce Hockman said.

This is reflected in the trend monthly hours worked in all jobs series, which decreased by 5.6 million hours (0.3 per cent) to 1,628.9 million hours. This was the fourth consecutive decrease in hours worked in all jobs, which reflects a combined decrease of 16.2 million hours (1.0%) from the high point at December 2015.

In considering growth over the last year, trend employment increased by around 228,900 persons (an annual growth rate of 2.0 per cent). This is down from the annual employment growth of 295,000 persons (2.6 per cent) at December 2015.

The trend unemployment rate decreased slightly, down to 5.7 per cent. The participation rate also decreased slightly, though it remained at 64.9 per cent in rounded terms.

“The trend series smoothes the more volatile seasonally adjusted estimates and provide the best measure of the underlying behaviour of the labour market,” Mr Hockman said.

The seasonally adjusted number of persons employed increased by 10,800 in April 2016. The seasonally adjusted unemployment rate for April 2016 remained unchanged at 5.7 per cent and the seasonally adjusted labour force participation rate decreased by less than 0.1 percentage points to 64.8 per cent.

Wage Growth Continues In the Doldrums

The seasonally adjusted Wage Price Index (WPI) rose 0.4 per cent in the March quarter 2016, according to figures released today by the Australian Bureau of Statistics (ABS). Through the year to March quarter 2016 the WPI rose 2.1 per cent, the lowest rate since the series started in September quarter 1998.

In the March quarter 2016, private sector wages grew 0.4 per cent and public sector wages rose 0.5 per cent (seasonally adjusted). Through the year private sector wages grew at a slower pace than public sector, 1.9 per cent compared to 2.5 per cent (seasonally adjusted).

The education and training industry recorded the highest quarterly rise of 1.0 per cent in March quarter 2016, coinciding with the commencement of the new school year. The construction; professional, scientific and technical services; and administrative and support services industries have all recorded annual growth of less than 2.0 per cent for five consecutive quarters.

Housing Lending Keeps The Ship Afloat

The final data from the ABS for March lending finance includes data on all the flows, including commercial. Trend finance for owner occupied housing flows fell 0.7% to $20.9 billion in the month, personal finance rose 0.5% to $6.9 billion and commercial finance fell 1% to $41.9 billion (which includes investment housing lending of $11.7 billion).

All-Lending-Mar-2016-FlowsLooking at the overall lending trends, we see on a 3 month rolling average, credit flows fell by 0.73% and have been falling since October 2015.

Data on commercial lending for the purchase of existing investment properties shows an uptick, based on the original data by selected states. After the slowing around the summer, it is now trending higher, especially in NSW  (before the cash rate cut).

Lenidng-By-State

We can also look at some of the other ratios which are important. First, total housing lending – including owner occupation and investment made up 46.7% of all lending flows. This is a record, and shows that the banks are reliant on housing lending to keep their ships afloat. The proportion of commercial lending not investment property related to all lending was 42.7%, and has been falling since October 2015.    The proportion of commercial lending which was for investment property related, to all commercial lending rose to 28.1%, the highest it has been for six months.

All-Lending-Mar-2016-Flows-Ratios So do not be fooled by talk of the home lending market stalling, it is not so. Even before the RBA’s cash rate cut at the start of May, housing lending of all flavours was significant, and demand will likely rise as  lower rates flow through, especially as the stock markets look shaky in May (sell in May and go away…?) and deposit interest rates are being killed.

Economically though, more home lending does not solve our economic growth problem.

Investment Home Lending in March Stronger

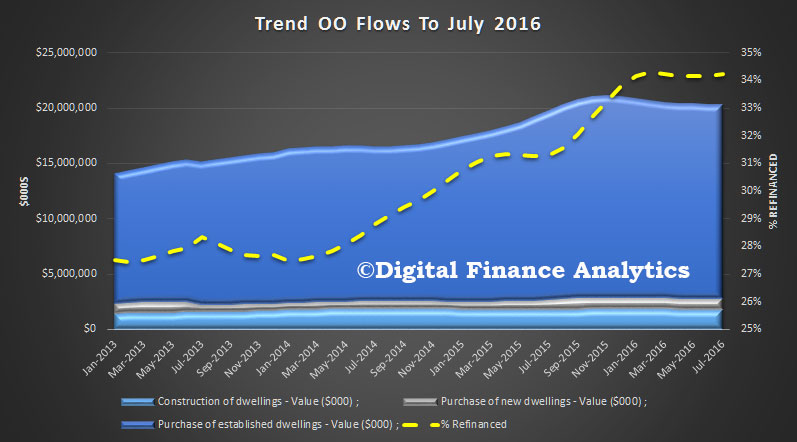
The latest housing finance data from the ABS for March 2016 showed that looking at trend data, investment lending was stronger, up 1.1% whilst owner occupied lending fell 0.7% month on month. However, we know there was more than $1.5 bn of adjustments in March, so the data should be handled with care. Significantly, the proportion of loans being refinanced continued to grow, up to 34.3% by value.

ABS-March-2106-RefiThe percentage changes show significant falls in the purchase of new dwellings, down 5.8%, whilst refinance fell just 0.4% by value.

ABS-March-2106-ChangeIn trend terms, the number of commitments for owner occupied housing finance fell 0.2% in March 2016, whilst the number of commitments for the purchase of new dwellings fell 3.3%, the number of commitments for the construction of dwellings fell 0.9% and the number of commitments for the purchase of established dwellings rose 0.1%.

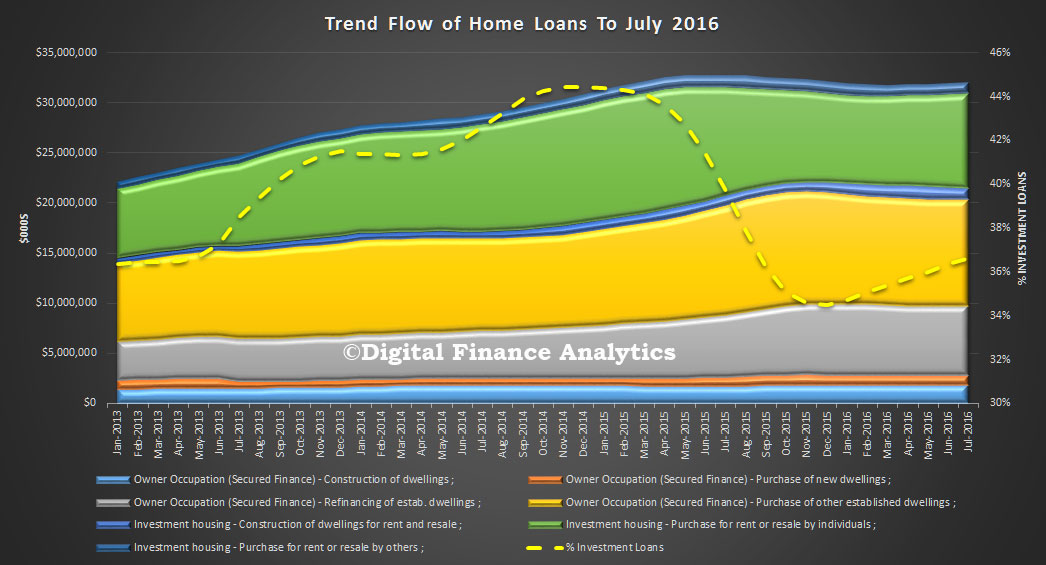
Looking at the mix of loans, the proportion of new loans for investment purposes rose from 35.7% to 36.1% in March.

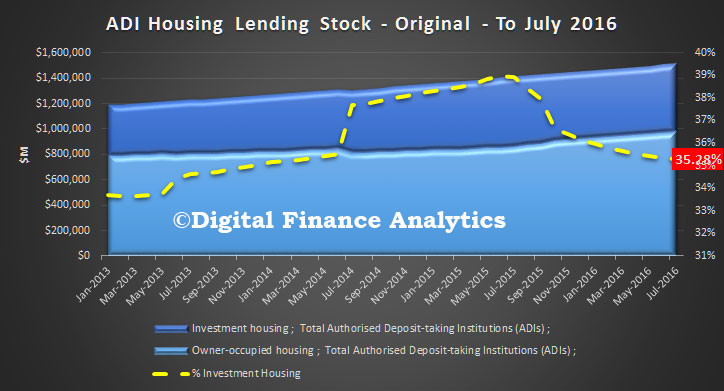
ABS-March-2106-FlowsIn stock terms, the proportion of investment loans fell slightly, from 35.8% to 35.7%. Owner occupied loan stock rose 0.71% to $953 billion, whilst investment loans grew 0.11% to $529 billion. Overall loan stock rose by 0.49% to $1,482 billion.

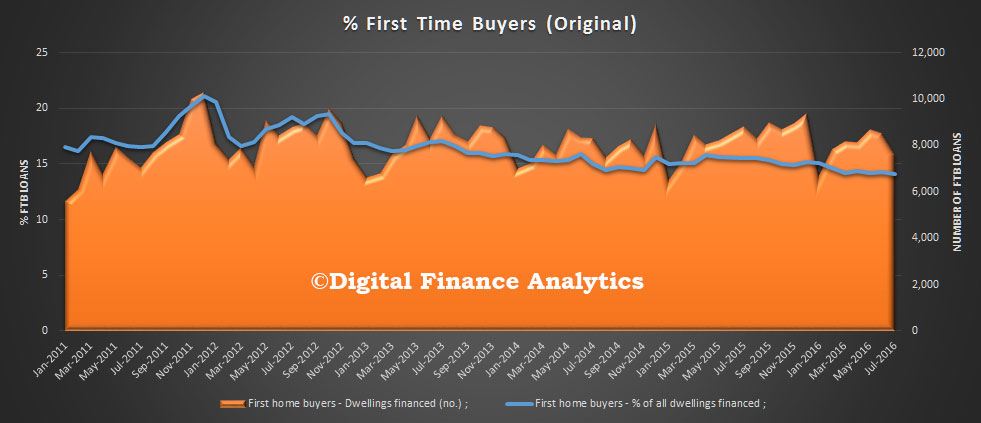
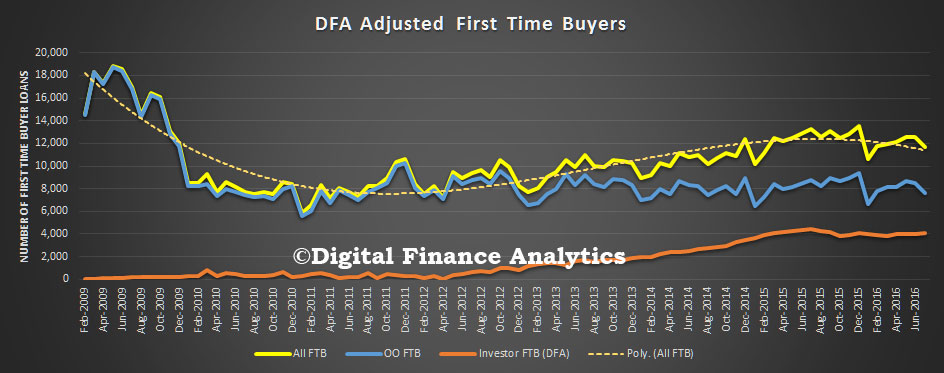
ABS-March-2106-StockIn original terms, the number of first home buyer commitments as a percentage of total owner occupied housing finance commitments fell to 14.2% in March 2016 from 14.6% in February 2016.

ABS-March-2106-FTBHowever, the number of loans rose by 4.1%, and the average loan loan size was $329k. We are still seeing a number of first time buyers going direct to the investor sector, through our household surveys, but the volumes were down by 2.8% in the month. Overall, there were 11,972 first time buyer transactions, up 1.8%; in original terms.

ABS-March-2106-FTB-All


Retail turnover rises 0.4 per cent in March

Australian retail turnover rose 0.4 per cent in March 2016, seasonally adjusted, according to the latest Australian Bureau of Statistics (ABS) Retail Trade figures.

This follows a rise of 0.1 per cent in February 2016.

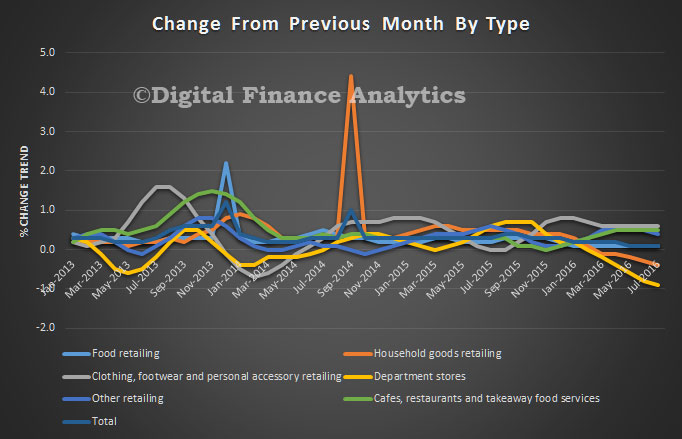
In seasonally adjusted terms, there were rises in food retailing (0.6 per cent), clothing, footwear and personal accessory retailing (1.1 per cent), other retailing (0.4 per cent) and household goods retailing (0.1 per cent). Turnover in cafes, restaurants and takeaway food services was relatively unchanged (0.0 per cent). Department stores fell (-0.5 per cent) in March 2016.

In seasonally adjusted terms there were rises in Victoria (0.5 per cent), New South Wales (0.4 per cent), Western Australia (0.7 per cent), Queensland (0.2 per cent), South Australia (0.2 per cent) and Tasmania (0.6 per cent). There were falls in the Australian Capital Territory (-0.6 per cent) and the Northern Territory (-0.2 per cent).

The trend estimate for Australian retail turnover rose 0.2 per cent in March 2016 following a 0.2 per cent rise in February 2016. Compared to March 2015 the trend estimate rose 3.6 per cent.

Online retail turnover contributed 3.1 per cent to total retail turnover in original terms.

In seasonally adjusted volume terms, turnover rose 0.5 per cent in the March quarter 2016, following a rise of 0.6 per cent in the December quarter 2015. The largest contributor to the rise was clothing, footwear and personal accessories retailing, which rose 3.5 per cent in seasonally adjusted volume terms in the March quarter 2016.

Dwelling approvals rise in March

The number of dwellings approved rose 0.6 per cent in March 2016, in trend terms, and has now risen for four months, according to data released by the Australian Bureau of Statistics (ABS) today.

Dwelling approvals increased in March in the Australian Capital Territory (18.9 per cent), Western Australia (1.1 per cent), Queensland (0.8 per cent) and Victoria (0.2 per cent) in trend terms. Dwelling approvals decreased in the Northern Territory (18.1 per cent), Tasmania (1.5 per cent), New South Wales (0.3 per cent) and South Australia (0.1 per cent) in trend terms.

In trend terms, approvals for private sector houses rose 0.3 per cent in March. Private sector house approvals rose in Victoria (1.7 per cent), but fell in South Australia (0.8 per cent), Western Australia (0.7 per cent) and Queensland (0.2 per cent). Private sector house approvals were flat in New South Wales.

In seasonally adjusted terms, dwelling approvals increased 3.7 per cent. Private sector house approvals rose 2.6 per cent, while private sector dwellings excluding houses rose 6.7 per cent.

The value of total building approved fell 0.9 per cent in March, in trend terms, and has fallen for eight months. The value of residential building rose 0.4 per cent while non-residential building fell 3.9 per cent.

Consumer Price Index falls 0.2 per cent

The Consumer Price Index (CPI) fell 0.2 per cent in the March quarter 2016 according to latest figures from the Australian Bureau of Statistics (ABS).

This follows a rise of 0.4 per cent in the December quarter 2015.

The CPI rose 1.3 per cent through the year to the March quarter 2016, following a rise of 1.7 per cent through the year to the December quarter 2015.

The fall in the CPI this quarter was broad based, with six out of the eleven CPI groups recording a fall for the quarter.

The most significant fall occurred in transport (–2.5 per cent), due to automotive fuel (–10.0 per cent) falling for the third consecutive quarter.

Recreation and culture (–1.0 per cent) was the second most significant contributor, with falls in both international holiday travel and accommodation (–2.0 per cent) and domestic holiday travel and accommodation (–1.9 per cent).

Food and non–alcoholic beverages (–0.2 per cent) also fell this quarter, with fruit (–11.1 per cent) providing the most significant contribution.

These falls were partially offset by rises in secondary education (+4.6 per cent), medical and hospital services (+1.6 per cent) and pharmaceutical products (+4.8 per cent).

Card fraud cost Australia $2.1 billion

Australia experienced card fraud of $2.1 billion during 2014-15, double the $1 billion in 2010-11, according to new Australian Bureau of Statistics (ABS) figures.

William Milne, Director of the ABS National Centre for Crime and Justice Statistics said even after reimbursements from financial institutions, total out of pocket losses at the time of the survey added up to $84.8 million.

In 2014-15, just over one million people experienced card fraud, compared with 662,300 in 2010-11.

Scams“More broadly, 1.6 million Australians (8.5 per cent of the population) experienced some form of personal fraud (card fraud, identity theft or scams to which they responded), the highest since the survey was first conducted in 2007,” said Mr Milne.

“Just over half (56 per cent) the population aged 15 and over were exposed to at least one scam during 2014-15, an increase from 36 per cent in 2010-11. However, the proportion of people who responded to a scam decreased from 2.9 per cent in 2010-11 to 2.4 per cent in 2014-15.”

Approximately half the people who experienced personal fraud said that their behaviour changed as a result of their experiences. This included becoming more careful or aware, and changing card details.