Sydney Home Prices Take A Dive

The Residential Property Price Index (RPPI) for Sydney fell 1.6 per cent in the December quarter 2015 following positive quarterly growth over the last three years, according to figures released today by the Australian Bureau of Statistics (ABS).  Sydney established house prices fell 2.1 per cent and attached dwellings prices fell 0.8 per cent in the December quarter 2015. Annually, Sydney residential property prices rose 13.9 per cent.

Dec-2015-Price-Movements
In other capital cities in the December quarter 2015, the RPPI rose in Melbourne (+1.6 per cent), Brisbane (+1.6 per cent), Adelaide (+0.9 per cent), Canberra (+2.8 per cent), Perth (+0.5 per cent) and Hobart (+2.5 per cent) and fell in Darwin (-1.8 per cent ).

For the weighted average of the eight capital cities, the RPPI rose 0.2 per cent in the December quarter 2015 and rose 8.7 per cent over the previous year.

The total value of Australia’s 9.6 million residential dwellings increased $31.6 billion to $5.9 trillion. The mean price of dwellings in Australia is now $612,100.

Unemployment Now 5.8%

The latest data from the ABS shows that both the trend and seasonally adjusted rate is sitting at 5.8%. The trend rate of decline is slowing however.

Feb-2016-UnemploymentThe ABS says that trend employment growth in Australia eased from the relatively strong growth seen in late 2015. In February 2016, the annual trend employment growth rate was 2.3 per cent, down from 2.6 per cent in December 2015 . That’s an increase of around 270,000 persons employed, compared with 300,000 persons.

“However, the trend employment to population ratio remained at 61.3 per cent. This reflects an increase over the year from 60.7 per cent to 61.3 per cent, while over the same period the unemployment rate decreased from 6.2 per cent to 5.8 per cent,” the ABS said.

Over the past month, trend employment increased by 11,400 persons to 11,903,100 persons, which equated to a monthly growth rate of 0.10 per cent. This monthly growth rate was below the monthly average over the past 20 years (0.15 per cent), and down from the rate of 0.26 per cent in September 2015.

The trend monthly hours worked in all jobs series increased by 2.5 million hours (0.15 per cent) to 1,653.6 million hours.

“The trend underutilisation rate, which is a quarterly measure that includes both unemployment and underemployment, decreased by 0.1 percentage points to 14.2 per cent. This decrease was observed for both males and females, predominantly reflecting decreased unemployment for males and decreased underemployment for females,” the ABS said.

The trend series smooth the more volatile seasonally adjusted estimates and provide the best measure of the underlying behaviour of the labour market.

The seasonally adjusted number of persons employed increased by 300 in February 2016, while the number of persons unemployed decreased by 27,300. The seasonally adjusted unemployment rate for February 2016 was 5.8 per cent (down 0.2 percentage points) and the seasonally adjusted labour force participation rate decreased by 0.2 percentage points to 64.9 per cent.

Housing Lending Finance Takes a Tumble

The latest data from the ABS on housing finance to January 2016 shows that the total value of dwelling commitments excluding alterations and additions (trend) fell 0.6% in January 2016 compared with December 2015. $32.4 bn of loans were written, with loans for owner occupation worth $21.2bn (down 0.1%)  and investment loans $11.2bn down 1.6%. The number of refinancing commitments for owner occupied housing (trend) rose 1.7% in January 2016, following a rise of 2.0% in December 2015.  Banks are fighting for refinance market share. We think that tighter lending standards are biting, this is reflected in a rise in the number of households who are having problems getting the loan they want. One in ten are having difficulties.

OO-Loans-Jan-2016-ABSThe total value of owner occupied housing commitments (trend) fell (down $19m, 0.1%) in January 2016. A fall was recorded in commitments for the purchase of established dwellings (down $46m, 0.3%) while rises were recorded in commitments for the construction of dwellings (up $19m, 1.0%) and commitments for the purchase of new dwellings (up $8m, 0.6%).

Per-Change-OO-Jan-2016-ABSThe number of owner occupied housing commitments (trend) rose 0.4% in January 2016, following a rise of 0.6% in December 2015. Rises were recorded in commitments for the refinancing of established dwellings (up $346m, 1.7%), commitments for the purchase of new dwellings (up $37m, 1.2%) and commitments for the construction of dwellings (up $31m, 0.5%), while a fall was recorded in commitments for the purchase of established dwellings excluding refinancing (down $188m, 0.7%).

The total value of investment housing commitments (trend) fell (down $186m, 1.6%) in January 2016 compared with December 2015. Falls were recorded in commitments for the purchase of dwellings by others for rent or resale (down $23m, 1.9%) and commitments for the purchase of dwellings by individuals for rent or resale (down $178m, 1.9%), while a rise was recorded in commitments for the construction of dwellings for rent or resale (up $15m, 1.7%).

OO-and-INV-Flows-Jan-2016-ABSBetween December 2015 and January 2016, the number of owner occupied housing commitments (trend) rose in Queensland (up $146m, 1.4%), Victoria (up $128m, 0.8%), New South Wales (up $23m, 0.1%), Tasmania (up $15m, 1.7%), the Australian Capital Territory (up $13m, 1.2%) and the Northern Territory (up $4m, 1.2%), while falls were recorded in South Australia (down $6m, 0.2%) and Western Australia (down $15m, 0.2%).

State-PC-OO-Jan-2016-ABSIn original terms, the number of first home buyer commitments as a percentage of total owner occupied housing finance commitments remain unchanged at 15.1% in January 2016 from December 2015. However, the number of loans fell from 9,357 to 6,669 in the month. Between December 2015 and January 2016, the average loan size for first home buyers fell $-9,300 to $338,800. The average loan size for all owner occupied housing commitments fell $-5,400 to $372,400 for the same period.

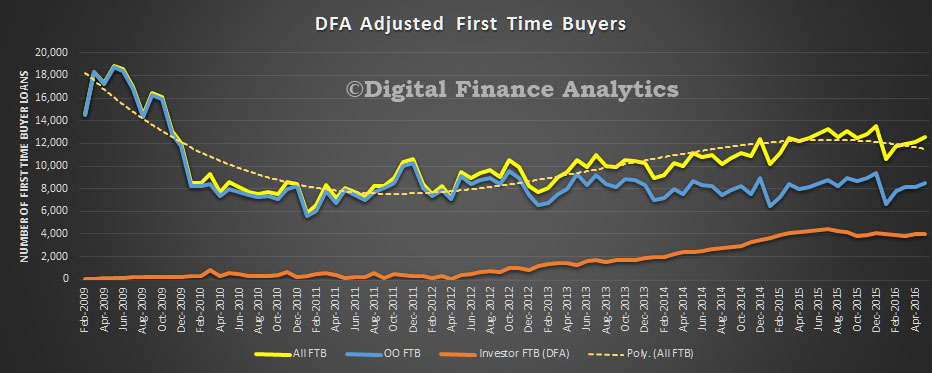
FTB-Trends-Jan-2016-ABSThe number of first time buyers going direct to the investment market fell 3%, but remains elevated compared with previous years. These transactions are based on our survey data and are not counted in the ABS FTB OO data.

All-FTB-DFA-Jan-2016 At the end of January 2016, the value of outstanding housing loans financed by Authorised Deposit-taking Institutions (ADIs) was $1,466b, up $8b (0.5%) from the December 2015 closing balance. Owner occupied housing loan outstandings financed by ADIs rose $8b (0.8%) to $939b and investment housing loan outstandings financed by ADIs was flat at $528b. Overall 36% of loans are for investment housing purposes.

ADI-Loan-Stovck-Jan-2016-ABS

Retail turnover rose 0.3 per cent in January 2016

Australian retail turnover rose 0.3 per cent in January 2016 following a relatively unchanged December 2015 (0.0 per cent), seasonally adjusted, according to the latest Australian Bureau of Statistics (ABS) figures released today.

In seasonally adjusted terms there were rises in other retailing (1.4 per cent), household goods retailing (1.0 per cent), cafes, restaurants and takeaway food services (1.0 per cent) and clothing, footwear and personal accessory retailing (0.1 per cent). Food retailing (-0.2 per cent) and department stores (-1.3 per cent) both fell in January 2016.

In seasonally adjusted terms there were rises in New South Wales (0.5 per cent), Queensland (0.3 per cent), South Australia (0.4 per cent), Western Australia (0.2 per cent), Tasmania (1.0 per cent), the Australian Capital Territory (0.7 per cent) and the Northern Territory (1.3 per cent). Victoria (0.0 per cent) was relatively unchanged in January 2016.

The trend estimate for Australian retail turnover rose 0.3 per cent in January 2016 following a 0.3 per cent rise in December 2015. Compared to January 2015 the trend estimate rose 4.0 per cent.

Online retail turnover contributed 2.9 per cent to total retail turnover in original terms.

Australian economy grows 0.6 per cent

Australia’s GDP, in seasonally adjusted chain volume terms, grew 0.6 per cent in the December quarter 2015, according to figures released today by the Australian Bureau of Statistics (ABS).

The growth in expenditure was driven by a rise of 0.8 per cent in Household final consumption expenditure and a rise of 6.0 per cent in Public gross fixed capital formation. These were partially offset by a fall in private business investment (-3.3 per cent), driven by a fall in new engineering construction (-12.3 per cent).

The growth in Household final consumption was reflected in the service industries of Information, media and telecommunications (2.7 per cent), and Retail trade (1.0 per cent). Other industries that had significant growth were Rental, hiring and real estate (2.8 per cent) and Wholesale trade (1.6 per cent).

The December quarter saw the Terms of trade decrease 3.2 per cent in seasonally adjusted terms.

Building Approvals Stumble into 2016

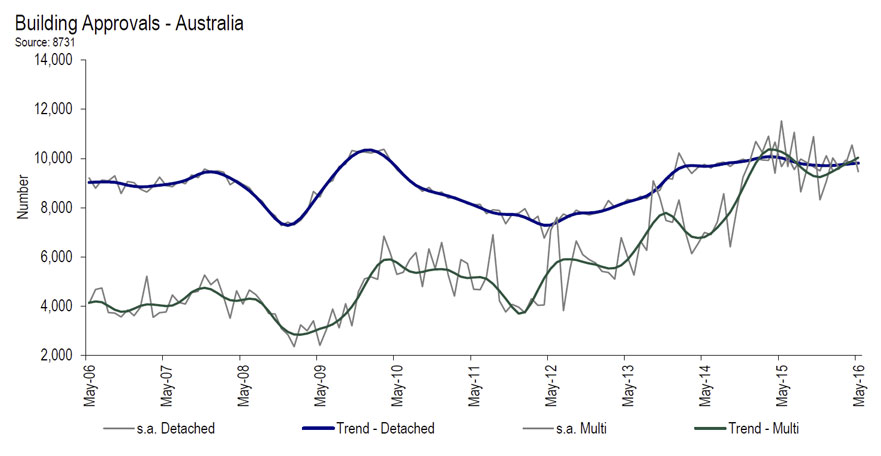
ABS figures show that new home building approvals faltered during the first month of 2016, said the Housing Industry Association (HIA). “January 2016 was a rather weak month for new home building approvals, with both detached house approvals and those for multi-units falling back compared with December,” noted HIA Senior Economist
Shane Garrett.

HIA---New-Homes-January-2016During January 2016, new home building approvals declined by 7.5 per cent. This comprised a 6.1 per cent drop in detached house approvals and a reduction of some 9.1 per cent in multi-unit approvals. Over the past year, approvals totalled some 231,752 which is 10.6 per cent higher than the previous 12 month period and still very strong by historical standards. “Towards the end of 2015, the residential building industry was hit by a number of unfavourable developments. The major banks increased their mortgage interest rates, credit conditions were tightened for domestic investors and the $5,000 foreign investor fee came into force. This has made it more difficult to deliver new housing supply and today’s figures seem to bear this out,” Shane Garrett pointed out.

During January 2016, total seasonally adjusted new home building approvals saw the largest increase in South Australia (+14.2 per cent), followed by Western Australia (+7.2 per cent) and Victoria (+2.9 per cent). The volume of approvals fell in New South Wales (-22.9 per cent), Queensland (-13.4 per cent) and Tasmania (-11.1 per cent). In trend terms, approvals saw a 9.4 per cent decline in the Northern Territory and contracted by 11.4 per cent in the Australian Capital Territory.

Construction Momentum Continues, In Places

The preliminary ABS data on construction work done, released today to December shows that the trend estimate for total construction work done fell 1.6% in the December quarter 2015 whilst the the seasonally adjusted estimate for total construction work done fell 3.6% to $48,413.4m in the December quarter.

However, the trend estimate for total building work done rose 1.0% in the December quarter, with non-residential building work done rising 0.3% and residential building work up 1.4%. The seasonally adjusted estimate of total building work done rose 2.7% to $24,990.2m in the December quarter.

Construction-Work-Dec-2015In contrast, the trend estimate for engineering work done fell 3.9% in the December quarter and the seasonally adjusted estimate for engineering work done fell 9.5% to $23,423.3m in the December quarter. So growth continues to rely on the housing sector.

The state by state data on residential construction (original data, so no smoothing) shows some significant movements.

Resi-Const-Dec-2015---StatesIn NSW, total new residential construction rose 0.21%, whilst VIC rose 0.28%. Both states are suggesting slowing momentum. This is in contrast to QLD which has shown growth of more than 10% the past two quarters. SA dropped 6.5% (reversed the 4.9% movement in the prior quarter) whilst WA fell 5%, the first fall since 2013.

Resi-Q-By-Q-Dec-2015Data from TAS, NT and ACT are more volatile so probably less significant, with NT falling 19.7% (after a 10% rise last time), ACT 5.6% (the fifth consecutive quarterly fall)  and TAS rising 3.5%.

Unemployment Wobbles In January

The latest data from the ABS on employment trends continues to show a level of unpredictability. Whilst most analysts were expecting no change, the seasonally adjusted rate rose to 6%, up from 5.8%, whilst the trend smoothed data read 5.8% down from 5.9% in December. So you can spin the story either way…. though I expect most will select the lower results contained in the seasonally adjusted series. We prefer to follow the trend data which irons out some of the random movements which the current method creates.

Emp-Jan-2016Indeed, the ABS tell us that their  estimates are based on a sample survey. Published estimates and movements are subject to sampling variability. Standard errors give a measure of sampling variability. The interval bounded by two standard errors is the 95% confidence interval, which provides a way of looking at the variability inherent in estimates. There is a 95% chance that the true value of the estimate lies within that interval.

In other words, it is not clear if the small movements are significant. We suspect not. However the apparent miss may trouble the market.

The ABS tell us that in trend terms employment increased 19,800 to 11,909,900 in the month, unemployment decreased 4,400 to 739,400, unemployment rate decreased less than 0.1 pts to 5.8%, based on unrounded estimates, participation rate remained steady at 65.2% and monthly hours worked in all jobs increased 3.6 million hours to 1,652.7 million hours.

In seasonally adjusted terms, employment decreased 7,900 to 11,894,500 in the month, full-time employment decreased 40,600 to 8,185,800 and part-time employment increased 32,700 to 3,708,700,unemployment increased 30,200 to 761,400, the number of unemployed persons looking for full-time work increased 25,600 to 544,100 and the number of unemployed persons only looking for part-time work increased 4,600 to 217,300. The unemployment rate increased 0.2 pts to 6.0%, participation rate remained steady at 65.2%. and monthly hours worked in all jobs increased 10.9 million hours to 1,656.0 million hours.

Lending Finance To Dec 2015 Shows Business Loans Up Ex. Investment Housing

The ABS data to December 2015 of total lending by category shows that the total flow value of owner occupied housing commitments excluding alterations and additions rose 1.3% in trend terms (to $21.9 bn), and the seasonally adjusted series rose 0.9%.

The trend series for the value of total personal finance commitments fell 0.7% (to $6.9 bn). Fixed lending commitments fell 1.0% and revolving credit commitments fell 0.3%. The seasonally adjusted series for the value of total personal finance commitments rose 2.1%. Fixed lending commitments rose 2.6% and revolving credit commitments rose 1.5%.

The trend series for the value of total commercial finance commitments fell 0.3% (to $44.1 bn). Revolving credit commitments rose 2.4%, while Fixed lending commitments fell 1.2%. The seasonally adjusted series for the value of total commercial finance commitments fell 7.3%. Revolving credit commitments fell 18.3% and fixed lending commitments fell 3.3%.

The trend series for the value of total lease finance commitments rose 0.1% in December 2015 (to $602m) and the seasonally adjusted series rose 1.7%, after a fall of 3.8% in November 2015.

All-Lending-Trends-Dec-2015Commercial finance includes lending to individuals and other for investment property purchase. We see that lending for investment property purchase slid to 15% of all lending in December, having reached a high of nearly 20% in late 2014. In addition, the proportion of commercial lending which related to investment property purchase fell to 25% of all commercial lending, having reached a peak of 31.4% in late 2014.

However, bearing in mind total commercial lending fell in the month, we see that owner occupied lending is now growing considerably faster (1.3%), compared with investment lending (down 2.4% and $11.4 bn) and commercial lending in aggregate is down 0.34%, but the non-investment housing segment rose 0.38% (to $32.7 bn).

If investment lending continues to slow, this will put more pressure on commercial lending growth, or create space for other lending to business, depending on your point of view. Or will the banks simply continue to chase owner occupied refinancing, the easy option? That said, lending to business ex. investment housing did grow, if but a little in the month. We need much stronger movement here to drive productive growth.

OO Housing Finance Bounces Back – Refinance Anyone?

The latest ABS data to December 2015 shows that in the month, trend owner occupied lending grew 1.3%, seasonally adjusted, with $21.3 bn of loans being written.  Construction loans grew 1.4% ($1.9 bn), purchase of new dwellings grew 1.7% ($1.3bn) and purchase of established dwellings by 1.28% ($18.75bn). Refinance continued to grow, with 33% of loans written in the month churned, up 2.3% to $7.29bn.  Overall owner occupied lending, net of refinance grew just 0.8%.

OO-Trends-Dec-2015Looking at state trends, VIC led the way, up 1.5%, QLD at 1%, NSW at 0.7%, SA 0.6%, and WA down 0.3%. But startlingly, TAS reported a rise of 1.8% and NT a rise of 1.4%. The ACT was 1.6% higher. So, WA apart, owner occupied lending grew in every state.

State-Trend-Change-Dec-2015Total finance, including investment loans grew by just 0.025%, investment loans fell 2.36% to 11.4 bn. We see the clear focus of lending is to owner occupied borrowers, and a massive focus on churning loans. We also see a significant rise in the number of fixed rate deals, as households lock in low rates, with the number of deals up 17.2%, whilst secured revolving loans fell 9.8%. This reflects the cheap loan special offers which are currently in the market.

Trend-Flow-Dec-2015First time buyer OO loans grew in December, with a rise of 4.6% on the previous month to make up 15.1% of new loans. This is faster than for non-first time buyer loans, here the number of loans grew 3.1%. The average loan size fell a little in the month, reflecting tighter lending criteria. This is original data, not trend smoothed.

FTB-Orignal-Dec-2015Overlaying first time investors, from our surveys, overall first time buyers were more active, still wanting to get on the property ladder one way or the other. FTB investors grew by 6.5% in the month, after a couple of slow months before. Overall, about 14,000 first time buyer deals were done.

FTB-All-Dec-2015