Retail Trade Flat In December – ABS

The latest Australian Bureau of Statistics (ABS) Retail Trade figures show that Australian retail turnover was relatively unchanged (0.0 per cent) in December 2015, following a rise of 0.4 per cent in November 2015, seasonally adjusted.

In seasonally adjusted terms there were rises in food retailing (0.8 per cent), clothing, footwear and personal accessory retailing (1.1 per cent) and department stores (0.1 per cent). Household goods retailing (-1.0 per cent), other retailing (-0.9 per cent) and cafes, restaurants and takeaway food services (-0.5 per cent) fell in December 2015.

The fall in household goods retailing was the largest of any industry in December. This fall follows large rises in recent months which have contributed significantly to stronger rises in total retail turnover. Despite the fall in December this industry maintains the strongest growth rate of any industry compared to this time last year, rising 6.3 per cent compared to December 2014.

In seasonally adjusted terms, there were rises in the Australian Capital Territory (2.4 per cent), Queensland (0.2 per cent), New South Wales (0.1 per cent), South Australia (0.2 per cent) and the Northern Territory (0.3 per cent). There were falls in Western Australia (-0.6 per cent), Victoria (-0.1 per cent) and Tasmania (-0.6 per cent).

The trend estimate for Australian retail turnover rose 0.3 per cent in December 2015, following a 0.3 per cent rise in November 2015. Compared to December 2014 the trend estimate rose 4.0 per cent.

Online retail turnover contributed 3.0 per cent to total retail turnover in original terms.

In seasonally adjusted volume terms, turnover rose 0.6 per cent in the December quarter 2015, following a rise of 0.5 per cent in the September quarter 2015. The largest contributor to the rise was Household goods retailing which rose 2.5 per cent in seasonally adjusted volume terms in December quarter 2015.

Living Costs Growth Highest For Self-Funded Retirees

The ABS published their data on living costs by household type today, to December 2015. It is worth reading the ABS information about these indices:

The Analytical Living Cost Indexes (ALCIs) have been compiled and published by the ABS since June 2000 and were developed in recognition of the widespread interest in the extent to which the impact of price change varies across different groups of households in the Australian population.

ALCIs are prepared for four types of Australian households:

  • employee households (i.e. those households whose principal source of income is from wages and salaries);
  • age pensioner households (i.e. those households whose principal source of income is the age pension or veterans affairs pension);
  • other government transfer recipient households (i.e. those households whose principal source of income is a government pension or benefit other than the age pension or veterans affairs pension); and
  • self-funded retiree households (i.e. those households whose principal source of income is superannuation or property income and where the Household Expenditure Survey (HES) defined reference person is ‘retired’ (not in the labour force and over 55 years of age)).

A living cost index reflects changes over time in the purchasing power of the after-tax incomes of households. It measures the impact of changes in prices on the out-of-pocket expenses incurred by households to gain access to a fixed basket of consumer goods and services. The Australian Consumer Price Index (CPI), on the other hand, is designed to measure price inflation for the household sector as a whole and is not the conceptually ideal measure for assessing the changes in the purchasing power of the disposable incomes of households.

Looking at the data, we see that whilst the living costs have fallen through 2015, they are now on the rise, and self-funded retirees have the higher cost growth rate.

Segment-Costs-of-Living-Dec-2015

There are subtle differences in spending patterns and household mix which contribute to the differences. For example, self-funded retirees spend less on housing, but more on health care and recreation activities.

Table 1 from the ABS,  illustrates significant differences in expenditures, both in total and at the individual commodity group level across the household types. Although differences in incomes are likely to be a major reason for this, other factors such as the demographic make-up of the households and dwelling tenure would also play a part. For example, age pensioner households have on average the lowest number of persons per household and self-funded retiree households have a higher than average rate of outright home ownership.

Table 1: Estimated average weekly expenditure during 2009-10, Household type by Commodity group(a)(b)

PBLCI
Employee
Age pensioner
Other government transfer recipient
Self-funded retiree
CPI
Commodity group
$
$
$
$
$
$

Food and non-alcoholic beverages
135.92
262.48
120.72
150.86
176.66
230.87
Alcohol and tobacco
56.19
114.63
36.12
75.92
68.16
96.87
Clothing and footwear
32.27
64.39
26.31
38.12
43.29
54.58
Housing(c)
135.91
205.32
92.43
178.64
113.89
305.75
Furnishings, household equipment and services
60.00
142.82
59.81
60.20
119.83
124.79
Health
35.91
80.73
47.69
24.32
87.22
72.56
Transport
63.26
182.25
50.65
75.65
118.13
158.39
Communication
26.26
46.45
19.80
32.62
31.84
41.81
Recreation and culture
67.90
194.82
61.91
73.79
215.24
172.30
Education
10.07
45.13
1.54
18.45
9.06
43.67
Insurance and financial services(d)
37.44
218.75
22.19
52.42
39.40
69.71
All groups
661.13
1 557.77
539.17
780.99
1 022.72
1 371.30

(a) Based on 2009-10 Household Expenditure Survey (HES) at June quarter 2011 prices.
(b) Figures may not add up due to rounding.
(c) House purchases are included in the CPI but excluded from the population subgroup indexes.
(d) Includes interest charges and general insurance. Interest charges are excluded from the CPI and general insurance is calculated on a different basis.

Dwelling Approvals Fall For The Eighth Month Straight

Australian Bureau of Statistics (ABS) Building Approvals show that the number of dwellings approved fell 0.1 per cent in December 2015, in trend terms, and has fallen for eight consecutive months. Building-Approvals-To-Dec-2015
Dwelling approvals decreased in December in the Australian Capital Territory (21.9 per cent), Western Australia (3.1 per cent), Tasmania (0.8 per cent), New South Wales (0.4 per cent) and South Australia (0.4 per cent) but increased in the Northern Territory (1.8 per cent), Victoria (1.6 per cent) and Queensland (1.1 per cent) in trend terms.

In trend terms, approvals for private sector dwellings excluding houses fell 0.1 per cent in December. In contrast, approvals for private sector houses rose 0.1 per cent. Private sector house approvals rose in Queensland (0.8 per cent), Victoria (0.7 per cent) and South Australia (0.5 per cent) but fell in Western Australia (1.8 per cent) and New South Wales (0.2 per cent) in trend terms.

The seasonally adjusted estimate for dwelling approvals rose 9.2 per cent in December following a 12.4 per cent fall in November. The rise in December was driven by dwellings excluding houses (13.5 per cent). The largest state contribution to the rise in total dwellings in December came from Victoria (37.4 per cent).

The value of total building approved rose 0.2 per cent in December, in trend terms, after falling for four consecutive months. The value of residential building rose 0.1 per cent while non-residential building rose 0.4 per cent.

Building-Value-To-December-2015

CPI December quarter 2015 rises 0.4 per cent

The latest Australian Bureau of Statistics (ABS) figures show the Consumer Price Index (CPI) rose 0.4 per cent in the December quarter 2015, following a rise of 0.5 per cent in the September quarter 2015.

The most significant price rises this quarter were in tobacco (+7.4 per cent), domestic holiday travel and accommodation (+5.9 per cent) and international holiday travel and accommodation (+2.4 per cent). These rises were partially offset by falls in automotive fuel (–5.7 per cent), telecommunication equipment and services (–2.4 per cent) and fruit (–2.6 per cent).

The increase of 0.1 per cent for the housing group is the weakest movement since March quarter 1998 as price rises for rents (+0.2 per cent) and new dwelling purchase by owner occupiers (+0.1 per cent) have been subdued through the quarter. The 0.1 per cent rise for new dwellings purchase by owner occupiers is the weakest movement since March quarter 2014.

The CPI rose 1.7 per cent through the year to the December quarter 2015, following a rise of 1.5 per cent through the year to the September quarter 2015.

FactCheck: is job growth in Australia the greatest it’s been since 2006?

From The Conversation.

If you look at the latest unemployment numbers down to 5.8%, we have seen extremely strong job growth, over 300,000 jobs in the last year and that’s the greatest level of job growth since 2006. So I am very confident in the strength of our economy overall. – Josh Frydenberg, Minister for Resources, Energy and Northern Australia, interview with Fran Kelly on Radio National Breakfast, January 18, 2016.

With shakes in the global stock market and uncertainty abroad, politicians are understandably keen to reassure voters that Australia’s economic fundamentals are strong.

Employment data produced by the Australian Bureau of Statistics (ABS) is one way we can test Australia’s economic waters, and resources and energy minister Josh Frydenberg said recently that the latest employment figures show extremely strong job growth.

Is he right?

Checking the numbers

The ABS’ December Labour Force survey release showed that over the course of 2015, total employment was up by 301,300 people (adjusted for regular seasonal fluctuations and rounded to closest 100 people). Of those 301,300 jobs, the majority (187,200) were full time.

In the last three months of 2015, growth compared to same time the previous year has fluctuated between 2.6% and 3%. That’s above the average annual growth in employment since 2000 of around 1.9%. In short, employment growth recently has been strong.

Is it the greatest level of job growth since 2006?

Table 1 of the release shows that this growth is indeed the strongest of any calendar year since 2006.

Employment-Fact1However, one could also look at changes over the 12 months to any month. Doing that, you could say, for example, that November 2010 with a figure of around 314,300 had a stronger level of job growth than the latest employment figure show. It was also stronger in November of 2015, when it was at about 344,900.

In other words, if you look only at changes for calendar years (between the beginning and the end of any given year), Frydenberg is right to say it’s the greatest level of job growth since 2006.

That said, comparing the recent data to particular points in the past is less important than what the data tell us about the current trends in the labour market.

Trends

While the ABS devotes considerable resources to undertaking the survey, it is worth remembering that published employment growth is an estimate. The survey is only a sample of the population. The ABS reports on page 40 of its release that the standard error of monthly employment growth is 29,300 people, so, while employment growth recently has been strong, considerable uncertainty surrounds the numbers.

More generally, monthly movements in these data are volatile. For example, in December employment actually fell marginally, although this followed two months of strong growth and therefore was still a good outcome.

Due to this volatility in the monthly series, the ABS’ trend series may provide a better guide about the extent to which recent growth is likely to persist in the future.

Over the last three months of 2015, growth in trend employment averaged around 30,300 people, compared to 43,000 based on the data adjusted only for regular seasonal fluctuations.

In other words, the data show us that the underlying trends in the job market recently have been pretty good.

Other, unofficial, data point to an improvement in the labour market. The December 2015 ANZ Job Advertisement Index showed growth compared to the same time in 2014 in their trend estimate at 11.4%, compared to around 10% in the middle of 2015.

The unemployment rate

The unemployment rate, which is also produced by the ABS in the labour force survey, has improved over the last three months. At 5.8%, it is down from 6.2%, where it had fluctuated around since mid 2014 (see Table 1 of the release). Similarly, the trend unemployment rate has also improved and in December reached 5.8%.

Unemployment-Fact2Is 5.8% a good outcome for the unemployment rate? A simple benchmark is that average unemployment in Australia since 2000 is 5.5% – so it’s still currently a little above average.

Another way to judge the level of the unemployment rate is to look at developments in wages. If the unemployment rate was too low, growth in private sector wages would pick up. However, in the September quarter (which predates the recent drop in the unemployment rate) wages growth was soft.

To put Australian unemployment in a global context, the average unemployment rate of the Organisation for Economic Co-operation and Development (OECD) nations was 6.6% in November 2015. However, we need to caveat this comparison. Many countries, such as some in Europe, have unemployment rates that are, on average, higher than Australia’s, reflecting the different structure of their labour markets.

Australia’s unemployment rate has shifted down and that has persisted for three months, which gives greater confidence that it might not be temporary. However, given the volatility of these data and the uncertainty presently surrounding the outlook for the global economy it will be important to see whether these gains are maintained in coming months.

Verdict

Josh Frydenberg was right. Employment growth in 2015 was the strongest of any calendar year since 2006, although comparable growth also occurred over the 12 months to November 2010. It is also fair to say Australia has recently experienced strong jobs growth. – Tim Robinson


Review

This FactCheck is excellent in its comprehensive review and interpretation of the Labour Force Survey data. It is pointed out that labour market statistics, such as the unemployment rate and the number of people employed, are only estimates not the actual numbers in the population.

The statistics are based on the Labour Force Survey, which is a sample of 0.33% of the population about the employment status of everyone in the household aged 15 years and older. Because they are based on a sample of the population, the statistics have errors. In its monthly report the ABS publishes these “sampling errors” and clearly says that the estimate of the monthly change in the employment has a “95% confidence interval”. The media and the government rarely, if ever, report the range of estimates.

It is well known among economists that “you don’t trust one month’s figures” – the trend in labour force statistics is what’s important in understanding what’s going on in the labour market.

This FactCheck does a good job of explaining that the ABS “trend estimates” are much more reliable than the actual raw estimates. Again, the media (and politicians, when it suits them) tend to concentrate on the actual number, particularly whether it has risen or fallen. As the author also pointed out, the start and end date of the change usually makes a difference to the estimate of the change.

As the above states, although the minister’s assertion can be questioned somewhat by adopting a different start and end date, the overall conclusion that jobs growth is reasonably strong is correct. – Phil Lewis

Residential Construction Surges to Fresh Record

The latest ABS housing figures show new dwelling commencements reached a fresh high in the September 2015 quarter. The trend estimate of the value of new residential building work done rose 1.2% in the September quarter. The value of work done on new houses fell 0.4% while new other residential building rose 3.5%. The seasonally adjusted estimate of the value of new residential building work done rose 1.8% to $13,554.8m. Work done on new houses rose 0.1% to $7,779.6m, while new other residential building rose 4.2% to $5,775.2m.

The HIA goes to town on the back of the latest seasonally adjusted data:

Building-Sep-Q-2015-HIA

“Today’s update for national new home building is a stellar result not only for the residential construction industry, but for the wider economy,” said HIA Chief Economist, Dr Harley Dale. “New dwelling commencements hit a quarterly record level of 55,532 in the September quarter last year. The historical high of 215,329 commencements for the year to September 2015 is 15 per cent above the previous peak of just over 187,000 ‘starts’ in 1994.”

“Over recent years households and businesses have faced a barrage of negative chatter about below trend growth and downside risks to the economic outlook,” noted Harley Dale. “Throughout this time new home construction has posted one of its longest upcycles in history – providing substantial support to Australia’s economic output and levels of employment.”

“In a federal election year where there is a focus on options for economic and taxation reform, the new housing sector needs to be front and centre,” commented Harley Dale. “We need a visionary outlook regarding the homes Australia has to build over the coming decades to house its growing and ageing population, while not forgetting to celebrate the fact that new home construction and its massive spin-off benefits has propped up the Australian economy at a time when no other sector has come to the party.”

“As has been the case throughout the current cycle, the profile for national dwelling commencements masks large regional differences. In the September 2015 quarter new dwelling commencements increased in New South Wales (+2.4 per cent), Western Australia (1.7 per cent), South Australia (+1.2 per cent), the Northern Territory(+17.4 per cent), and the Australian Capital Territory (+0.4 per cent). Commencements fell in Queensland (-1.0 per cent), Victoria (-3.8 per cent) and Tasmania (-20.7 per cent).

Strong Home Lending Continued In November

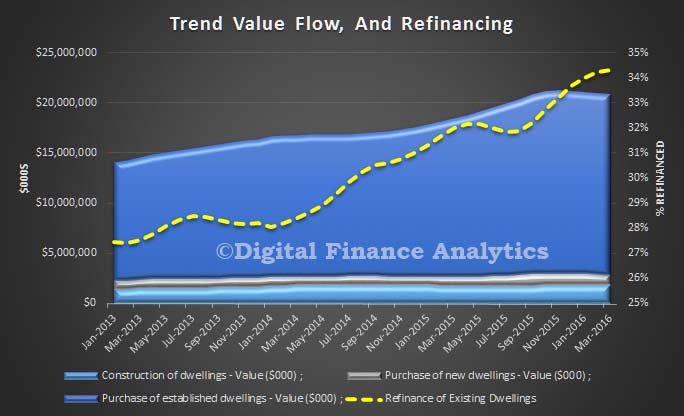
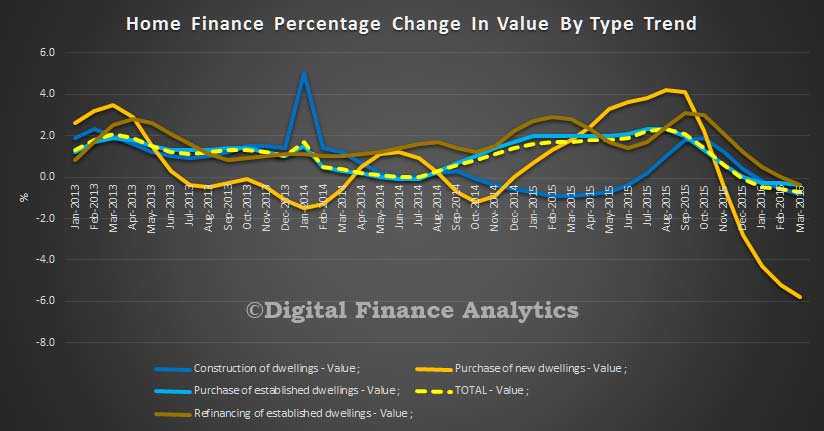
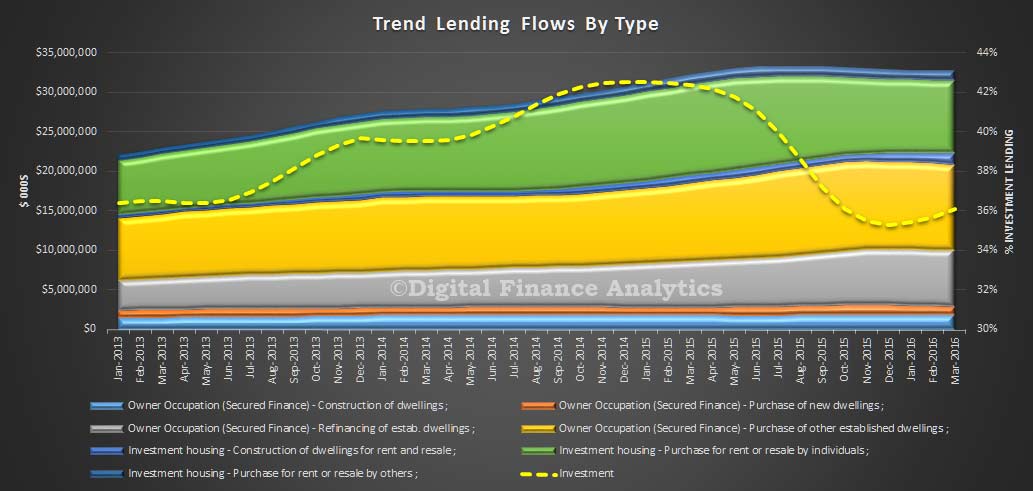
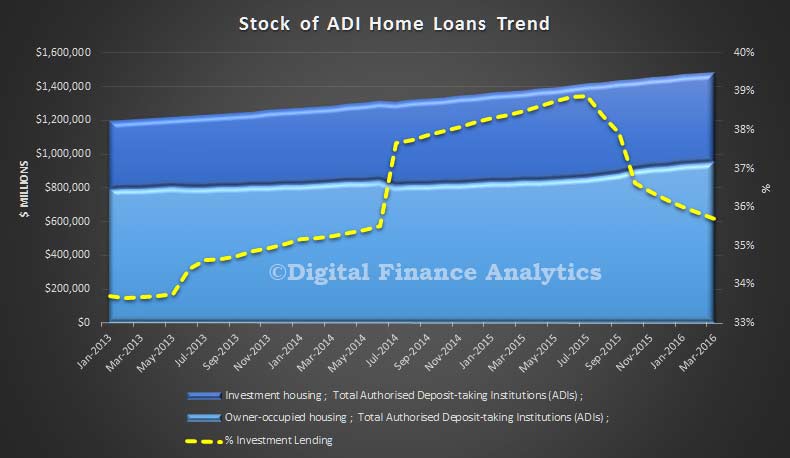
The latest ABS data, on home lending, released today, continues to confirms the strong growth which was reported in the stock data already released by APRA and RBA. The more granular flow data for November shows that owner occupied lending grew by 1.7% from October to $21.6 billion, whilst investment lending fell 2.9% to $11.6 billion. Refinancing accounted for more than 21% of all loans, whilst investment loans fell to 44.3% of new loans (still a big number, but below the 50% peak we saw in early 2015).

Ref-and-Inv-Flows-PC-Nov-2015-We note that by value, loans for construction rose 1.8% ($1.83 bn), whilst purchase of new dwellings lifted 1.6% ($1.24 bn)  and purchase of existing dwellings rose 1.7% to $18.6 bn.

OO-Houisng-Nov-2015Refinanced loans rose 2.3% to $7.0 billion, and confirms the current focus of lenders trying to get existing borrowers to switch.

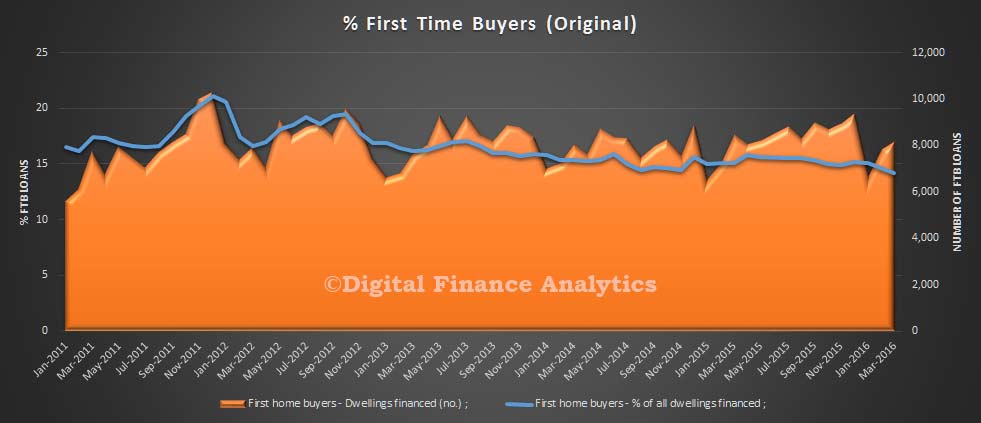
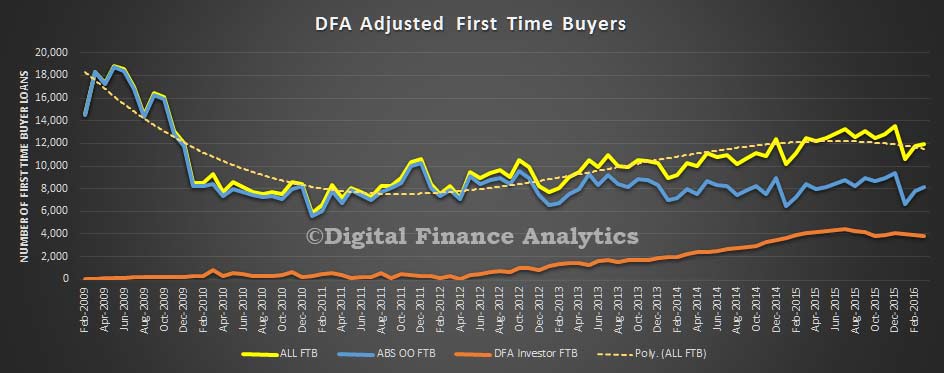
All-Housing-Flows-Nov-2015Looking at first time buyers, there was a 3.37% lift in the number of owner occupied borrowers (8,945) but there was a small fall in the relative proportion of borrowers, with first time buyers sitting at 14.9% (down 0.1%). Using data from our surveys, we overlay the first time buyers going direct to the investment sector, we see an additional 3,778 purchasers, down 1.3% from last month. Overall then, first time buyers are still active, despite high prices.

FTB-Nov-2015FTB-Tracker-Nov-2015Turning to the state changes, we see that momentum is slowing in NSW, thanks to falls in investment lending, but VIC is growing still, along with ACT and NT. Growth in QLD and WA is slower down 0.3% and 0.4% respectively.  Looking specifically at new home lending to owner occupiers, most were higher with NSW up 9.7%, VIC 8.2%, QLD 2.3% and SA 6.3%. Significantly though new home lending to owner occupiers was lower in Western Australia down 15.9% and Tasmania down 10.7%.

State-Change-Nov-2015Finally, it is worth noting that we have seen momentum in the wholesale lending sector (up 3.8%), and non-bank sectors (up 0.9%), whilst the banks have seen growth slowing slightly at around 1.8%. Building Societies appears to be performing less well, although there is a small improvement, with a fall of 4.3%.

Lender-Change-Nov-2015 Standing back, momentum across the sector continues, and given that demand for property remains strong (especially in the light of recent stock market volatility) we expect lending to continue to move higher – indeed we have seen a number of lenders reduce their rates for new owner occupied and lending business, in an attempt to gain share.  The property story is far from over, despite some falls in prices.

Employment Trend Improves Again … But

The latest ABS data to December 2015 shows that trend employment increased to 11,893,800, unemployment decreased to 734,300, the unemployment rate decreased 0.1 pts to 5.8% and the participation rate increased less than 0.1 pts to 65.2%. But let’s not cheer – yet!

Employment-Dec-2015Their media release says that the strong trend growth in employment has continued.

“The trend shows that around 312,000 more people were employed in December 2015 than in December 2014. Full-time employment growth was stronger than part-time over the year, increasing by 186,600 people,” said Bruce Hockman, General Manager of ABS’ Macroeconomic Statistics Division.

The increase in employment has contributed to the trend employment to population ratio rising over the year from 60.6 per cent to 61.4 per cent, while the unemployment rate has decreased over the year from 6.2 per cent to 5.8 per cent.

Over the past month, trend employment increased by 27,500 persons to 11,893,800 persons, which translates into a monthly growth rate of 0.23 per cent. This growth rate was above the monthly average over the past 20 years (0.15 per cent), and continues the trend in relatively strong employment growth that has been seen since December 2014.

The trend series smooth the more volatile seasonally adjusted estimates and provide the best measure of the underlying behaviour of the labour market.

The seasonally adjusted unemployment rate for December 2015 was 5.8 per cent (down 0.1 percentage points, based on unrounded estimates) and the labour force participation rate was 65.1 per cent (down 0.1 percentage points, based on unrounded estimates).

The seasonally adjusted number of persons employed was virtually unchanged in December 2015, while the number of persons unemployed decreased by 10,900.

The ABS seasonally adjusted monthly hours worked in all jobs series was relatively unchanged at 1,645.2 million hours, the ABS reported.

Two points. First the reliability of the revised methodology still remains in doubt, and we continue to see a rotation towards lower-services roles (e.g. healthcare) and away from economically productive roles. We think the underlying economic issues are being masked by the good top-line result.  And for perspective we are still seeing unemployment among younger Australians horribly higher (above 12%), and the overall rate is still above 5.4% which is where it was in January 2013.

Young-Unemployment-Dec-2015Finally the state data shows falls in NSW, VIC, and QLD, but rises in WA, TAS, and ACT.

State-Umenployment-Dec-2015


Retail Turnover Up 0.4% In November

The latest Australian Bureau of Statistics (ABS) Retail Trade figures show that Australian retail turnover rose 0.4 per cent in November 2015 following a rise of 0.6 per cent in October 2015, seasonally adjusted.

There were rises in household goods retailing (0.9 per cent), cafes, restaurants and takeaway food services (1.0 per cent), food retailing (0.2 per cent), clothing, footwear and personal accessory retailing (0.8 per cent) and other retailing (0.4 per cent). There was a fall in department stores (-0.8 per cent).

There were rises in all states and territories in November. The largest contribution to the overall rise came from Queensland (0.8 per cent) followed by Victoria (0.5 per cent), New South Wales (0.2 per cent), Western Australia (0.3 per cent), South Australia (0.4 per cent), the Australian Capital Territory (0.9 per cent), Tasmania (0.3 per cent) and the Northern Territory (0.4 per cent).

The trend estimate for Australian retail turnover rose 0.4 per cent in November 2015 following a 0.4 per cent rise in October 2015. The trend estimate rose 4.1 per cent compared to November 2014.

In original terms, online retail turnover accounted for 3.3 per cent of total retail turnover.

Building Approvals Down In November 2015

Australian Bureau of Statistics (ABS) Building Approvals show that the number of dwellings approved fell 1.9 per cent in November 2015, in trend terms, and has fallen for eight consecutive months.

Units-Approved-Nov-2015Dwelling approvals decreased in November in Australian Capital Territory (-9.3 per cent), Western Australia (-4.5 per cent), New South Wales (-2.8 per cent), Tasmania (-2.6 per cent), Victoria (-2.4 per cent) and Northern Territory (-0.6 per cent) but increased in South Australia (3.2 per cent) and Queensland (0.9 per cent) in trend terms.

In trend terms, approvals for private sector houses was flat in November. Private sector house approvals fell in Western Australia (-2.2 per cent) and New South Wales (-0.5 per cent) but rose in South Australia (1.9 per cent), Victoria (1.3 per cent) and Queensland (0.1 per cent).

The value of total building approved fell 0.8 per cent in November, in trend terms, and has fallen for four consecutive months. The value of residential building fell 1.2 per cent while non-residential building was flat.

Value-Building-Work-Nov-2015