Residential Real Estate Valued At Nearly $6 trillion

The latest ABS data on capital city property prices was released today.  The total value of residential dwellings in Australia was $5,859,824.6m at the end of September quarter 2015, rising $137,125.0m over the quarter. The mean price of residential dwellings rose $11,900 to $612,200 and the number of residential dwellings rose by 38,600 to 9,572,400 in the September quarter 2015.

The price index for residential properties for the weighted average of the eight capital cities rose 2.0% in the September quarter 2015. The index rose 10.7% through the year to the September quarter 2015.

The capital city residential property price indexes rose in Sydney (+3.1%), Melbourne (+2.9%), Brisbane (+1.3%), Adelaide (+1.2%), Canberra (+1.3%) and Hobart (+0.5) and fell in Perth (-2.4%) and Darwin (-0.4%).

Annually, residential property prices rose in Sydney (+19.9%), Melbourne (+9.9%), Canberra (+4.0%), Brisbane (+3.8%), Adelaide (+3.5%) and Hobart (+1.7%) and fell in Perth (-3.3%) and Darwin (-2.0%).

House-Prices-Sept-2015

Lending Finance Shows NSW Investment Property Momentum Falling

The last piece of the finance data, from the ABS shows lending finance for October 2015. Two things of note (despite the noise in the data, as we have already discussed), first, investment housing lending is on the slide (down 3%), offset by a rise in owner occupied lending (up 2%), so overall lending for housing contained to rise a little. Second lending for business rose (up 1.3%). Investment loans were down to 36% of all housing, and lending for commercial (other than for property investment) rose from 43.8 to 44.2%.

All-Lending-Oct-2015Data for NSW, which is original data (no adjustments for trend or seasonality), showed a 5% rise in construction finance for investors, offset by a 33% fall in investment for existing property.  From this, it looks like the investment property party may just be over.

Oct-2015--NSW-Inv

Unemployment Rate Trend Remains At 6%

According to the ABS, November 2015 data  shows that an increase in employment has contributed to the trend employment to population ratio rising over the year from 60.6 per cent to 61.3 per cent, while the unemployment rate has remained relatively stable over the year, decreasing from 6.2 per cent to 6.0 per cent.

Unemployment-Rate-Nov-2015The ABS reported that strong growth in employment has continued with 293,000 more people were employed in November 2015 than in November 2014; an increase of 2.5 per cent.

Over the past month, trend employment increased by 25,300 persons to 11,855,800 persons, which translates into a monthly growth rate of 0.21 per cent. This growth rate was above the monthly average over the past 20 years (0.15 per cent), and continues the trend in relatively strong employment growth that has been seen since December 2014.

The trend series smooth the more volatile seasonally adjusted estimates and provide the best measure of the underlying behaviour of the labour market.

The seasonally adjusted unemployment rate for November 2015 was 5.8 per cent (down 0.1 percentage points) and the labour force participation rate was 65.3 per cent (up 0.3 percentage points).

The seasonally adjusted number of persons employed increased by 71,400 in November 2015, while the number of persons unemployed decreased by 2,800.

The ABS seasonally adjusted monthly hours worked in all jobs series decreased slightly in November 2015, down 12.7 million hours (0.8 per cent) to 1,645.9 million hours, the ABS reported.

Latest Housing Finance Data Shows Market Is Turning But Still Rising

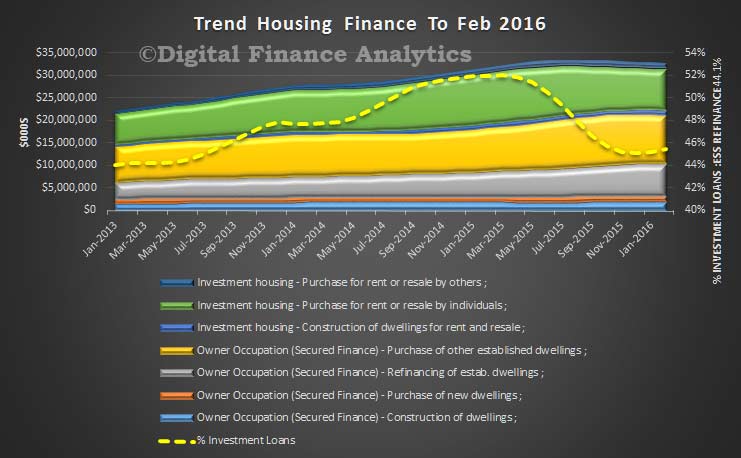
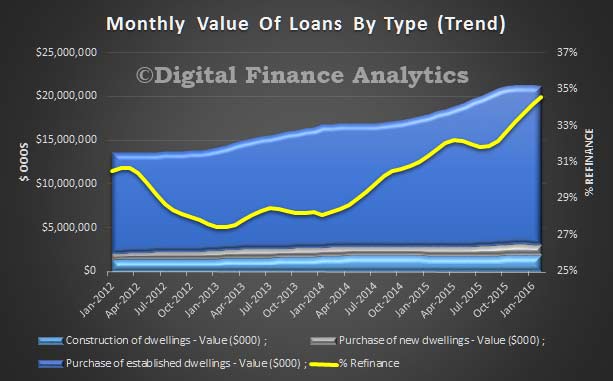
The latest data from the ABS on housing finance for October 2015, continues to tell the story of the turning market, with investors slowing, and owner occupied loans still rising (and supported by growth in refinanced loans). It also contains a number of adjustments, so trends are hard to read.  But, do not be deceived, the market still has significant momentum, and overall volumes and values are still high.

Looking at the national monthly trend flows first, we see that in October total housing loans of $33.2 bn were written, up 0.04% from the previous month, or $12.9m. Note that significant home lending is still happening, though overall growth has slowed.

Within these numbers, $14.4bn owner occupied loans were written, a rise of 2.1%, or $291m; whilst $12.1bn of investment loans were written, down 3.1% or $386m. Refinancing grew 1.7%, of $109m and equated to $6.7bn in the month. Loans for new houses or for construction of new dwellings (across investment and OO), rose 0.5% to $3.8bn.

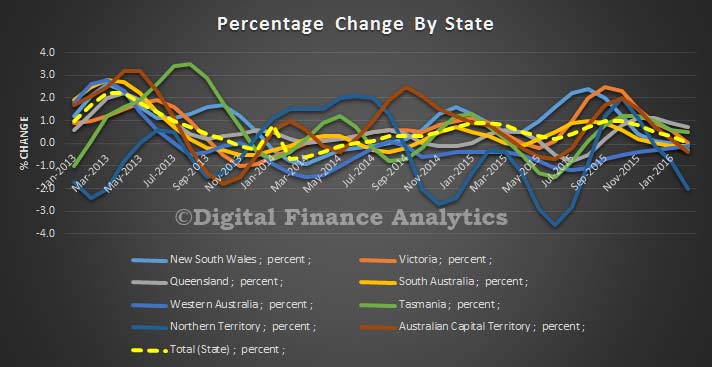
Housing-Oct-1Taking a longer, and state based view of  loans for new construction for owner occupation, there are significant variations. New home lending to owner occupiers increased by 7.8 per cent in New South Wales and was unchanged in the Norther Territory. In the other six states and territories, the number of loans to owner occupiers purchasing or constructing new homes decline in October 2015 when compared with October 2014: Tasmania (-28.6 per cent); Western Australia (-24.5 per cent); Australian Capital Territory (-20.9 per cent); Queensland (-9.2 per cent); Victoria (-6.0 per cent); and South Australia (-2.5 per cent).  Construction momentum is waning.

Of course, there is a whole load of noise in the data, with loan reclassifications so we need to treat the numbers with care, but the trend is clear now. These adjustments show clearly in the ADI stock trend data, which shows how the proportion of investment loans were adjusted up (thanks to the bank reclassifying loans to investment loans in the year from June 2014, and more recently households telling the banks their loans were NOT investment loans, see our earlier post on this, referring to the more reliable(?) RBA numbers. At a portfolio level, in original terms, ADI loans for all housing were up 0.53% to $1.44 trillion,  of which OO contributed $911bn, up 2.6% and investment loans $526bn, down 2.9%.

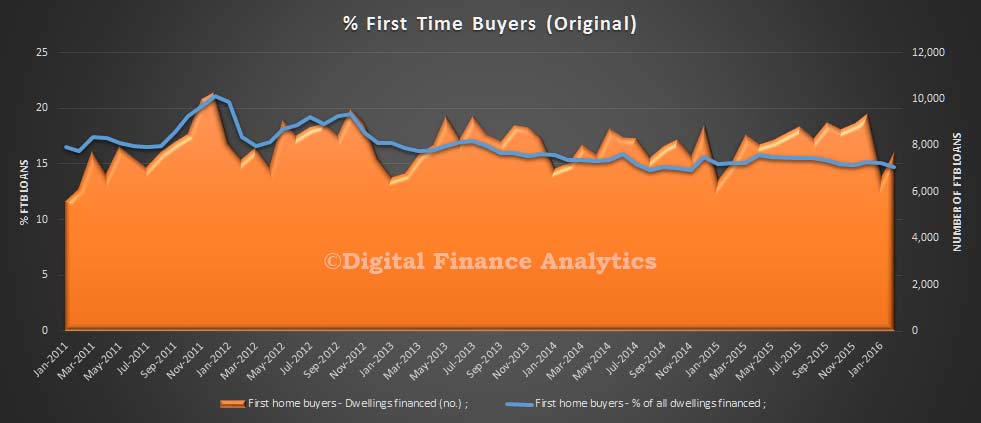
Housing-Stock-Oct-2015Turning to first time buyers, owner occupied loans fell 2.85%, making 15.1% of all new loans taken by first time buyers. The average FTB loan rose again from $351,800 last month to $355,700 this month. An astonishing rise, given flat incomes.

FTB-Oct-2015Finally, if we add back in the hidden first time buyers who are going direct to the investment sector (using data from the DFA surveys), we see that momentum here continues to weaken, with a fall of more than 7% is loans written this month, a fall from 4,147 in September to 3,835 in October.  Together first time buyer numbers fell 5.5%, from 13,100 to 12,534.

FTB-Adj-Oct-2015  To further muddy the waters, the ABS also made revisions:

In this issue revisions have been made to the original series as a result of improved reporting of survey and administrative data, and updated first home buyer modelled estimates. These revisions have impacted on:

  • First home buyers owner occupied housing for August 2015.
  • Investment housing for August 2015.
  • Housing loan outstandings to households; owner-occupied and investment housing: for periods from March 2014 to September 2015.

Monthly First Home Buyer statistics will be subject to future revision, as the modelled component is adjusted to reflect improved reporting by lenders.

Stronger New Dwelling Approvals in October

ABS figures released today show that building approvals increased by 3.9 per cent in October, the second consecutive month of growth, said the Housing Industry Association.

During October, total seasonally-adjusted new dwelling approvals rose to 19,652, the strongest monthly result since the all-time record high reached in July. The distribution of the growth was mixed, however; while multi-unit approvals increased by 10.1 per cent during October, detached house approvals fell by 2.1 per cent during the month. The back-to-back increases in approvals during September and October were the first consecutive monthly increases since the beginning of the year.

HIA-Approvals-October-2015During October 2015, total seasonally adjusted new home building approvals saw the largest increase in South Australia (+23.4 per cent), followed by New South Wales (+22.0 per cent) and Victoria (+21.2 per cent). Approvals fell in Tasmania (-41.6 per cent), Queensland (-28.7 per cent) and Western Australia (-1.1 per cent). In trend terms, approvals saw a 7.1 per cent increase in the NT but declined by 10.8 percent in the Australian Capital Territory.

Private Sector Wage Growth The Lowest On Record

According to the ABS, the seasonally adjusted Wage Price Index (WPI) rose 0.6 per cent in the September quarter 2015 and 2.3 per cent over the last year, according to figures released today. It is an all time record low for the Private sector, though Government servants are doing rather better. This data underscores the continued pressure on rentals from investment properties, because rentals are more linked to income than house prices.

In the September quarter 2015, Private sector wages grew 0.5 per cent and Public sector wages grew 0.7 per cent (seasonally adjusted).

Wage-TrendsPrivate sector seasonally adjusted wage growth of 2.1 per cent over the last year is the lowest rate of wages growth since the start of the WPI series. The through-the-year series was first published in September quarter 1998.

In the Public sector, wages grew 2.7 per cent over the last year.

In the September quarter, the largest rise (original series) of all industries is 1.6 per cent in Accommodation and food services. Finance and insurance services had the smallest rise of 0.2 per cent.

NSW Investment Property On The Slide

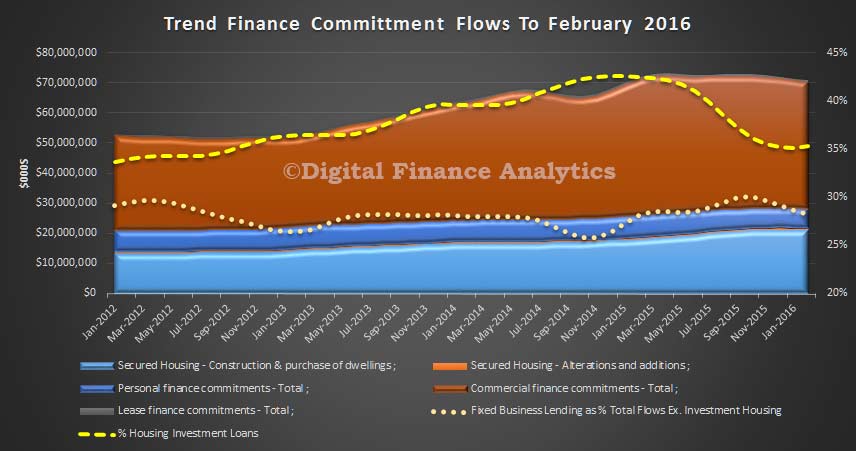
The data from the ABS today, provides a view of all finance for September, and contains a number of significant points.  Trend data (which irons out the noise month by month) shows that lending for owner occupied housing was $20.6 bn, up 2% from last month ($20.2 bn). Personal finance was down 1.1% from $7.3 bn to $7.2 bn, whilst commercial finance – which includes investment home lending – was down by 0.4% from $44.4 bn to $44.3 bn.

However, looking in more detail, and separating out investment lending from other commercial lending, we see that investment housing was $12.9 bn, down from $13.2 bn last month.  The relative proportion of new loans for investment housing in the month sat at 38.6%, down from 39.6% last month. So owner occupied lending is now dish of the day.

We also see that business lending, net of investment housing, fell from 48.1% to 48%, although the value rose a little from $31.2 bn to $31.3 bn. We continue to see the relative share of lending to the commercial sector falling, which is not healthy for future growth prospects. The banks prefer to lend against residential property as the current capital adequacy ratios still makes this more attractive than commercial lending, and loss rates are lower, so net margins remain strong. Firms are still holding off from investing, and many who would borrow are finding the terms, and costs prohibitive. We will discuss this further in the next report on the business sector, to be released shortly.

Lending-Trend-Flows-Sept-2015

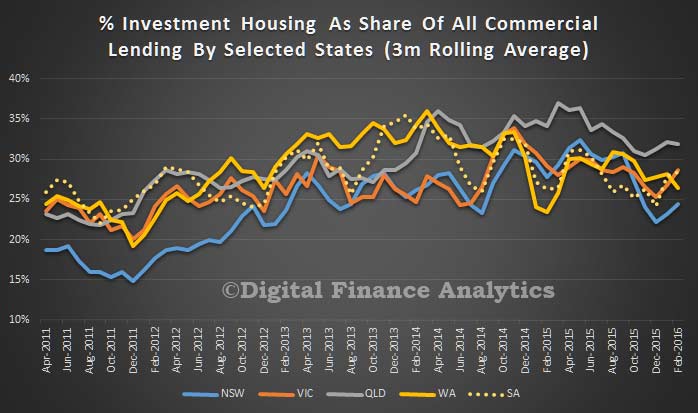
The other data point, which is quite stunning, is the fall in investment lending in NSW. Looking at the original data we see that it fell from a peak monthly flow of more than $6 bn in June to $5.5 bn, supported by a relative growth in investment by entities other than individuals, which would include self-managed superannuation funds and other commercial entities.  Momentum looks set to fall further, in the investment sector, whilst owner occupied lending is set to grow. Indeed the trend line for owner occupied loans in the graph above, shows a clear movement up, as banks reset their sites on attracting owner occupied business and refinance – this explains all the heavy discounts currently available for owner occupied loans in the market at the moment, funded by hikes in rates to existing borrowers.

NSW-Investment-Sept-2015

Unemployment Falls in October

According to the ABS, trend employment has increased by 260,500 since October 2014, contributing to an increased employment to population ratio over the year from 60.6 per cent to 61.1 per cent. The trend unemployment rate has remained relatively stable over the year, decreasing from 6.2 per cent to 6.1 per cent.

The trend series smooth the more volatile seasonally adjusted estimates. The seasonally adjusted unemployment rate for October 2015 was 5.9 per cent (down 0.3 percentage points) and the labour force participation rate was 65.0 per cent (up 0.1 percentage points).

The ABS reported the number of people employed increased by 58,600 to 11,838,200 in October 2015 (seasonally adjusted). The increase in employment was driven by increases in male full-time employment (up 33,500) and female part-time employment (up 24,000).

The ABS seasonally adjusted monthly hours worked in all jobs series increased in October 2015, up 19.1 million hours (1.2 per cent) to 1,660.4 million hours.

The seasonally adjusted number of people unemployed decreased by 33,400 to 739,500 in October 2015, the ABS reported.

Home Lending Rotation Continued In September

The latest home finance data from the ABS confirm the trend that investor loans are on the slide, and being replaced by growth in owner occupied loans and refinancing. In September, trend,  owner occupied housing commitments rose 2.0% to $20.5 bn while investment housing commitments fell 1.9% to $12.9 bn. The number of commitments for owner occupied housing finance rose 0.7% in September whilst the number of commitments for the purchase of new dwellings rose 1.3% the number of commitments for the purchase of established dwellings rose 0.8%. The number of commitments for the construction of dwellings fell 0.1%.

The proportion of investor loans fell back to 48%, whereas a few months back it was well above 50%. Refinance of owner occupied loans continues to rise, to nearly 20% of all loans written, a level not seen since 2012. So the relative shift away from investment loans is confirmed, in response to regulatory intervention.

Home-Loan-Flows-ABS-Sept-2015In stock terms, the mix of investment loans – as reported in original terms, has fallen back to 38%, but is still way higher than when regulators officially started to worry about the systemic risks of investment loans above mid thirties.  we can expect to see further data revisions in coming months, as banks continue to reclassify loans.

Home-Lending-Stock-ABS-Sept-2015Turning to first time buyers, the number of first home buyer commitments as a percentage of total owner occupied housing finance commitments fell to 15.4% in September 2015 from 15.8% in August.  However, this does not tell the full story.

FTB-Home-Loans-ABS-Sept-2015Looking at DFA adjusted data, to take account of first time buyers going direct to the investment sector, we see a further fall in new FTB investor loans, down more than 2% in the month. The number of FTB loans for owner occupation rose however, by 6%, so the overall volume of loans is up. The average FTB loan was 2% larger this month.

FTB-DFA-Sept-2015  The strategies of the banks are clear, focus on owner occupied loans, and offer deep discounts to wrest refinanced loans from competitors, whilst using back-book repricing to fund it. At what point will the regulators step-up their surveillance of owner occupied lending? We think they should do so now.


Retail turnover rose 0.4 per cent in September 2015

The latest Australian Bureau of Statistics (ABS) Retail Trade figures show that Australian retail turnover rose 0.4 per cent in September 2015 following a rise of 0.4 per cent in August 2015, seasonally adjusted. Is momentum slowing?

RetailTradeSept2015The trend estimate for Australian retail turnover rose 0.3 per cent in September 2015 following a 0.3 per cent rise in August 2015. Compared to September 2014 the trend estimate rose 3.7 per cent.

In seasonally adjusted terms there were rises in household goods retailing (1.0 per cent), cafes, restaurants and takeaway food services (0.9 per cent), food retailing (0.3 per cent), other retailing (0.4 per cent) and clothing, footwear and personal accessory retailing (0.2 per cent). Department stores fell 2.0 per cent.

In seasonally adjusted terms there were rises in Victoria (0.8 per cent), New South Wales (0.3 per cent), Western Australia (0.5 per cent), South Australia (0.3 per cent), Tasmania (0.8 per cent) and the Northern Territory (1.0 per cent). There were falls in Queensland (-0.3 per cent) and the Australian Capital Territory (-0.1 per cent).

Online retail turnover contributed 3.3 per cent to total retail turnover in original terms.

In seasonally adjusted volume terms, turnover rose 0.6 per cent in the September quarter 2015, following a rise of 0.7 per cent in the June quarter 2015.