Building Approvals Fall In September

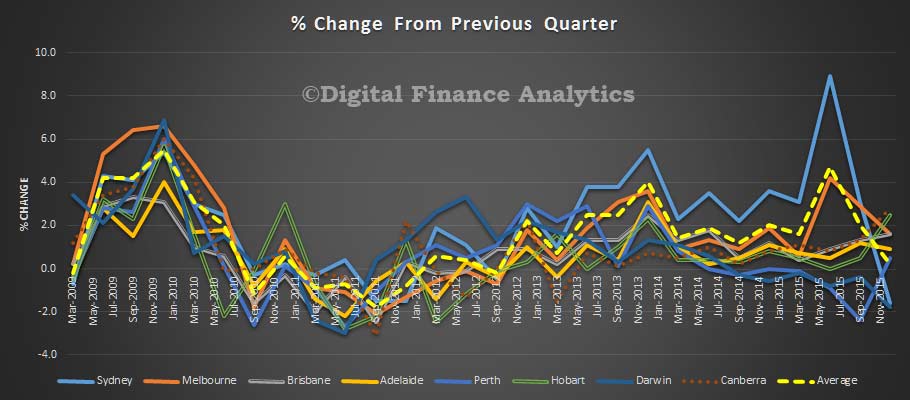
Australian Bureau of Statistics (ABS) Building Approvals show the number of dwellings approved fell 1.8 per cent in September 2015, in trend terms, and has fallen for six months.

Dwelling approvals decreased in September in Northern Territory (3.3 per cent), Western Australia (3.2 per cent), New South Wales (2.6 per cent), Victoria (1.8 per cent), Tasmania (1.2 per cent), Australian Capital Territory (0.7 per cent) and Queensland (0.3 per cent) but increased in South Australia (0.4 per cent) in trend terms.

In trend terms, approvals for private sector houses fell 0.2 per cent in September. Private sector house approvals fell in Western Australia (3.1 per cent) and New South Wales (1.2 per cent) but rose in Queensland (2.2 per cent) and Victoria (1.1 per cent). Private house approvals were flat in South Australia, in trend terms.

The value of total building approved fell 0.6 per cent in September, in trend terms, and has fallen for two months. The value of residential building fell 1.1 per cent while non-residential building rose 0.6 per cent in trend terms.

CPI September quarter 2015 rises 0.5 per cent

The latest Australian Bureau of Statistics (ABS) figures show the Consumer Price Index (CPI) rose 0.5 per cent in the September quarter 2015, following a rise of 0.7 per cent in the June quarter 2015.

The most significant price rises this quarter were in international holiday travel and accommodation (+4.6 per cent), fruit (+8.2 per cent) and property rates and charges (+4.6 per cent), These rises were partially offset by falls in vegetables (–5.9 per cent), telecommunication equipment and services (–2.0 per cent) and automotive fuel (–1.7 per cent).

The CPI rose 1.5 per cent through the year to the September quarter 2015, following a rise of 1.5 per cent through the year to the June quarter 2015.

CPI-Sept-2015Underlying inflation, using the mean trimmed data, is still within the RBA 2-3% target band, so there is no reason to expect an interest rate cut on this measure in November.

Mean-Inflation-Sep-2015

Housing Costs for Owners Steady While Housing Costs for Renters Increase

Housing costs for owners with a mortgage remained steady in real terms between 2011-12 and 2013-14, at $453 a week, according to figures released today by the Australian Bureau of Statistics (ABS).  An increase in average household incomes has seen owners with a mortgage spending 16 per cent of their income on housing costs in 2013-14, down from 18 per cent in 2011-12.

Caroline Daley from the ABS said the figures show the difference in the impact of housing costs on weekly household budgets for those renting and for those with a mortgage. “With housing costs for owners with a mortgage remaining steady, and gross weekly income increasing, mortgages, on average, became more affordable in 2013-14.” “The data did show that lower income households are continuing to devote a significant portion of their income to servicing housing costs. “Lower income households with a mortgage paid $326 a week on average, or 27 per cent of their gross weekly income on housing costs,” said Ms Daley.

Renters have seen an increase in their housing costs, from an average of $328 per week in 2011-12 to $340 in 2013-14. Despite this rise, the housing costs to income ratio remained steady over this period, with renters spending, on average, 20 per cent of their gross household income on housing costs. Lower income households renting from a private landlord paid on average $313 per week, which represented 34 per cent of their gross weekly income.

The majority of lower income private renters paid, on average, over 30 per cent of their gross weekly income on housing costs. Since 1994-95, the proportion of households that own their home outright has declined from 42 per cent to 31 per cent. The proportion of households with a mortgage has increased from 30 to 36 per cent and the proportion of households renting privately has increased from 18 to 26 per cent between 1994-95 and 2013-14.

Australia’s Unemployment Rate 6.2% in September 2015

The latest Australian Bureau of Statistics (ABS) figures show that Australia’s estimated seasonally adjusted unemployment rate for September 2015 remained at 6.2 per cent, despite a fall of 0.1 percentage points (based on unrounded estimates) from August 2015. In trend terms, employment increased to 11,775,800 in September 2015 and the unemployment rate was unchanged at 6.2 per cent for the third consecutive month.

UnemploymentRateSept2015Males continue to register a higher unemployment rate then females.

UnemploymentRateByGenderSept2015  The seasonally adjusted labour force participation rate decreased 0.2 percentage points (based on unrounded estimates) to 64.9 per cent in September 2015.

ParticipatoinRateSep2015The ABS reported the number of people employed decreased by 5,100 to 11,769,900 in September 2015 (seasonally adjusted). There were decreases in male full-time and part-time employment and female full-time employment, with the largest decrease in male full-time employment (down 11,000).

Nearly 7 million  people are not in the labour force.

PeopleNotInTheLabourForceSep2015The ABS seasonally adjusted monthly hours worked in all jobs series increased in September 2015, up 12.2 million hours (0.7 per cent) to 1,638.0 million hours.

The seasonally adjusted number of people unemployed decreased by 8,100 to 772,500 in September 2015.

Trend employment increased by 232,400 since September 2014 while the civilian population aged 15 years and over increased by 286,400 over the same period.

Residential Building Work Higher

The ABS released their Building Activity to June 2015. Residential building rose in the quarter on a trend basis. Victoria shows the greatest momentum currently. We may be reaching “peak construction”, but there is little to indicate an impending fall at the moment.

The trend estimate of the value of total building work done rose 1.5% in the June 2015 quarter. The trend estimate of the value of new residential building work done rose 2.5%, with value of work done on new houses up 2.2% and other residential building up 3.0%.

Work-Done-June-2015The state mix is interesting, with Victoria the largest contributor at $4.5bn, against NSW $4.0bn, helped by large volumes of units being constructed.

ResidentialByStateJune2015 The trend estimate of the value of non-residential building work done fell 0.1% in the June quarter.

The total number of dwelling units commenced rose 0.6% following a rise of 1.9% in the March quarter.

The trend estimate for new private sector house commencements fell 0.8% in the June quarter following a fall of 0.2% in the March quarter.

The trend estimate for new private sector other residential building commencements rose 0.6% in the June quarter following a rise of 3.0% in the March quarter.

Housing Finance Still Strong In August

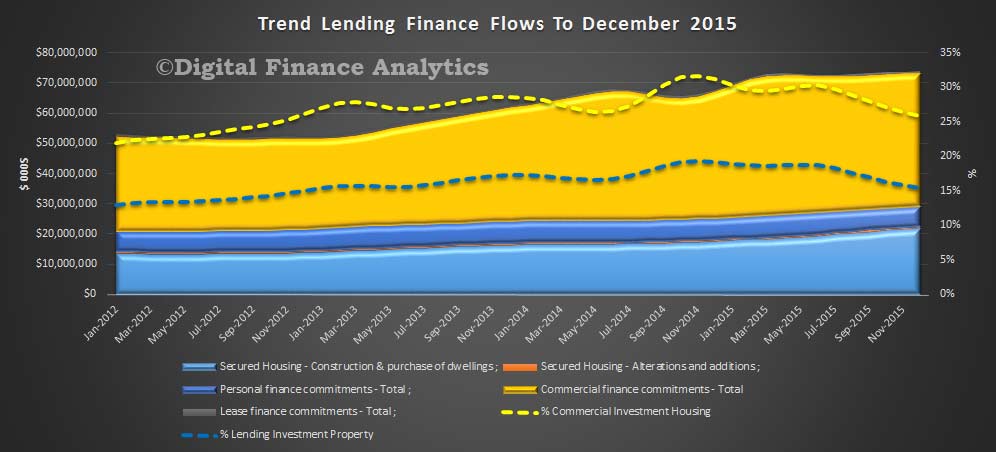
According to data released by the ABS, lending for housing is still very strong, though with some re-balancing away from lending for investment purposes. Total housing lending rose 0.63% seasonally adjusted to a new record of $1.49 trillion, of which $1.38 trillion sits with the banks, the rest is from the non-bank sector. However commercial lending fell using our preferred trend measurements. We do not think the current regulatory settings are right, because flows are still too strong in the housing sector. Of significant note is the relative fall in the proportion of lending going to business down to 14%; and the ongoing rise in the proportion of lending to business which relates to investment housing lending, up to 19%. Both indicators of a sick economy.

LendingFlowsAugust2015AllThe ABS says that in August, the total value of owner occupied housing commitments excluding alterations and additions rose 1.9% in trend terms, and the seasonally adjusted series rose 6.1%. Investment housing commitments fell 0.2%. The trend series for the value of total personal finance commitments fell 0.8%. Fixed lending commitments fell 0.9% and revolving credit commitments fell 0.5%. The trend series for the value of total commercial finance commitments fell 2.1%. Revolving credit commitments fell 2.5% and fixed lending commitments fell 1.9%. The trend series for the value of total lease finance commitments rose 1.6% in August 2015

But as you dig into the data, some interesting themes emerge. So we will run through the main findings in some detail, using data from the two ABS series. We will focus on the housing sector.

Recent heavy discounting and incentives have lead to a significant rise in owner occupied lending. The bulk relates to the purchase of existing property, lending for construction fell again. We also see a relative slight fall in the proportion of loans refinancing existing borrowing, but the proportion is still, by value at the strongest it has been since 2012. Overall more then 20% of transactions are for refinance purposes. Many of the banks have attractive low cost offers to switch, so we expect to see significant (though unproductive) churn in home loans, as banks fight for owner occupied share.

HousingFinanceAugust2015-OOTrendsInvestment lending continues to be a significant element in the numbers.

HousingFinanceAugust2015-All-FlowsIf you remove refinanced loans from the calculation, 50% of new loans were for investment purposes, a slight drop from the 52% in February, but still very strong.

HousingFinanceAugust2015-InvestorMixLooking at investment loans by lender type, we see the banks leading the way, with their stock of investment loans sitting in the high thirties. The chart also clearly shows the adjustments lenders made in their categories, from Jun 2014, (this is an artificial hike, as they did not re-baseline their loans in earlier years). We see growth in the stock of loans for investment purposes held by building societies and credit unions, but at a lower level than the banks.

HousingFinanceAugust2015-MixByADITypeWithin the investment sector, we see a rise in investment loans to entities other than  individuals. These will include companies and self-managed superannuation funds.

HousingFinanceAugust2015-InvestmentOtherFlowsAs previously highlighted the stock of housing continues to rise.

HousingFinanceAugust2015LoanStockNext we look at first time buyers. In original terms, the number of first home buyer commitments as a percentage of total owner occupied housing finance commitments rose to 15.7% in August 2015 from 15.4% in July 2015. However, the absolute number of first time buyer loans was lower in the month, down 2.4% on July. The average loan rose from $341,000 to $346,000, illustrating again that purchasers are reacting to higher prices by getting larger loans, despite apparently tighter lending criteria. Not sure how this works!

HousingFinanceAugust2015-FTBIf we then overlay the data from the DFA household surveys, we see that investment first time buyers are still active, but in slightly lower numbers, so overall, the number of first time buyer loans last month fell a little.

HousingFinanceAugust2015-FTB-DFA

Australians Are Data Hungry And More Connected Than Ever

The latest internet usage statistics from the ABS, released today, to June 2015 shows there were approximately 12.8 million internet subscribers in Australia at the end of June 2015. This is an increase of 2% from the end of June 2014. Our own surveys show that many households enjoy multiple internet connections, including a fixed line ADSL service, and mobile services, so subscriptions should not be equated with individual households (there are about 9 million separate households). This again highlights the digital disruption underway, which creates both opportunity and risk. The trends in our Quite Revolution Report on digital channels, if anything, understated the speed of change.

As at 30 June 2015, almost all (99%) internet connections were broadband. Fibre continues to be the fastest growing type of internet connection in both percentage terms and subscriber numbers. Internet subscriptions to a fibre connection increased by 107% (or 217,000 subscribers) from the end of June 2014 to the end of June 2015.

There are more mobile subscriptions than fixed subscriptions now, with 47% of subscriptions being for mobile services and 40% on ADSL services.

Net---Subscribers-June-2015The average speeds are increasing significantly, with more than 80% of subscribers now enjoying download rates of 8 Mbps more higher.

Net---Speeds-June-2015The volume of data being downloaded has risen significantly, especially via fixed line networks. Total volumes have more than doubled since 2012.

Net---VOlume-June-2015The average user on a mobile subscription downloads about 6 Gb of data, up from 4 Gb in 2010 per month. However the real growth has been in fixed line services, where the average user is now close to 200 Gb a month, compared with 45 Gb in 2010.

Net---Average-June-2015  The data volumes are likely to continue to grow, thanks to video on demand services, and more content rich sources, as well as cloud services. The nbn may not delivery sufficient capacity soon enough, and we are slipped behind other countries in terms of capacity and speed. Innovation and growth will likely be slowed as a result.

Retail turnover rose 0.4 per cent in August 2015

The latest Australian Bureau of Statistics (ABS) Retail Trade figures show that Australian retail turnover rose 0.4 per cent in August following a fall of 0.1 per cent in July 2015, seasonally adjusted.

In seasonally adjusted terms the largest contributor to the rise was food retailing (0.6 per cent). Other retailing (1.3 per cent), department stores (1.3 per cent) and household goods retailing (0.2 per cent) also rose. There were falls in clothing, footwear and personal accessory retailing (-1.4 per cent) and cafes, restaurants and takeaway food services (-0.3 per cent).

In seasonally adjusted terms there were rises in Victoria (0.9 per cent), New South Wales (0.5 per cent), Western Australia (0.2 per cent), South Australia (0.3 per cent) and Tasmania (0.4 per cent). There were falls in Queensland (-0.2 per cent), the Northern Territory (-0.9 per cent) and the Australian Capital Territory (-0.4 per cent).

The trend estimate for Australian retail turnover rose 0.2 per cent in August 2015 following a 0.3 per cent rise in July 2015. The trend estimate for August 2015 is 4.3 per cent higher compared to August 2014.

Online retail turnover contributed 3.1 per cent to total retail turnover in original terms.

Building Approvals Fall Again

Australian Bureau of Statistics (ABS) Building Approvals data shows that the number of dwellings approved fell 0.7 per cent in August 2015, in trend terms, and has fallen for five months.

Dwelling approvals decreased in August in Tasmania (6.8 per cent), Victoria (4.2 per cent), Western Australia (1.8 per cent), Northern Territory (0.6 per cent) and Queensland (0.2 per cent) but increased in the Australian Capital Territory (8.1 per cent), South Australia (4.5 per cent) and New South Wales (1.4 per cent) in trend terms.

In trend terms, approvals for private sector houses fell 0.1 per cent in August. Private sector house approvals rose in Queensland (2.0 per cent), New South Wales (0.4 per cent) and South Australia (0.2 per cent) but fell in Western Australia (2.8 per cent). Private house approvals were flat in Victoria, in trend terms.

The value of total building approved rose 0.8 per cent in August, in trend terms, and has risen for four months. The value of residential building rose 0.2 per cent while non-residential building rose 2.1 per cent in trend terms.

Australian Population Growth Is Slowing

The ABS demographic data released today to March 2015 shows that Australia’s population growth rate has slowed to a rate last seen nearly 10 years ago to  1.4% during the year ended 31 March 2015.  Slowing growth, and the aging of the population are both drag anchors to future growth.

The total population was 23,714,300 people. This reflects an increase of 316,000 people since 31 March 2014, and 93,900 people since 30 December 2014. All states and territories recorded positive population growth.

Natural increase and net overseas migration (NOM) contributed 45% and 55% respectively to total population growth for the year ended 31 March 2015.

Victoria recorded the highest growth rate of all states and territories at 1.7% or 97,500 people. Victoria and Queensland were the only states recording a net gain from interstate migration

The Northern Territory a recorded the lowest growth rate at 0.2%, its lowest growth rate in 11 years. This is 80 per cent lower than that of March 2014. Net interstate migration losses were the greatest contributor to this slower growth, with the territory recording its largest ever interstate migration loss in the year to March 2015.

Western Australia also recorded slower growth. In the past two years, net overseas migration to the state has dropped by 71 per cent, while net interstate migration has dropped to the point where the state has seen a net interstate loss. This has not been seen in over 10 years in this state.

The preliminary estimate of natural increase recorded for the year ended 31 March 2015 (142,900 people) was 9.7%, or 15,400 people lower than the natural increase recorded for the year ended 31 March 2014 (158,300 people). The preliminary estimate of NOM recorded for the year ended 31 March 2015 (173,100 people) was 16.0%, or 33,000 people lower than the net overseas migration recorded for the year ended 31 March 2014 (206,100 people).