Brokers Are The Winners In The Home Loan Wars

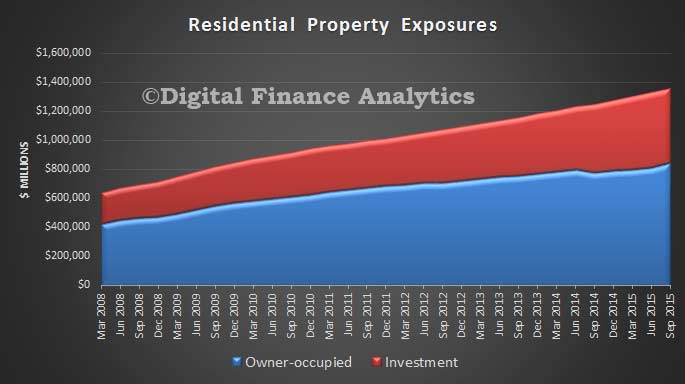
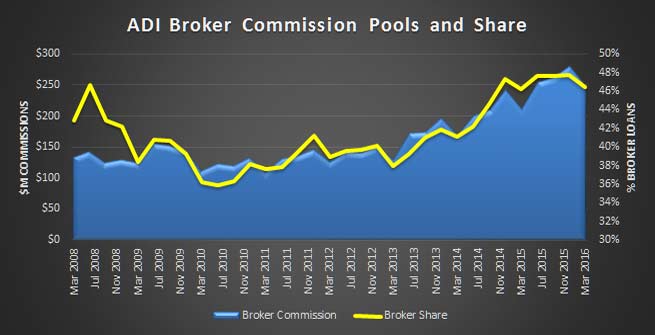
The latest Quarterly ADI Property Exposure stats from APRA paints an interesting picture of lending for residential property.  Total stock of loans across the 150 entities tracked was $1.4 trillion. In the last quarter, $81.7 billion of loans were approved, down by 1.2% a year ago but the average loan balance rose by 5% to $252,000 and the number of loans rose 4% compared with a year ago. Brokers received around $247m in upfront commissions in the quarter from ADIs and generated about 46% of loans by value. The current ASIC review of broker remuneration is therefore highly relevant.

APRA-QP-March-2016-Broker-Com
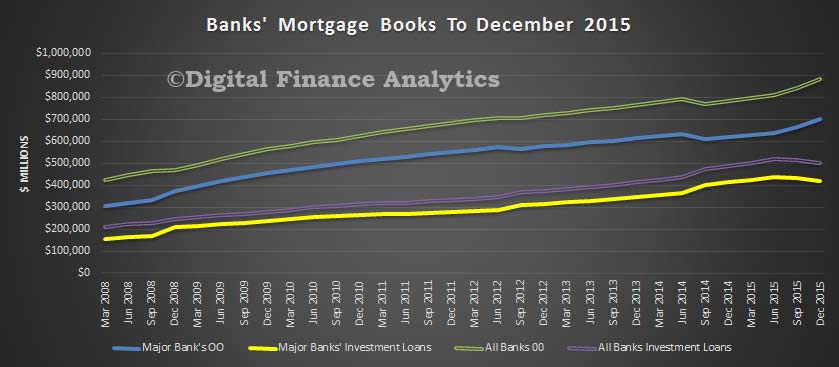
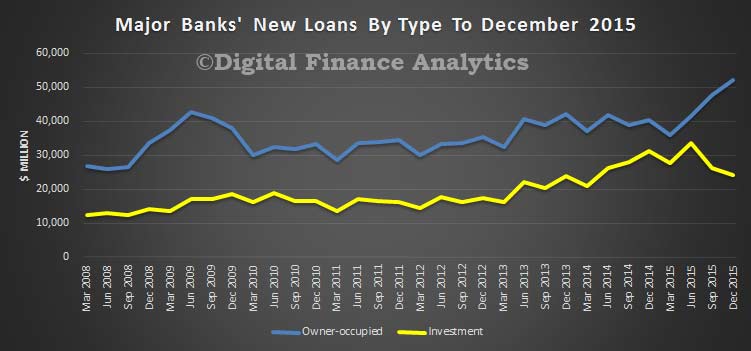
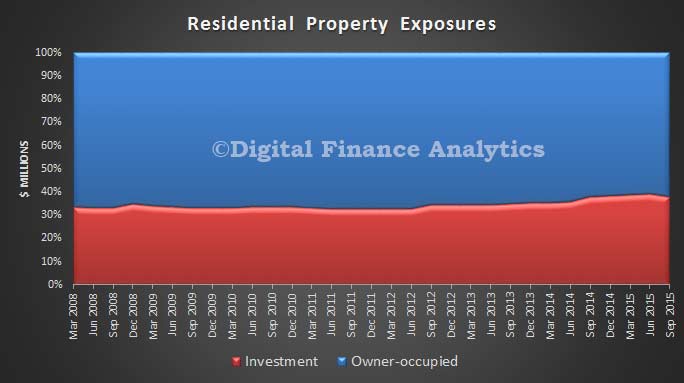
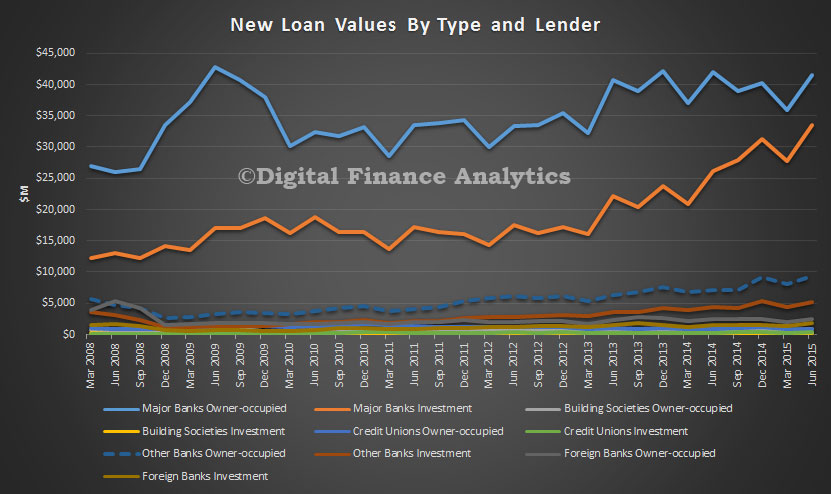
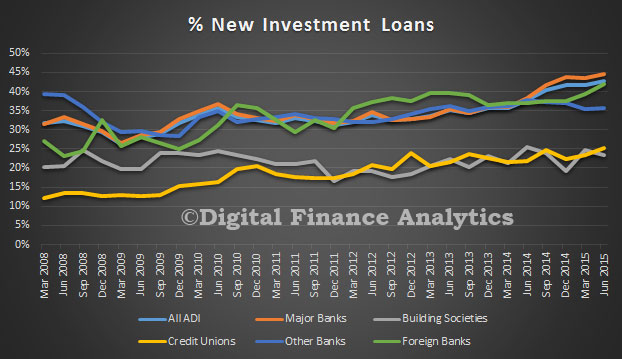
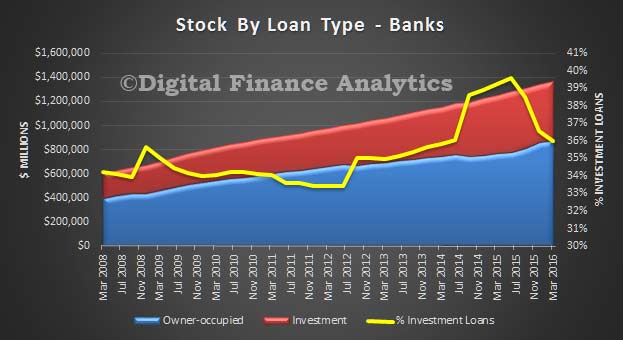
Looking at the banks, we see the mix of investment loans sitting at 36%, down from its high of 39% in 2015. The recent switches between owner occupied and investment loans – around $40 billion, shows in the results.

APRA-QP-March-2016-STOCK
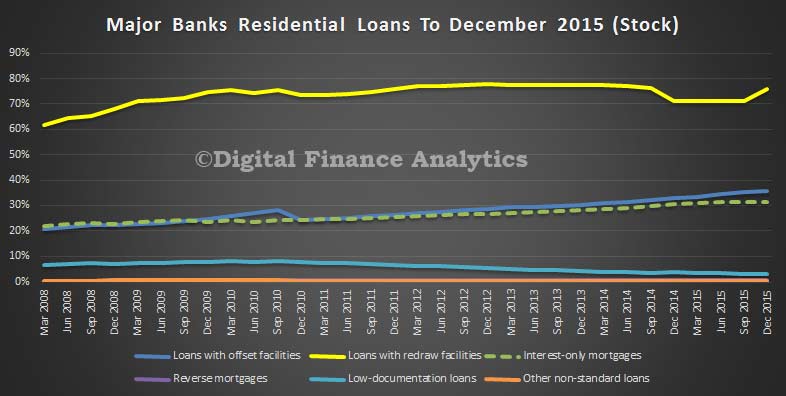
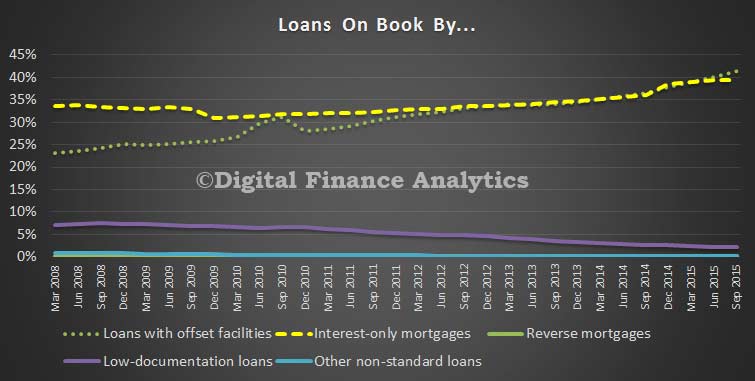
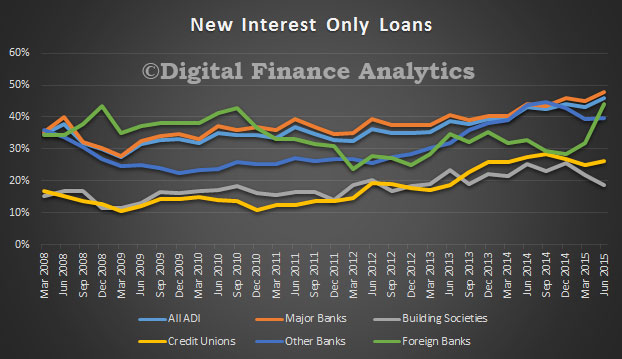
The proportion of interest only loans, which at a portfolio level, is sitting at 30% is still close to the record of 30.3%. Interest only loans are taken by investors wanting to maximise their tax benefits, and owner occupied borrowers trying to reduce monthly repayments. Regulators have recently been concerned about the status of these loans, and now new loans have to have a repayment plan, even if interest only. What though of interest only loans written before the tighter standards?

APRA-QP-March-2016-STOCK-IO
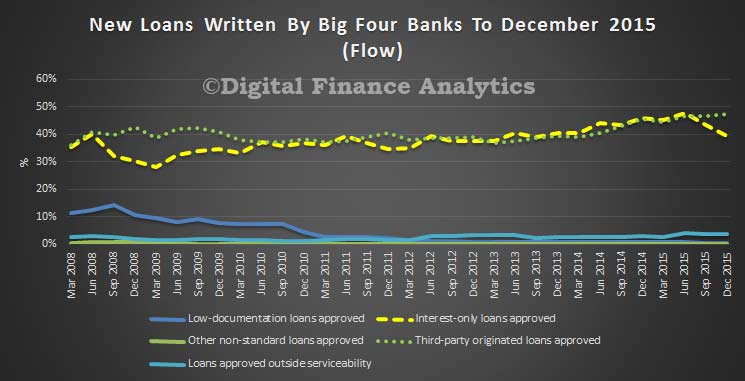
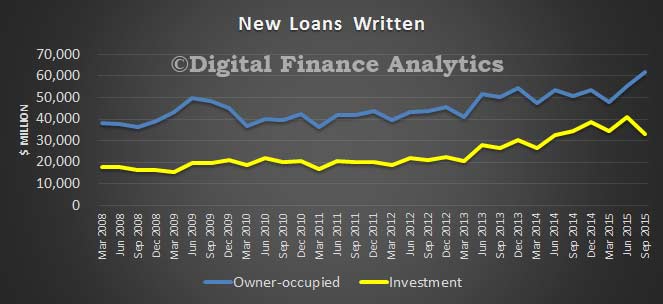
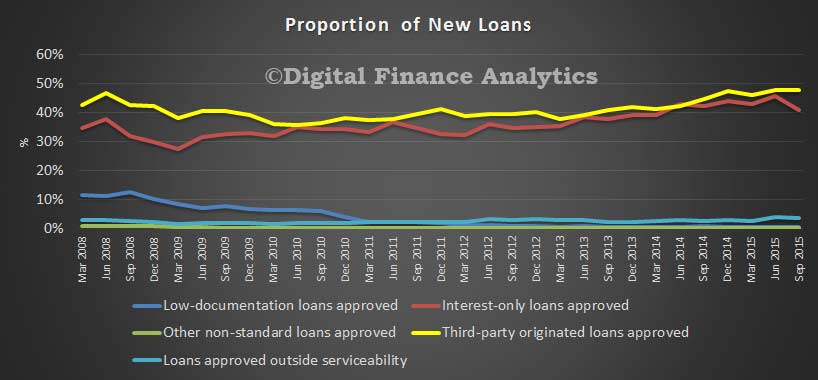
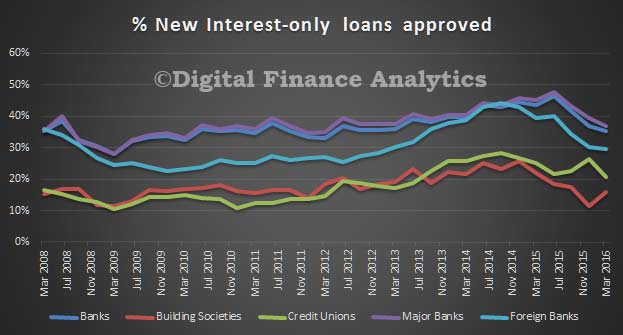
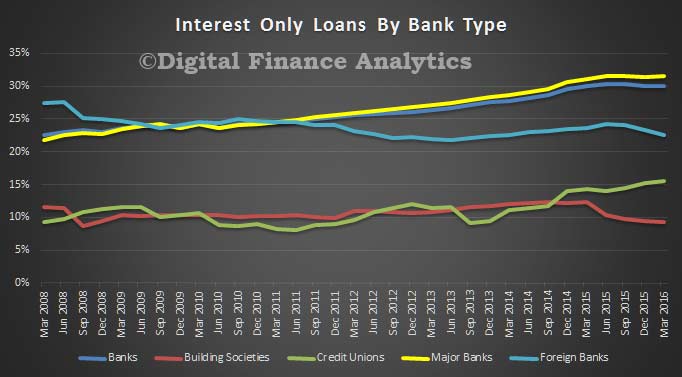
It is important to highlight that though the proportion of new loans being written on an interest only basis is around 35%, (from a peak of 43% in 2015), the major banks are still writing a larger share than portfolio, so expect to see continued growth in the interest only sector.

APRA-QP-March-2016-New-IO
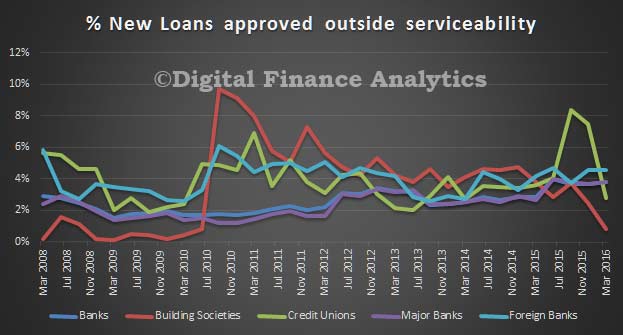
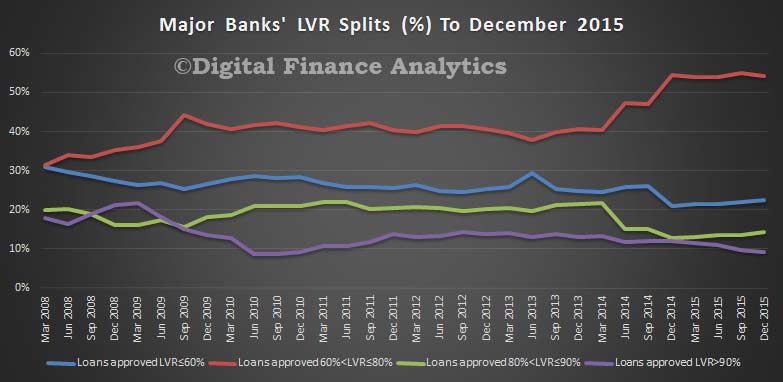
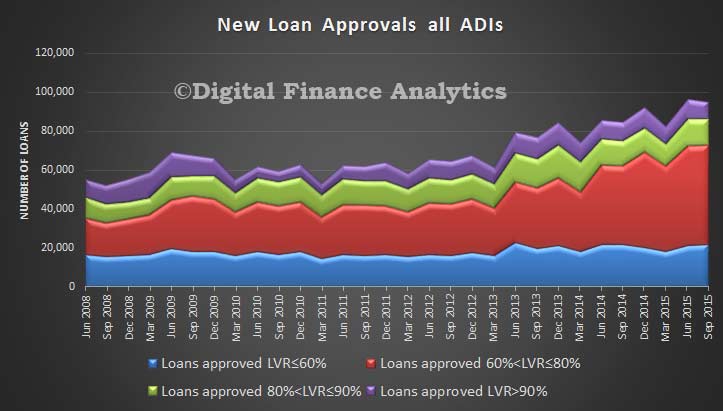
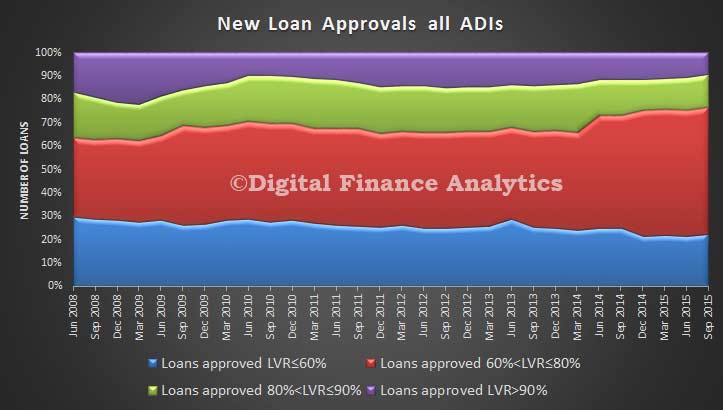
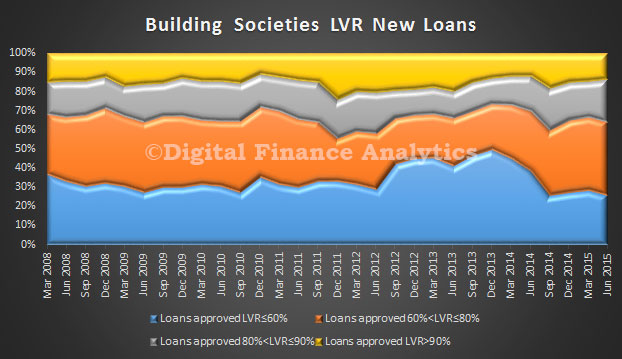
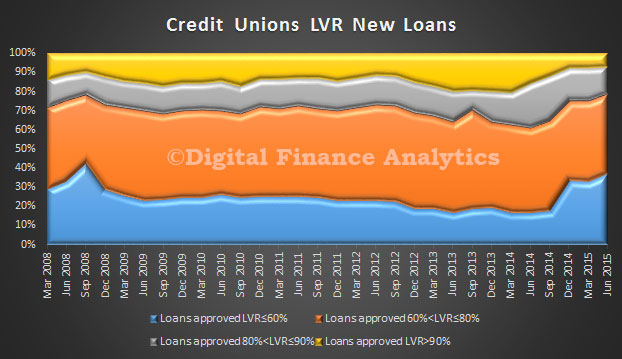
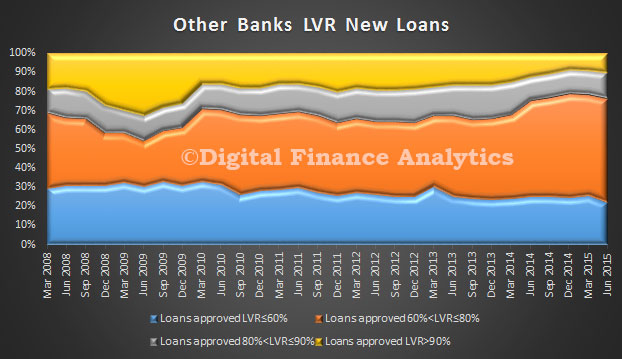
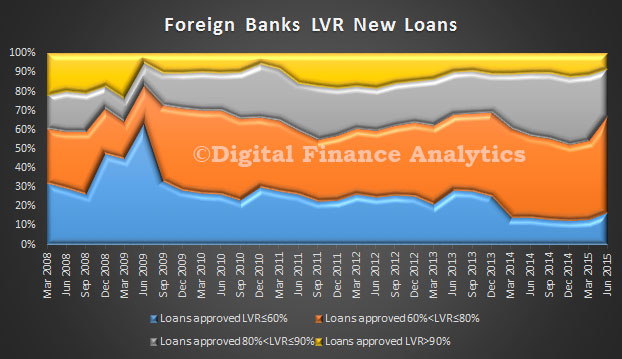
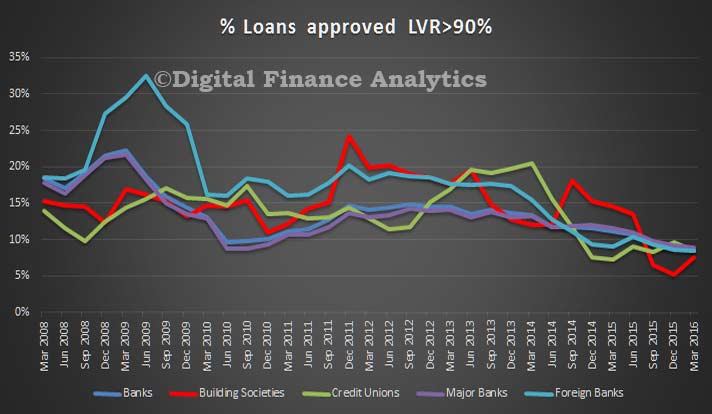
We see the regulator’s hand when we look at the new loans, and those over 90% loan to value (LVR). Around 10% of loans are written above this threshold, whereas in 2008 banks lent more than 20% above this level. Also worth noting that credit unions and building societies had a spurt of higher LVR lending in 2013/15, as they completed for business.

APRA-QP-March-2016-NEW-LVR-Hi
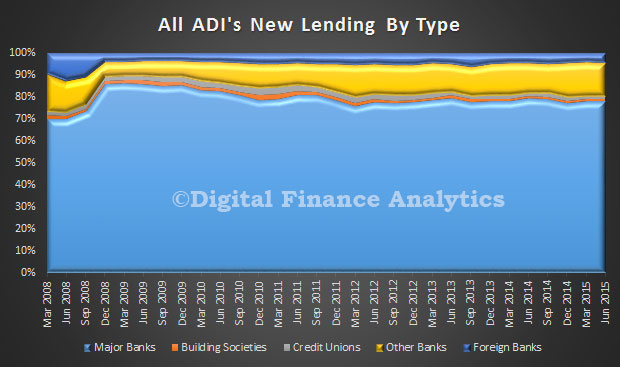
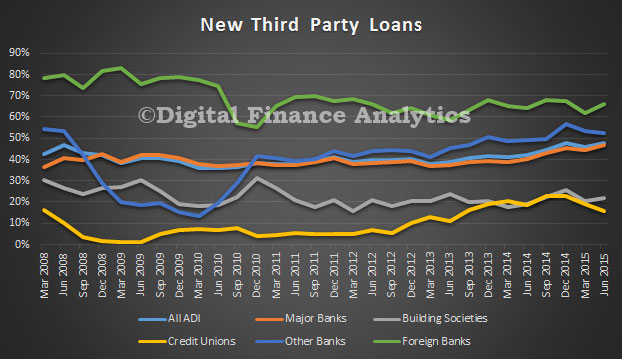
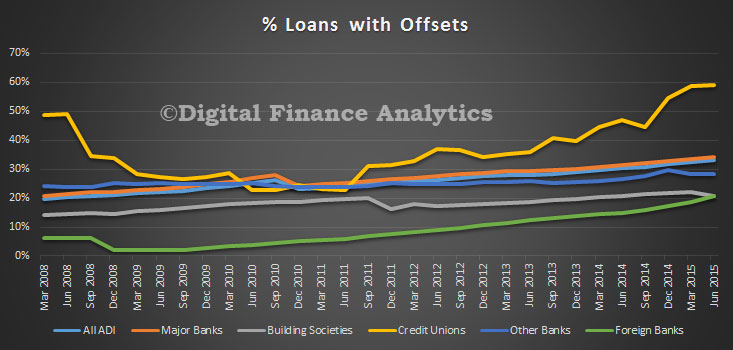
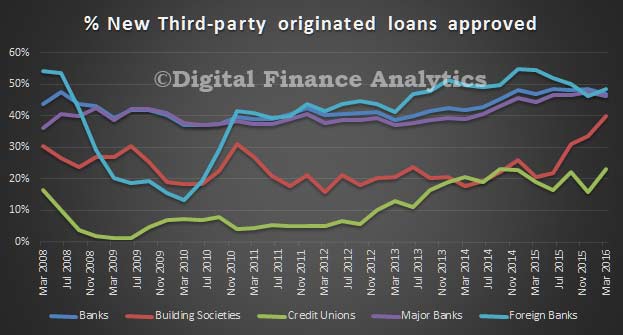
We see a rise in the proportion of loans originated by brokers. Around 50% of new loans come though this channel. We also see a rise in the proportion of building societies using brokers, and credit unions are also on the train along with foreign banks. Brokers have become a significant influence in the market and lenders have to work with them (at the expense of loans via branch channels). This changes the competitive landscape, and the economics of loan origination.

APRA-QP-March-2016-NEW-Broker
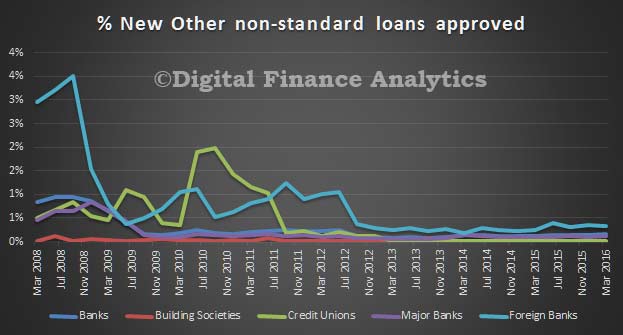
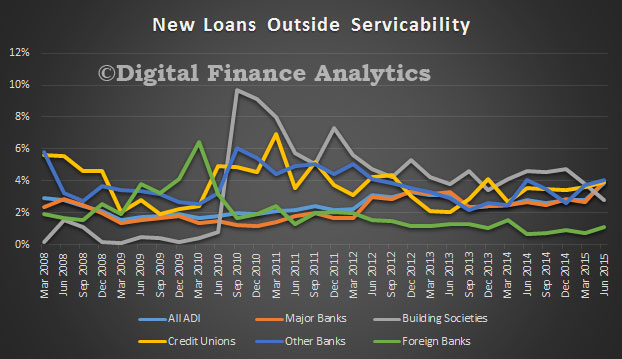
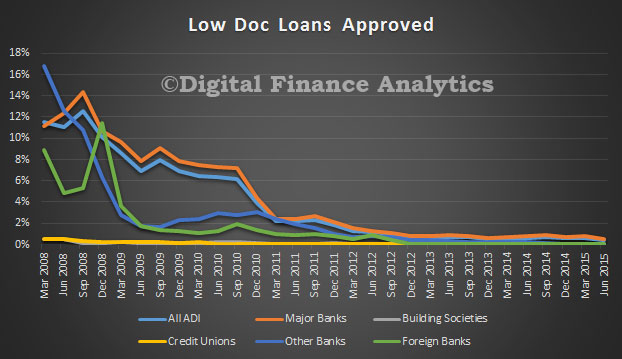
Finally, we see a fall in non-standard loans, though around 4% of new loans are still being written outside standard terms.

APRA-QP-March-2016-NEW-NonST APRA-QP-March-2016---New-Servicability

Banks’ Mortgage Books React To Regulator’s Push

APRA has released the quarterly real estate data for the banks in Australia to December 2015. There are some strong signs that the regulatory intervention has changed the profile of loans being written, despite overall significant growth in loan balances on book.

Total loans on book to December were a record $1.38 trillion, of which $1.12 trillion – or 80% are with the big four.  Within that, 36% of loans were for investment purposes, the remainder owner occupied loans. The trend shows the significant rise in owner occupied loans being written (explained by a rise in refinances), whilst investment loans have fallen. This is a direct response to the regulators intervention. But note, total loans on book are still rising.

APRA-RE-2015-5Because the big four have the lions share of the market, the rest of the analysis will look at their portfolio in more detail. For example, looking at loan stock, we see a rise in the proportion of loans with a re-draw facility (75.7%), Loan with offsets continue to rise, reaching 35.8% and interest only loans have slipped slightly to 31.4%, another demonstration of regulator intervention (they have asked banks to tighten their lending criteria and ensure consideration of repayment options for interest only loans). Reverse mortgages remain static as a percentage of book (0.6%), and low-doc loans continue to fall (2.9%).

APRA-RE-Dec-2015-4The loan to value mix has changed, again thanks to regulatory guidance, with the proportion of new loans above 90% LVR falling to 9.1%, from a high of 21.6% in 2009.  Loans with an LVR of between 80% and 90% have fallen to 14.2%, from a high of 22% in 2011. Once again, we see a change in the mix thanks to regulatory guidance, and also thanks to a lift in refinance of existing loans, which tend to have a lower LVR. The portfolios are being de-risked.

APRA-Dec-2015-RE-3Another demonstration of de-risking is the lift in new owner occupied loans, and a fall in investment loans to 31.7% of new loans written.

APRA-RE-Dec-2015-2If we look at interest only loans, we see a fall to 39.5% of new loans written (the high was 47.8% just 6 months before), so we see the hand of the regulator in play.  However 3.7% of loans were outside normal serviceability guidelines, just off its peak in June 2015. Finally, 47.4% of new loans have been originated from the broker channel, another record. This is also true for all banks, and it shows that brokers are doing well in the new owner-occupied and refinance ridden environment.

APRA-RE-Dec-2015-1So, overall, make no mistake home lending is still growing, despite regulatory guidance, thanks to the rise in owner occupied loans. This means that the banks will be able to continue to grow their books, and maintain their profitability. No surprise then that  the big four are all fighting hard for new OO loans, and are discounting heavily to write business.  It is too soon to judge whether the portfolios have really been de-risked, given the sky high household debt this represents, and a potential funding crunch the banks are facing.

Banks Still Hooked On Mortgage Loans – New Investment Loans Up 19%

The latest APRA Property Exposure data, to September 2015 provides an additional perspective on the loan books of the ADI’s. Overall property exposures are a record $1.35 trillion, up from $1.33 trillion in June, and up 9% on September 2014. Within the mix, owner occupied loans rose from $810 bn to $841 bn, up 8.9% from 2014; in response to the changed lending environment, whilst investment loans for residential property fell from $517 bn to $514 bn, the first fall in a long long time (APRA data goes back to 2008), but still up 9.1% from September 2014.  Within the data we can see the adjustments which the ADI’s have made as they reclassify loans. A process which is not yet complete.

APRA-Ptpy-Sep-2015-6Investment loans comprise 37.9% of all loans, a fall from 38.9% last quarter, but still worryingly high, and higher than the regulators previously had thought.

APRA-Ptpy-Sep-2015-5Looking at some of the key characteristics of loans on book, 40% of loans (by value) have offset facilities, and 35% are interest only loans. There appears to be a slight slowing in the growth of interest only loans, reflecting the changed lending environment, and a slowing in investment lending.  But see below for data on new loans.

APRA-Ptpy-Sep-2015-4The volumes of new loans being written is still strong, with close to 100,000 being written each month. Owner-occupied loan approvals were $219.0 billion (59.8 per cent), an increase of $13.1 billion (6.4 per cent) from the year ending 30 September 2014;
investment loan approvals were $147.0 billion (40.2 per cent), an increase of $23.4 billion (19.0 per cent) from the year ending 30 September 2014.

APRA-Ptpy-Sep-2015-7The LVR splits show the bulk of loans are in the 60-80% band, and there is a fall in the LVR above 90% being written.

APRA-Ptpy-Sep-2015-2The distribution chart below shows this well, and also shows that around 24% of loans are still be written above 80% LVR – at a point in the cycle where house prices in Sydney and Melbourne are probably close to their peaks, and values are falling in some other states.

APRA-Ptpy-Sep-2015-3 Data on the characteristics of the new loans shows a fall in new interest only loans being approved (but still more than 40% of new loans are interest only, and as we know these contain more potential risks later). The proportion via brokers sits at 47.7%, just a tad lower than last quarter, but it shows how important the broker sector is, in terms of originating new loans. There are a small number of new loans still being approved outside standard serviceability, at 3.6% in the past quarter, slightly lower than then 3.8% in June, but still higher than in previous times. Given the tighter lending standards, this is a concern. Only 0.4% of new loans are low documentation loans via the ADI’s though more are being written via the non-bank lenders, and so are not caught in these figures.

APRA-Ptpy-Sep-2015-1

ADI Property Exposures to June 2015 – Up and Away!

APRA released their latest quarterly ADI property exposure data today. The publication contains information on ADIs’ commercial property exposures, residential property exposures and new housing loan approvals. Detailed statistics on residential property exposures and new housing loan approvals are included for ADIs with greater than $1 billion in housing loans.

ADIs’ commercial property exposures were $233.7 billion, an increase of $9.9 billion (4.4 per cent) over the year to 30 June 2015. Commercial property exposures within Australia were $194.0 billion, equivalent to 83.0 per cent of all commercial property exposures.

ADIs’ total domestic housing loans were $1.3 trillion, an increase of $97.1 billion (7.9 per cent) over the year. There were 5.4 million housing loans outstanding with an average balance of $243,000.

ADIs with greater than $1 billion in housing loans approved $96.0 billion of new loans, an increase of $10.5 billion (12.2 per cent) on the quarter ending 30 June 2014. Of these new loan approvals, $55.1 billion (57.4 per cent) were owner-occupied loans and $41.0 billion (42.6 per cent) were investment loans.

Looking at the housing related data in detail, we see major banks wrote about 80% of all home loans, other banks had about 13% of the market, the rest covered by building societies, credit unions and foreign banks.

APRA-June2015-NewLoansByMixLooking at the relative value of loans, major banks still have the lion’s share, and we see the continued growth in investment lending

APRA-June2015-NewLoansByValueLooking at the LVR’s of new loans, we see that major banks have upped the proportion in the 60-80% range, and there is a slight reduction in loans over 90%. Clearly lending criteria have been tightened.

APRA-June2015-NewLoansLVRMajorBanksBuilding societies are writing more than 10% of loans over 90%, significantly more than credit unions.

APRA-June2015-NewLoansLVRBuildingSocieties APRA-June2015-NewLoansLVRCreditUnionsOther banks (excluding majors) also dialled back higher LVR loans but grew then past quarter and also grew their relative mix of 60-80% LVR loans.

APRA-June2015-NewLoansLVROtherBanksForeign banks new high LVR loans fell. Once again we see growth in the 60-80% LVR range.

APRA-June2015-NewLoansLVRForeognBanks

New investment loans grew with the majors (ANZ reclassified loans in the quarter), other banks investment loans fell slightly

APRA-June2015-NewInvestmentLoansThere was significant growth in interest only loans, foreign banks were strongly up.

APRA-June2015-NewInterestOnlyLoansOverall about 46% of all new loans were written via third party channels. We see the majors continuing to grow their broker origination, whilst credit unions and foreign banks use of brokers fell.

APRA-June2015-NewThirdPartyLoansOverall, the proportion of out of serviceability criteria fell, but overall about 4% of new loans were approved outside normal criteria.

APRA-June2015-NewOutsideServicabilityLoansLoans with offset facilities continued to rise, with credit unions leading the way.

APRA-June2015-OffsetLoansFinally, low documentation loans continue to languish.

APRA-June2015-LowDocLoansByMix