Super assets reaches $2.1 trillion

From InvestorDaily.

Australia’s retirement savings system grew to $2.1 trillion by the middle of 2016, according to new statistics published by APRA

In its Annual Superannuation Bulletin, released yesterday, APRA revealed total assets hit $2.1 trillion as at 30 June 2016.

Of that total, $621.7 billion (29.6 per cent) was held in SMSFs and $1.29 trillion was held by APRA regulated superannuation entities.

The remaining $185.5 billion comprised exempt public sector superannuation schemes ($132.2 billion) and the balance of life statutory funds ($53.3 billion).

Retail funds held 26 per cent of the total $2.1 trillion; industry funds held 22.2 per cent; public sector funds held 17 per cent and corporate funds held 2.6 per cent.

As at 30 June 2016, there were 144 APRA-regulated RSE licensees responsible for managing funds with more than four members.

Of the funds with more than four members, the annual rate of return for the year ended June 2016 was 2.9 per cent. The five-year average annualised rate of return to June 2016 was 7.4 per cent and the 10-year rate of return was 4.6 per cent.

Australian superannuation members paid $11.72 billion in fees for the 12 months to 30 June 2016, according to APRA.

APRA Says Banks Home Lending Up In December … But

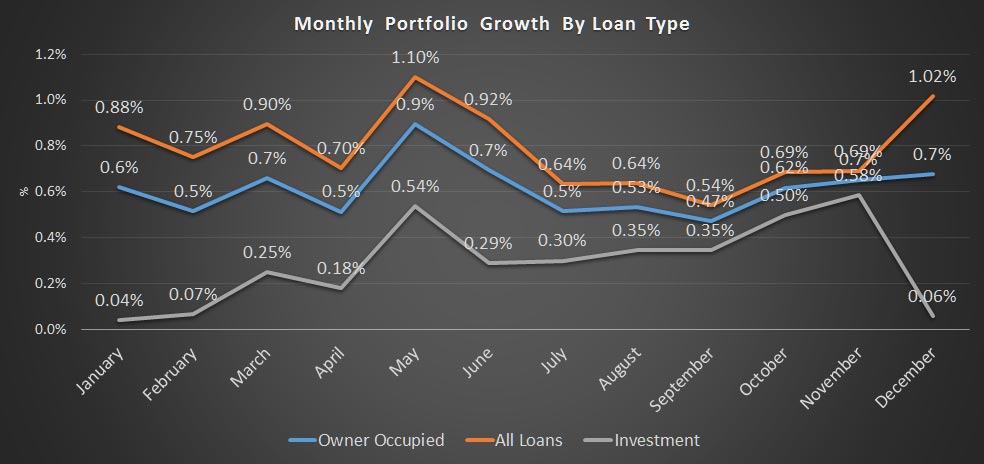
APRA has released their monthly banking statistics, which shows the portfolio movements of the major banks. Total lending for housing was up 0.68% to $1.52 trillion, with owner occupied lending up 1% to $987 billion and investment lending up 0.06% to $537 trillion. But there are adjustments in these numbers which make them pretty useless, especially when looking at the mix between investment and owner occupied loans.

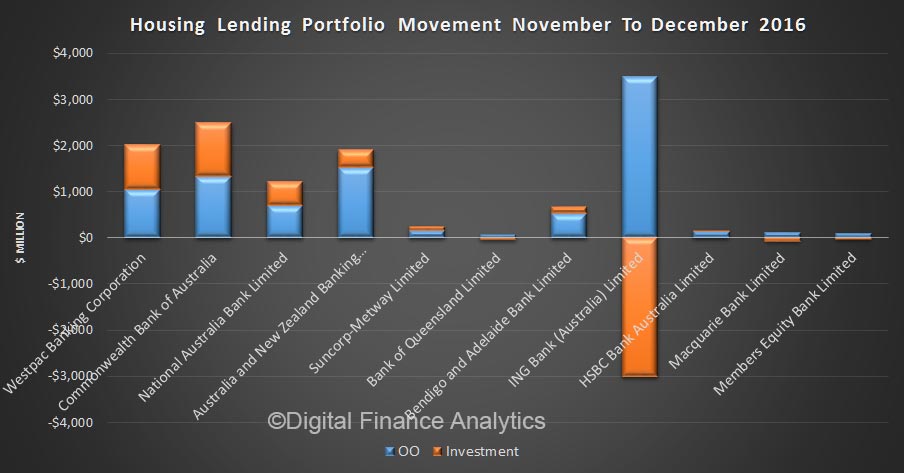
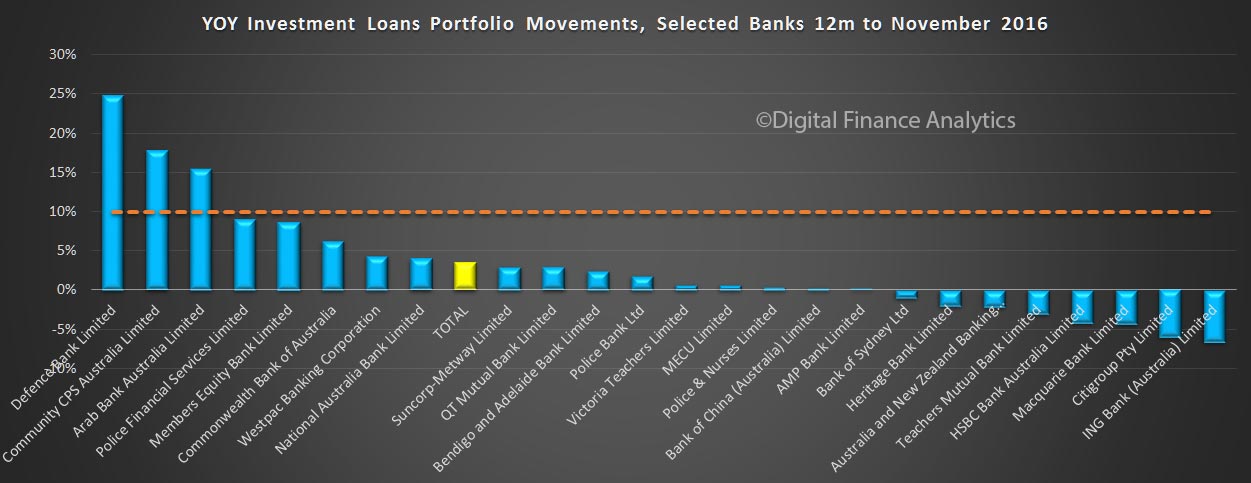
The trend here is quite different from the RBA data also out today, which showed growth of 0.8% for investment loans and 0.4% for owner occupied loans (and includes non-banks in these totals). A quick look at the monthly movements shows that there was a significant ($3bn+) adjustment at ING, which distorts the overall picture. No explanation from APRA, and this movement is much bigger than the $0.9 billion net figure the RBA mentioned in their release.

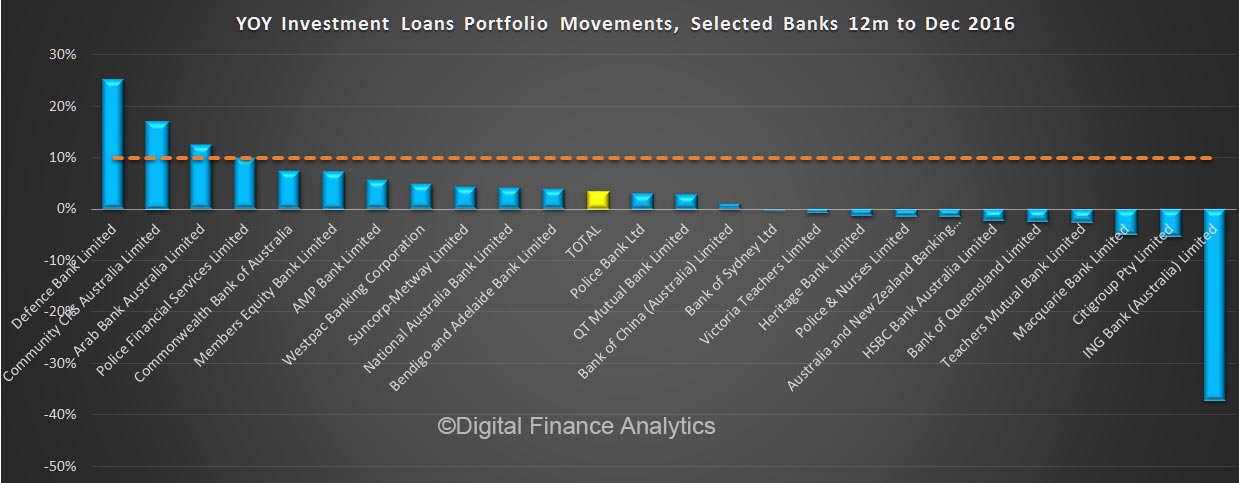
For what it is worth, here is the sorted 12 month growth trend by lending, showing the 10% “hurdle”. ING is to the right of the chart thanks to their adjustment.

But the point is, we really do not know where we stand as i) data quality from the banks is still poor, and ii) the regulators are unable to provide a reconciled and transparent picture of lending. Given the debate about housing affordability, we need better and consistent data to aid the debate.

APRA On The Countercyclical Capital Buffer

APRA released a brief update to support their zero Countercylical Capital Buffer setting. As they say “the countercyclical capital buffer is designed to be used to raise banking sector capital requirements in periods where excess credit growth is judged to be associated with the build-up of systemic risk. This additional buffer can then be reduced or removed during subsequent periods of stress, to reduce the risk of the supply of credit being impacted by regulatory capital requirements”.

APRA may set a countercyclical capital buffer within a range of 0 to 2.5 per cent of risk weighted assets. On 17 December 2015, APRA announced that the countercyclical capital buffer applying to the Australian exposures of authorised deposit-taking institutions (ADIs) from 1 January 2016 would be set at zero per cent. An announcement to increase the buffer may have up to 12 months’ notice before the new buffer comes into effect; a decision to reduce the buffer will generally be effective immediately.

APRA reviews the level of the countercyclical capital buffer on a quarterly basis, based on forward looking judgements around credit growth, asset price growth, and lending conditions, as well as evidence of financial stress. APRA takes into consideration the levels of a set of core financial indicators, prudential measures in place, and a range of other supplementary metrics and information, including findings from its supervisory activities. APRA also seeks input on the level of the buffer from other agencies on the Council of Financial Regulators.

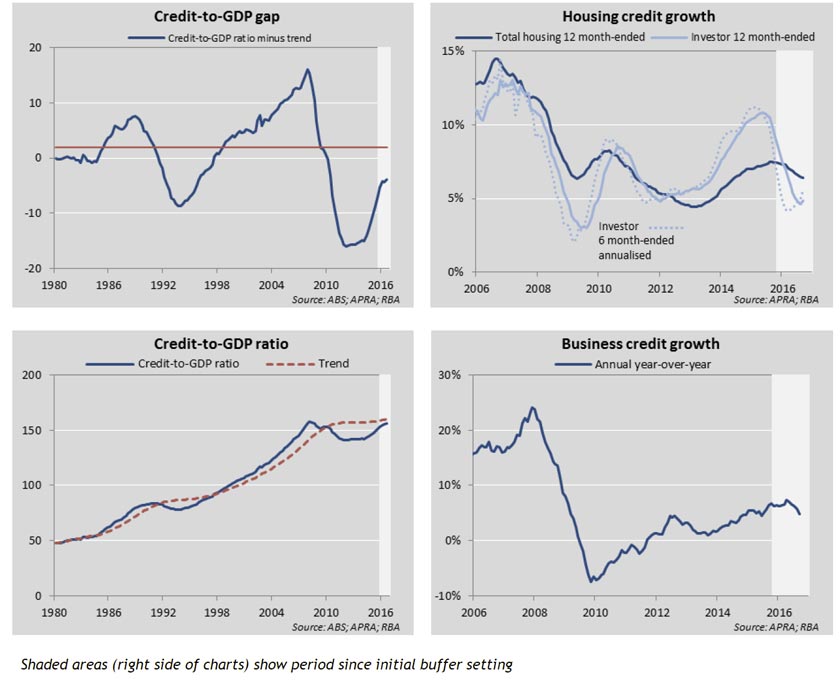
A range of core indicators are used to justify their position. Here are their main data-points.

Credit growth

Credit-to-GDP ratio (level, trend and gap)

The credit-to-GDP gap is defined as the difference between the credit-to-GDP ratio and its long-run trend. The long-run trend is calculated using a one sided Hodrick-Prescott filter, a tool used in macroeconomics to establish the trend of a variable over time. The credit-to-GDP gap for Australia is currently negative at -3.9. The Basel Committee suggests that a gap level between 2 and 10 percentage points could equate to a countercyclical capital buffer of between 0 and 2.5 percent of risk-weighted assets.

Housing credit growth

The pace of housing credit growth has slowed this year, growing at 6.4 per cent year on year as at September 2016, down from 7.5 per cent at the time the buffer was initially set. Investor housing credit growth fell from 10 per cent to 4.9 per cent over the same period, however the pace of growth has been increasing again more recently. APRA has identified strong growth in lending to property investors (portfolio growth above a threshold of 10 per cent) as an important risk indicator for APRA supervisors.

Business credit growth

Business credit growth increased marginally in the first half of 2016. However, business credit growth has fallen over recent quarters; annual growth in business credit was 4.8 per cent over the year to end September 2016, down from 6.3 per cent as at September 2015. Notwithstanding the lower overall rate of growth, commercial property lending growth (not shown) has remained strong, growing 10.5 per cent year on year as at September 2016.

Asset Prices

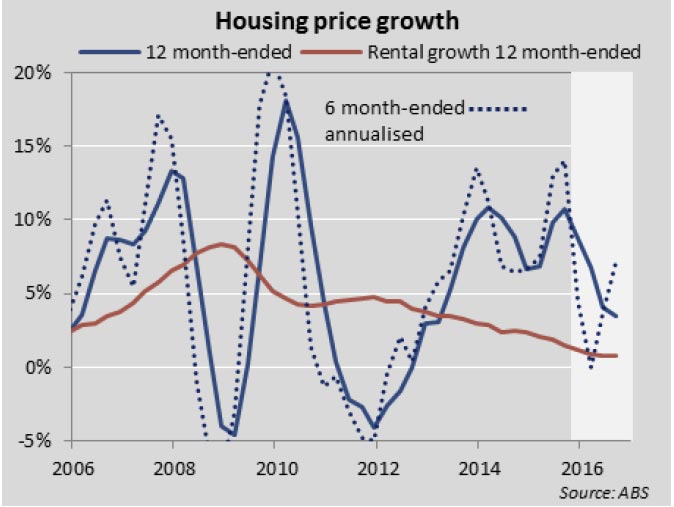
National housing price growth remains strong, but has slowed relative to 2015 peaks, growing nationally at around 3.5 per cent over the 12 months to September 2016. However, over a shorter horizon, prices have been reaccelerating recently with six month-ended annualised price growth of 7.2 per cent nationally as at September 2016 (albeit still a slower pace than 2015 peaks). Conversely, rental growth and household income growth have been relatively weak. Looking beyond the national averages, conditions vary significantly across individual cities and regions. In particular, housing price growth has strengthened in Sydney and Melbourne over recent months with six month-ended annualised growth rates of 11.4 per cent and 9.0 per cent respectively.

Non-residential commercial property has also been exhibiting strong price growth, though this has moderated somewhat in recent months (not shown).

Lending indicators

APRA monitors a range of data and qualitative information on lending standards. For residential mortgages, the proportion of higher-risk lending is a key metric. Over the past few years, APRA has heightened its regulatory focus on the mortgage lending practices of ADIs in order to reinforce sound lending practices. This has included, but not been limited to, the introduction of benchmarks on loan serviceability and investor lending growth, and the issuance of a prudential practice guide on sound risk management practices for residential mortgage lending.

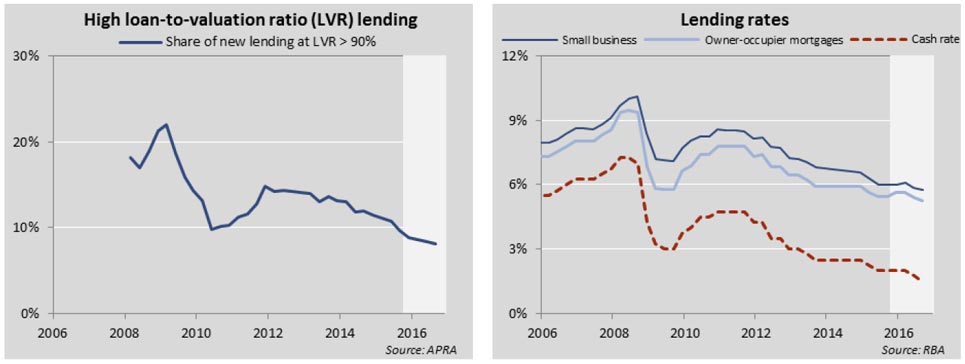
In general, higher-risk mortgage lending has been falling recently with the share of new lending at loan-to-valuation ratios greater than 90 per cent falling from 9.5 per cent to 8.1 per cent over the year to September 2016. Other forms of higher-risk mortgage lending including high loan-to-income and interest-only lending (not shown) have also moderated from 2015 peaks, although there has been some pick-up in the share of interest-only lending recently.

In business lending, banks have showed some evidence of tightening lending standards more recently, in particular for commercial property lending, with the lowering of loan-to-valuation and loan-to-cost ratios on certain development transactions (not shown).

Lending rates had been steadily falling for both housing and business lending to historical lows. More recently however, lending rates have fallen by less than the cash rate, with banks passing on around half of the August cash rate reduction. Lending rates have also risen in recent weeks in response to higher costs in wholesale funding markets. In particular, a number of ADIs have recently announced increases to their mortgage lending rates with some ADIs specifically targeting investor and interest-only loans.

APRA’s confidential quarterly survey of credit conditions and lending standards provides qualitative information on whether conditions are tightening or loosening in the industry.

Financial Stress

Indicators of financial stress are used in informing decisions to release any countercyclical capital buffer. While a wide range of indicators could signify a deterioration in conditions, APRA has identified non-performing loans as its core indicator of financial stress.

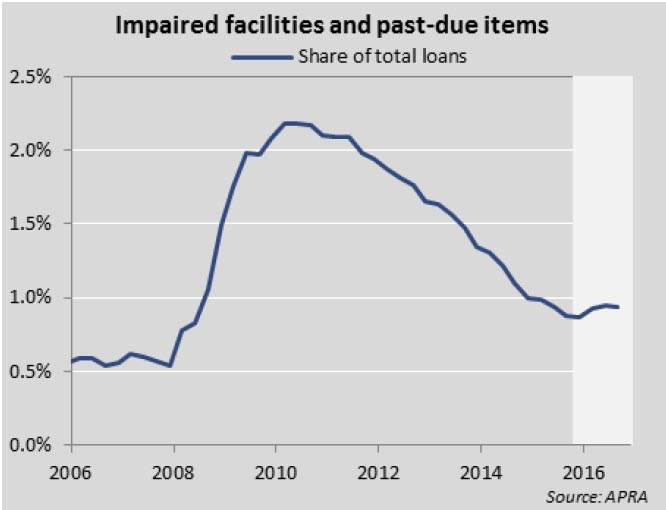
The share of non-performing loans remains low, though it has increased moderately over 2016, to 0.93 per cent as at September 2016, largely driven by increases in regions and sectors with exposures to mining.

So, everything is looking rosy, in their view. However, the high household debt to income ratio and the fact that debt servicing is supported by ultra low interest rates is not included adequately in their assessment – seems myopic in my view, but then this continues the regulatory group-think.  In addition the use of “confidential quarterly survey data” highlights the lack of industry disclosure.

Bank Home Loan Portfolio Now Up To $1.51 Trillion

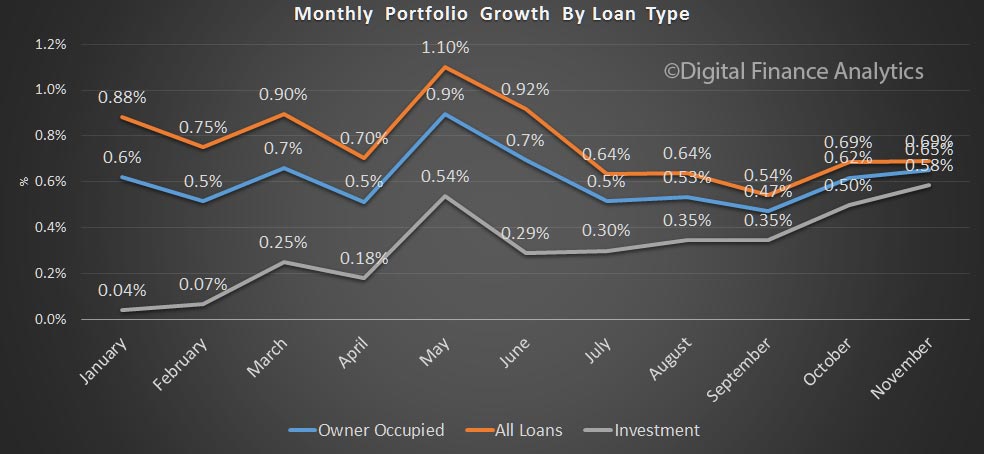
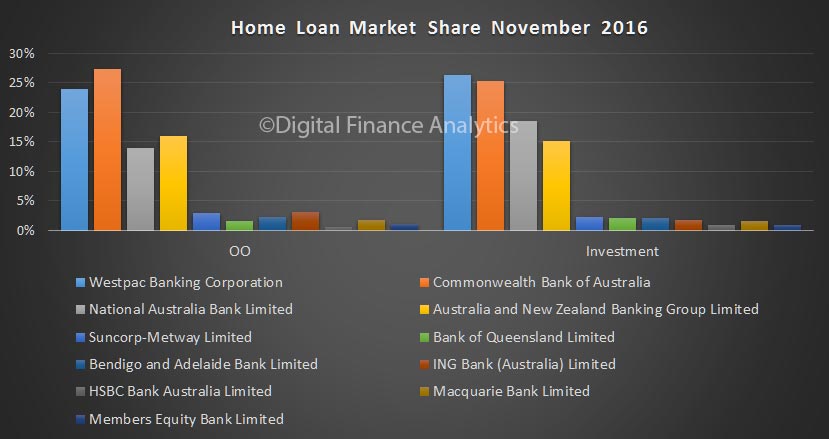
APRA released their monthly banking stats for November 2016.  The total loan portfolio rose 0.65% in the month to a new high of $1.51 trillion. Within that, owner occupied lending rose 0.69% by $6.7 billion, to $977 billion and investment lending rose 0.58%, by $3.1 billion to $536 billion; accounting for 35.44% of all loans. We see investment lending still accelerating (as expected, based on our household surveys).

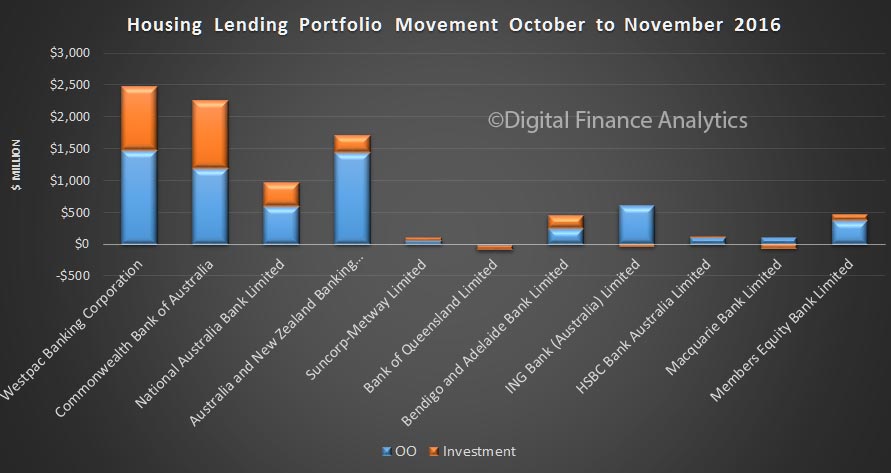
Looking at the individual lenders, CBA wrote more investment loans than WBC in the month, though WBC just holds on to its prime position for investment loans.

Overall WBC wrote the most new business, $2.48 billion. compared with CBA’s $2.26 billion.

The 12 month system investment portfolio movement is 3.5%, but has accelerated in recent months. Testing against the 10% APRA speed limit, we see that most lenders are well below this threshold. We think the limit should be dropped, as investment loan momentum is too strong, and well above inflation and wage growth. APRA never really explained why they picked 10% – time for more macro-prudential action!

The RBA data will be out soon, so we will see if the market – including the non-banks moved the same way.

APRA releases final standard on the Net Stable Funding Ratio

The Australian Prudential Regulation Authority (APRA) has today released the final revised Prudential Standard APS 210 Liquidity (APS 210) and Prudential Practice Guide APG 210 Liquidity (APG 210) which incorporates, among other things, the Net Stable Funding Ratio (NSFR) requirements for some authorised deposit-taking institutions (ADIs).

APRA’s objective in implementing the NSFR in Australia for ADIs that are subject to the Liquidity Coverage Ratio (LCR), implemented in 2015, is to strengthen the funding and liquidity resilience of these ADIs.

The NSFR encourages ADIs to fund their activities with more stable sources of funding on an ongoing basis, and thereby promotes greater balance sheet resilience. In particular, the NSFR should lead to reduced reliance on less-stable sources of funding, such as short-term wholesale funding, that proved problematic during the global financial crisis.

The release of the final prudential standard and prudential practice guide on liquidity follows submissions received on APRA’s September response paper: Basel III liquidity – the Net Stable Funding Ratio and the liquid assets requirement for foreign ADIs. APRA has released today a letter addressing the issues raised in these submissions, while APRA’s final position also takes account of comments received in submissions to the initial March 2016 discussion paper on these matters.

APRA Chairman Wayne Byres said ‘the final policy settings will reinforce the steps that ADIs have taken to strengthen their funding profiles in recent years, and ensure that strengthening is sustained over the long term.’

In addition to addressing the Net Stable Funding Ratio requirements, the final APS and APG 210 released today also address a number of other changes noted in the September response paper. The new APS 210 will commence on 1 January 2018, while the new APG 210 replaces the existing APG 210 from today.

Liquid assets requirement for foreign ADIs
As noted in the September 2016 response paper, APRA will retain the 40 per cent LCR as the default liquid assets requirement for foreign ADIs, but allow foreign ADIs with simpler business activities to apply to use the alternative Minimum Liquidity Holdings (MLH) approach.

Background information

Q: What is the Net Stable Funding Ratio (NSFR)?
A: The NSFR is a quantitative global liquidity standard established by the Basel Committee on Banking Supervision that seeks to promote more stable funding of banks’ balance sheets. The standard establishes a minimum stable funding requirement based on the liquidity characteristics of an ADI’s assets and off-balance sheet activities over a one-year time horizon, and aims to ensure that long-term assets are financed with at least a minimum amount of stable funding.

Q: Why is APRA introducing the NSFR?
A: The NSFR seeks to promote more stable funding of banks’ balance sheets. As the Basel Committee on Banking Supervision noted, when announcing its new international liquidity framework in 2009, throughout the global financial crisis many banks had failed to operate with adequate liquidity and unprecedented levels of liquidity support were required in order to sustain the financial system. The crisis illustrated how quickly and severely liquidity risks can crystallise and certain unstable sources of funding can evaporate, compounding concerns related to the valuation of assets and capital adequacy.

Q: Which ADIs will the NSFR apply to?
A: The NSFR will apply to those locally-incorporated ADIs that are also subject to the Liquidity Coverage Ratio (LCR). There are currently 15 LCR ADIs:  AMP Bank; Arab Bank; Australia and New Zealand Banking Group; Bendigo and Adelaide Bank; Bank of China; Bank of Queensland; Citigroup; Commonwealth Bank of Australia; HSBC Bank; ING Bank; Macquarie Bank; National Australia Bank; Rabobank Australia; Suncorp-Metway; and Westpac Banking Corporation.

Q: Why is APRA only applying the NSFR to ADIs with the Liquidity Coverage Ratio (LCR)?
A: Non-LCR ADIs typically have simpler funding models with most of their balance sheet funded by their deposit base which is considered to be a more stable source of funding. Given the balance sheets of these ADIs will already be financed with significant amounts of stable funding, APRA does not consider there would be any additional benefits from the imposition of the formal NSFR framework for these ADIs.

Caution as interest-only mortgages continue to rise

From News.com.au.

Has Australia gotten too swept up in our great love affair with property?

And they have been consistently rising for close to a decade, since the Australian Prudential Regulation Authority (APRA) started releasing this data in 2008.

According to APRA’s latest quarterly property exposure statistics, released last week, interest-only home loans increased by almost $8 billion in the September 2016 quarter. These types of mortgages now make up 39 per cent of all residential home loans.

But with evidence that house price growth is easing — capital gains recorded over November were the softest they have been since December 2015 — and with mortgage rates on the way back up, the rise in interest-only lending is beginning to ring alarm bells.

“In slow growth markets, which most markets in Australia currently are, if you’re not paying down the principal loan amount and there is a market event that leads to a drop in property prices, a homeowner with an interest-only loan could be left dangerously exposed,” the CEO of HomeStart Finance, John Oliver said.

“Even in current high-growth markets such as Melbourne and Sydney, there is speculation about a potential bursting of the property bubble. If this happens, it could lead to a lot of homeowners losing their properties.

“Australia’s property market is littered with periods when the value of properties actually fell, such as the Sydney market between 2004 — 2007 where prices fell by 8 per cent and Adelaide between 2010 — 2013 where prices fell by 4 per cent.”

CoreLogic figures showed Melbourne house prices dropped by 1.5 per cent in November while Sydney prices rose by just 0.8 per cent. The combined capital city index grew by just 0.2 per cent over the month.

A SLEEPING PROBLEM

Interest-only home loans have typically been popular among property investors because it minimises mortgage repayments in the short-term while investors bank on capital growth in the long-term. So with property investors such a strong force in the Australian property market, Martin North, Principal of Digital Finance Analytics said the increasing popularity of interest-only isn’t surprising.

“We need to understand who are getting those interest-only loans. There is a very strong correlation between interest-only loans and greater investment lending,” Mr North told news.com.au.

“In the last three or four months we have seen investors come back and investor loans are driving the market again.”

But this love affair with property investment, and the subsequent rise in interest-only lending, could now start to cause real headaches at a time when interest rates are starting to rise.

“We have got two issues. The first issue is we have got this continued growth with investor loans and my research tells me investors are still pretty keen on the market … and therefore interest-only loans are being sold,” Mr North said.

“The second issue is we have got interest-only loans with people currently and when they come up for renewal, with interest rates rising, the bank will be asking harder questions about whether they can refinance and repay the capital. And some of those [investors], from my surveys, would indicate they don’t have a plan to repay the capital. That means there is a sleeping problem for those with interest-only loans currently.”

Research from Digital Finance Analytics shows more than eight in ten existing interest-only loan holders expect to refinance their loan to another interest-only loan and more than a quarter had no firm plans as to how they were going to repay if they couldn’t enter another interest-only agreement. Banks, who don’t want borrowers on interest-only terms for long periods, offer fixed-terms on interest-only mortgages, with the average term lasting five years.

This leaves us with a significant amount of investors who have taken advantage of interest-only mortgages, and are “ill-prepared” to switch to principal-and-interest.

They have assumed that price growth will continue at stratospherical levels so they will be able to sell their property and repay the loan, said Mr North, or they have assumed they will be able to continue to roll their loan over on interest-only terms. But house price growth is cooling and banks are tightening interest rates and loan approvals.

“It creates a series of small earthquakes. Those might be tremors that don’t go anywhere but if you think about it in the context of interest rates rising, house price growth slowing going forward, and people who own investment properties who are already underwater in terms of rental yields, and they now find they can’t actually refinance the loan under interest-only terms …

What I’m feeling is people are going to have a nasty shock,” Mr North said.

“If [investors] do run to the exit, they still have got to repay the loan they have got on the property … But if you have a situation where there is a significant downturn, and property prices drop dramatically, then you could be in a situation where some of the interest-only borrowers won’t be able to repay their loans and that could be a significant downward force on the market.”

A WIDER PROBLEM

APRA’s data shows the concern extends beyond property investors. While interest-only home loans are mostly used by investors, owner-occupiers are resorting to this type of structure too, at higher levels than ever.

At the end of the September 2016 quarter, the value of interest-only loans exceeded the value of investment loans by almost $60 billion, compared to just $18 billion a year earlier. At the end of the September 2014 quarter, two years ago, the value of interest-only mortgages was $26 billion less than the value of mortgages to investors. That’s a turnaround of $86 billion in two years.

“At a time when living costs continue to rise there’s no doubt that home buyers, and in particular first-time buyers, see interest-only loans as a quick fix to get into their own home sooner, while also managing everyday costs,” Mr Oliver said.

A sobering thought given a fifth of young borrowers already can’t make their mortgage repayments when rates are at record lows.

So if the market does drop and rates rise, it is not just investors who are headed for trouble.

“If they are not paying any money off the home, no headway is being made on the overall mortgage. By paying off the interest for up to 10 years, no equity will be built up in the home if property prices aren’t rising,” Mr Oliver said.

“If housing prices drop or there is a downturn in the economy then they could be forced to sell the property at a loss, or the banks may repossess the property.”

Margining and Risk mitigation Requirements Start 1 March 2017 – APRA

The Australian Prudential Regulation Authority (APRA) has announced the new requirements for margining and risk mitigation for non-centrally cleared derivatives will commence on 1 March 2017, with a multi-year phase-in that reflects the internationally agreed timetable.

risk-pic-2

The requirements are contained in Prudential Standard CPS 226 Margining and risk mitigation for non-centrally cleared derivatives (CPS 226), which was released in its final form in October 2016 without a commencement date. CPS 226 implements an important component of the G20’s post-crisis reforms aimed at reducing systemic risk in the over-the-counter derivatives market in Australia.

CPS 226 will commence on 1 March 2017, with a multi-year phase-in that reflects the internationally agreed timetable. The risk mitigation requirements in CPS 226 take effect from 1 March 2018.

APRA has also granted a six-month transition period for variation margin requirements, which commences on 1 March 2017. While all new transactions entered into from 1 March 2017 are in-scope for the variation margin requirements, the transition period will provide additional time for entities to finalise their implementation and reach full compliance for all transactions executed from 1 March 2017.

APRA considers that the implementation timetable in conjunction with the transition period appropriately balances the benefits of international consistency with the need for sufficient time for implementation.

A letter to industry setting out the full implementation timetable and an updated version of CPS 226 can be found on the APRA website at: www.apra.gov.au/CrossIndustry/Pages/Response-margining-risk-mitigation-October-2016.aspx

Home Lending Momentum Increases In October

The latest monthly banking statisticsdata from APRA for October 2016 shows the total home lending portfolios held by the ADI’s grew from $1.49 trillion to 1.51 trillion, up 0.62%. Within that, owner occupied loans rose by 0.69% to $970 billion (up $6.6bn) and investment loans rose 0.5% (up $2.6 billion). 35.46% of the portfolio is for investment lending purposes.  Momentum is increasing (and matches the high rate of auction clearances we have seen recently).

apra-oct-2016-all-moveLooking at the individual banks, in value terms, CBA lifted their investment portfolio by $975m, compared with WBC $892m. Bendigo Bank shows an uplift of $1.1bn, thanks to their portfolio acquisition of $1.3bn of loans from WA. Suncorp, Members Equity and Citigroup saw their portfolios fall in value. Macquarie saw a small fall in their investment lending portfolio.

Collectively, the big four grew their investment portfolio by $2.6 billion, and their owner occupied portfolio by $4.5 billion.

apra-oct-2016-port-moveWestpac and CBA remain the largest home lenders.

apra-oct-2016-mix-moveLooking at the APRA 10% speed limit, based on an average annualised 3m growth rate, the market shows a 3.4% growth in investment lending, with CBA, WBC and NAB all growing faster than system, but below the 10% speed limit.

apra-oct-2016-yoy-3mThis data would indicate that i) further rate cuts from the RBA are off the agenda and ii) they should consider further tightening, using either macroprudential controls, or a rate rise.

We will get the RBA aggregates later today, and we will be able to assess the growth in the non-bank sector, as well as look at the changed classification which took place in the month between investment and owner occupied loans.

Remember that default rates on mortgages are already rising, especially in the mining heavy states, although overall provisions are low at the moment. The banks remain highly leveraged to the housing sector.

Major Banks Still Highly Leveraged

APRA has published their quarterly summary of bank performance. Looking at the key metrics of the four major banks, we see growth in home lending and driving total loans higher to $2.4 trillion. Net interest income from home lending rose to 61.9%, up from 59.3% the previous quarter, reflecting changes in mortgage discounts and repricing. 83.2% of all ADI home lending is held by the big four.

apra-adi-sepq16-shareHome lending now comprises 62.8% of all loans with the big four. But in cash terms, lending provisions are lower now than in 2010, despite significantly larger balances.

apra-adi-sepq16-mix-and-provThe ratio of bank share equity to total loans sits at just over 5%, showing again how leveraged the banks are. We also see that CET1 and Basel Capital, whilst higher now than in 2013, has fallen somewhat recently.

apra-adi-sepq16The new Liquidity Coverage reporting shows the big four well above the required 100%.

apra-adi-sepq16-lcrTerm deposits rose compared with on-call deposits, thanks to the LCR requirements making term deposits more attractive to the banks.

More generally, on a consolidated group basis, there were 153 ADIs operating in Australia as at 30 September 2016, compared to 156 at 30 June 2016 and 159 at 30 September 2015.

  • G&C Mutual Bank Limited changed its name from SGE Mutual Limited, with effect from 12 September 2016.
  • Latvian Australian Credit Co-operative Society Limited had its authority to carry on banking business in Australia, with effect from 22 September 2016.
  • MyLifeMyFinance Limited changed its name from Transcomm Credit Co-operative Limited, and changed its classification from ‘Credit union’ to ‘Other ADI’, with effect from 3 August 2016.
  • “Quay Credit Union Ltd had its authority to carry on banking business in Australia revoked, with effect from 12 September 2016.”
  • “Select Credit Union Limited had its authority to carry on banking business in Australia revoked, with effect from 7 July 2016.”
  • “Select Encompass Credit Union Ltd changed its name from Encompass Credit Union Limited, with effect from 13 July 2016.”
  • “Sutherland Credit Union Ltd had its authority to carry on banking business in Australia revoked, with effect from 12 July 2016.”
  • “The Bank of Nova Scotia was authorised to operate as a foreign branch bank in Australia, with effect from 25 August 2016.”Looking at financial performance, the net profit after tax for all ADIs was $27.7 billion for the year ending 30 September 2016. This is a decrease of $9.2 billion (25.0 per cent) on the year ending 30 September 2015.

The cost-to-income ratio for all ADIs was 48.3 per cent for the year ending 30 September 2016, compared to 49.0 per cent for the year ending 30 September 2015.

The return on equity for all ADIs was 9.9 per cent for the year ending 30 September 2016, compared to 14.1 per cent for the year ending 30 September 2015.

The total assets for all ADIs was $4.52 trillion at 30 September 2016. This is a decrease of $58.3 billion (1.3 per cent) on 30 September 2015.

The total gross loans and advances for all ADIs was $3.01 trillion as at 30 September 2016. This is an increase of $105.8 billion (3.6 per cent) on 30 September 2015.

The total capital ratio for all ADIs was 13.7 per cent at 30 September 2016, unchanged from 13.7 per cent on 30 September 2015.

The common equity tier 1 ratio for all ADIs was 9.9 per cent at 30 September 2016, a decrease from 10.1 per cent on 30 September 2015.

The risk-weighted assets (RWA) for all ADIs was $1.97 trillion at 30 September 2016, an increase of $110.1 billion (5.9 per cent) on 30 September 2015.

For all ADIs:

  • Impaired facilities were $15.2 billion as at 30 September 2016. This is an increase of $1.4 billion (10.4 per cent) on 30 September 2015. Past due items were $12.9 billion as at 30 September 2016. This is an increase of $1.2 billion (10.5 per cent) on 30 September 2015;
  • Impaired facilities and past due items as a proportion of gross loans and advances was 0.93 per cent at 30 September 2016, an increase from 0.88 per cent at 30 September 2015;
  • Specific provisions were $7.2 billion at 30 September 2016 (chart 8). This is an increase of $0.9 billion (14.2 per cent) on 30 September 2015; and
  • Specific provisions as a proportion of gross loans and advances was 0.24 per cent at 30 September 2016, an increase from 0.22 per cent at 30 September 2015.


Home Lending Exposures Grow Again

APRA released the latest ADI Property Exposure data to September 2016 today. ADIs residential term loans to households were $1.46 trillion as at 30 September 2016. This is an increase of $106.5 billion (7.9 per cent) on 30 September 2015. The number of loans rose from 5,469,000 to 5,665,000, a rise of 3.6% year on year.

Owner-occupied loans were $949.0 billion (64.9 per cent), an increase of $108.6 billion (12.9 per cent) from 30 September 2015; and investor loans were $512.3 billion (35.1 per cent), a decrease of $2.0 billion (0.4 per cent) from 30 September 2015.

ADIs with greater than $1 billion of residential term loans held 98.7 per cent of all such loans as at 30 September 2016. These ADIs reported 5.7 million loans totalling $1.44 trillion. Of these: the average loan size was approximately $255,000, compared to $244,000 as at 30 September 2015; and $564.8 billion (39.2 per cent) were interest-only loans.

Looking at new approvals, ADIs with greater than $1 billion of residential term loans approved $372.1 billion of new loans in the year ending
30 September 2016. This is an increase of $5.8 billion (1.6 per cent) on the year ending 30 September 2015. Of these new loan approvals: owner-occupied loan approvals were $250.3 billion (67.3 per cent), an increase of $29.9 billion (13.6 per cent) from the year ending 30 September 2015; investment loan approvals were $121.8 billion (32.7 per cent), a decrease of $24.2 billion (16.6 per cent) from the year ending 30 September 2015:

$51.8 billion (13.9 per cent) had a loan-to-valuation ratio (LVR) greater than 80 per cent and less than or equal to 90 per cent, an increase of $2.9 billion (5.9 per cent) from the year ending 30 September 2015

apra-adi-sept16-lvr-80-90$31.5 billion (8.5 per cent) had a LVR greater than 90 per cent, a decrease of $7.7 billion (19.5 per cent) from the year ending 30 September 2015; and

apra-adi-sept16-lvr-90$135.2 billion (36.3 per cent) were interest-only loans, a decrease of $23.9 billion (15.0 per cent) from the year ending 30 September 2015. Major banks are writing the largest proportion of interest only loans.

apra-adi-sept16-ioThe proportion of new loans via brokers continues to grow, with foreign banks having the largest share, but domestic banks are now above 50%.

apra-adi-sept16-broker We note that the number of credit unions and building societies captured in the data has fallen to the point where their discrete data is no longer being reported.