How inflation is tied to the property market

Weak inflation has sent interest rates to historic lows, but new housing supply and APRA’s steps to rein in property investment will contain property prices according to an article in The Real Estate Conversation.


While many property owners around the country continue to enjoy strong capital growth, the national inflation rate dropped to 1% in the 12 months to June, according to the Australian Bureau of Statistics (ABS). For what it’s worth, this is below the Reserve Bank’s 2-3% target band and represents the weakest annual rate of inflation in 17 years.Such low inflation would typically mean the economy is weak and unemployment is high. But not in Australia, apparently. A number of commentators say that Australia’s unemployment rate (5.8% as per ABS) is at a stable level and that the economy is ticking along well, even though both company profits and wages are generally down. It’s a confusing mix of circumstances, for sure.

Adding to the complexity, low inflation has seemingly had little effect on the property market, which remains buoyant even after several years of high price growth in cities like Sydney and Melbourne. Prices aside, total housing credit has mostly been up this year (at least for owner-occupiers), and this usually means there are plenty of property buyers out and about and wanting to borrow money.

These buyers are often competing on a limited supply of homes, which is important because the supply-demand equation is central to our reading of the economy. One reason demand for property has so dramatically increased is because of the relatively cheap cost of home loans in recent years, which is due to record low interest rates – 1.5% as of August – implemented by the Reserve Bank (RBA).

The impact of rate cuts

Many media articles lead with the idea that RBA rate cuts are directly linked to the property market. Yet if you read past the headlines, it becomes clearer that the RBA is more concerned with low inflation.

“The RBA is trying to keep inflation at a certain level and the expected outcome from cutting interest rates is a lower dollar,” says BIS Shrapnel senior manager, Angie Zigomanis. “By lowering interest rates it means people will come here [to Australia] and the returns on their investments are lower, and the dollar starts falling on that basis because you’re competing for money.

“It means that the lower dollar starts stoking a lot of the import industries as well. It makes their products more competitive against exports.

“So rate cuts are part of a broader view to ward of inflationary pressures but also to lower the dollar to kick start some other industries that provide economic growth. The housing market is a bi-product [of this].”

Perception is reality

Much of this, of course, is about perception. In other words, high inflation means demand is seen to be strong, and this prompts businesses to invest more, consumers to spend and therefore price to go up.

There are several measures that help the government determine demand levels, like the consumer price index, which gives us that inflation rate figure. It simply measures the changing price consumers pay for goods and services. So in a high inflation environment, prices for the same goods and services are, well, much higher because the underlying demand is so strong.

Right now, CommSec says that price pressures are currently contained in Australia, largely due to greater competition in the market, including online sellers. This means consumers are the main beneficiaries of cheaper prices across all good and services – perhaps with the exception of property prices.

Find the balance

Over the past 20 years general price inflation has been low and stable, consistent with the inflation target since the early 1990s, according to an RBA paper published in 2015. However, such has been the level of property price growth that more recent prices have outstripped the rate of inflation in other parts of the economy, including inflation in the cost of new dwellings.

This has been a concern for the RBA because if property prices go up too high then most money will end up in housing and building instead of sustainable investment in industries, says Zigomanis.

This is why the Australian Prudential Regulation Authority (APRA) last year sought to limit the impact of property investors on the market by capping annual investor credit growth at 10%, which CoreLogic RP Data says has worked well to this point.


ANZ On APRA Revised Mortgage Risk Weights

Following the announcement on Friday 5 August 2016 by the Australian Prudential Regulation Authority (APRA) reaffirming its revised average mortgage risk weight targets, ANZ advises that the average credit risk weighting of the Group’s Australian residential mortgage lending book will increase.

Bank-Concept

The announcement by APRA provided an update on discussions and reviews it is conducting with the authorised deposit taking institutions (ADIs) accredited to use an internal ratings based (IRB) approach to credit risk, regarding refinements to risk models as part of its routine supervisory process. APRA announced that it is recalibrating the impact of refinements to risk models on the required risk weighting for residential mortgages.

The exact increase for ANZ will not be confirmed until ANZ has submitted and had approved its new mortgage capital model, and APRA has completed its recalibration, but is expected to be within the 25% – 30% range  recommended by the Financial Services Inquiry. This is expected to be effective in the First Quarter of FY2017.

This follows APRA’s announcement of 20 July 2015 which advised changes to capital requirements for Australian residential mortgage exposures for IRB ADIs in response to a recommendation from the Financial Services Inquiry. The outcome of those changes was, from 1 July 2016 an increase in the average credit risk weighting applied to ANZ’s Australian residential mortgage lending from approximately 15% to approximately 25%.

APRA has, since 2008, sought to strengthen major bank capital ratios through a number of adjustments to Risk Weighted Assets (RWA) across a variety of asset classes and risk types.

This has the effect of the reported capital ratio remaining broadly unchanged despite ADIs increasing the absolute amount of capital held.

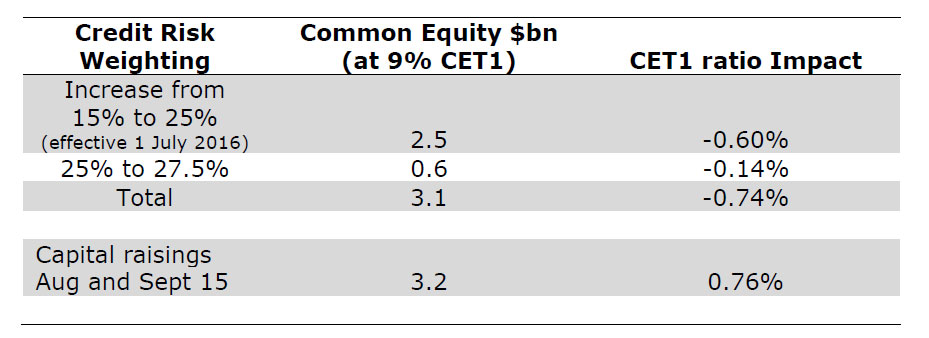
While the exact increase for ANZ remains uncertain, the table below sets out the impact of APRA’s previously announced changes and the possible impact of additional risk model changes, on ANZ’s Common Equity Tier-1 position (CET1), based on a credit risk weighting at the mid-point of the 25%-30% range recommended by the Financial Services Inquiry.

ANZ-TabeOn a proforma basis as at 30 June 2016, based on a credit risk weighting at the mid-point of the 25%-30% range, ANZ’s CET1 ratio would be   approximately 9.0% and the aggregate capital impact would be offset by the equity raising undertaken by ANZ in August and September 2015.

Any 1% increase or decrease from the mid-point would have an impact on the proforma CET1 ratio of approximately 0.06% and on Common Equity of approximately $250 million. ANZ believes that while the size of any increase in the RWA charge on Australian residential mortgages remains uncertain, it has the ability to meet its current stated capital objectives, including an internationally comparable capital position within the top quartile of international peers and an APRA CET1 ratio of approximately 9%.

ANZ’s previously announced capital plan includes:

Rebalancing the Group’s capital allocation by continuing to reduce the amount of capital allocated to its Institutional Banking business and reviewing certain assets in the portfolio. In 9 months to 30 June 2016, Institutional Banking’ s Credit Risk Weighted Assets have declined by $15 billion (on an FX adjusted basis) and ANZ has completed the sale of its Esanda dealer finance business.

Gradually reverting to the historical Dividend Payout Ratio range of 60-65% of annual Cash Profit as announced at the 1H16 Financial Results. Over time, ANZ expects that these and other initiatives will allow the Group to target a stronger balance sheet and capital structure. However alternatives such as providing a discount to the Dividend Reinvestment Plan (DRP) and/or DRP underwriting could provide additional flexibility if required.

APRA Reaffirms Revised Mortgage Risk Weight Target

The Australian Prudential Regulation Authority (APRA) has today reaffirmed its objective, announced in 2015, to raise Australian residential mortgage risk weights applied by banks using internal models to an average of at least 25 per cent.

Chess-Husing

In July 2015 APRA announced changes to the treatment of residential mortgages for banks able to use internal models for capital adequacy purposes. In particular, APRA adjusted the risk weight calculation used by authorised deposit-taking institutions (ADIs) accredited to use the internal ratings-based (IRB) approach to credit risk. The adjustment was intended to increase the average risk weight on Australian residential mortgage exposures, measured across all IRB ADIs, from approximately 16 per cent to an average of at least 25 per cent. The increase in IRB risk weights came into effect from 1 July 2016.

Subsequent to the announcement in July 2015, APRA has also required IRB ADIs to make a range of other changes to their models as part of its routine supervisory processes, with a view to improving their comparability, reliability and risk sensitivity. The impact of these modelling changes, when combined with the adjustment proposed in July 2015, would have been an average risk weight that was well in excess of the 25 per cent risk weight targeted by APRA in its original announcement.

APRA has therefore advised the relevant ADIs that it will recalibrate the adjustment advised in July 2015, with a view to ensuring the original target of an average risk weight for Australian residential mortgages of at least 25 per cent is achieved, while not significantly exceeding this target. In doing so, APRA has taken into account modelling changes that have been instituted, as well as some that are to be completed over the coming quarters; in some cases, this recalibration is conditional on the ADIs completing (offsetting) modelling improvements.

This adjustment to mortgage risk weights remains an interim measure, pending the outcome of the deliberations of the Basel Committee on Banking Supervision (Basel Committee) to finalise reforms to the capital adequacy framework, and APRA’s subsequent consideration of how those reforms should be applied in Australia. In the meantime, APRA continues to target an average residential mortgage risk weight for IRB banks of at least 25 per cent. As modelling changes work through the system, APRA expects the average across all IRB banks will vary somewhat over time, but still be consistent with the objective of achieving an average risk weight of at least 25 per cent.

Banks Are Still Chasing Home Loans

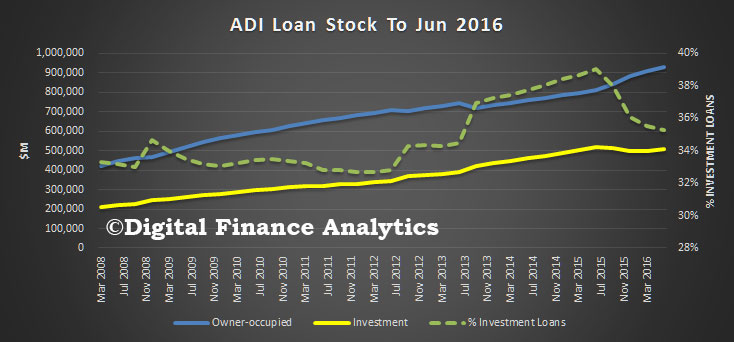
The latest data from APRA on the loan books of the banks shows that in June 2016, housing loans grew by $10.1 billion to $1,471 billion, up 0.69%. Owner occupied loans grew by $8.6 billion and investment loans by $1.5 billion.

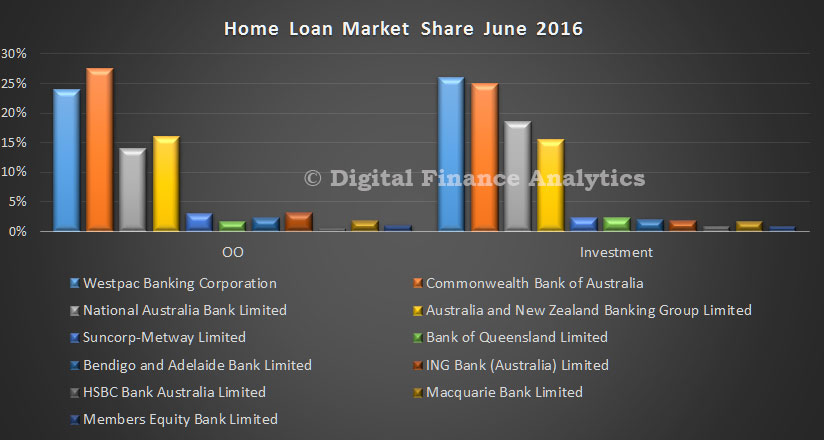
Looking at the individual banks, CBA maintains its first place position with owner occupied loans, Westpac, first place on investment loans.

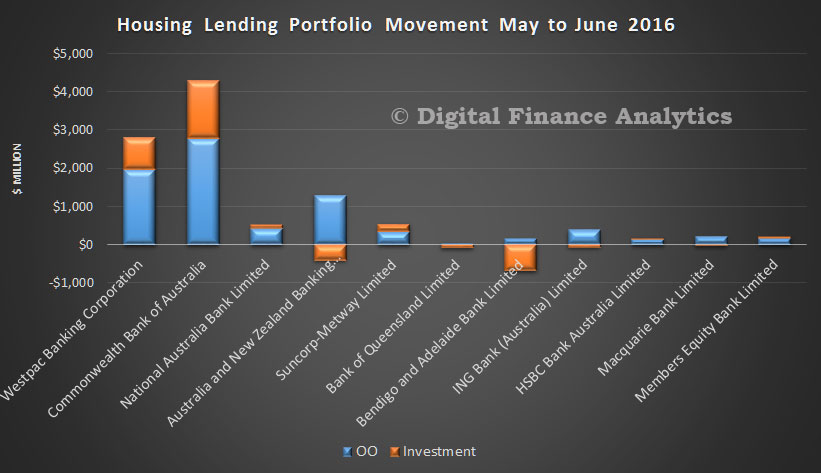
APRA-June-2016-1Loan portfolio movements show that CBA grew its overall book the most. However, bear in mind there were $1.3 billion of adjustments between classifications of loans in the month, so there is noise in the data.

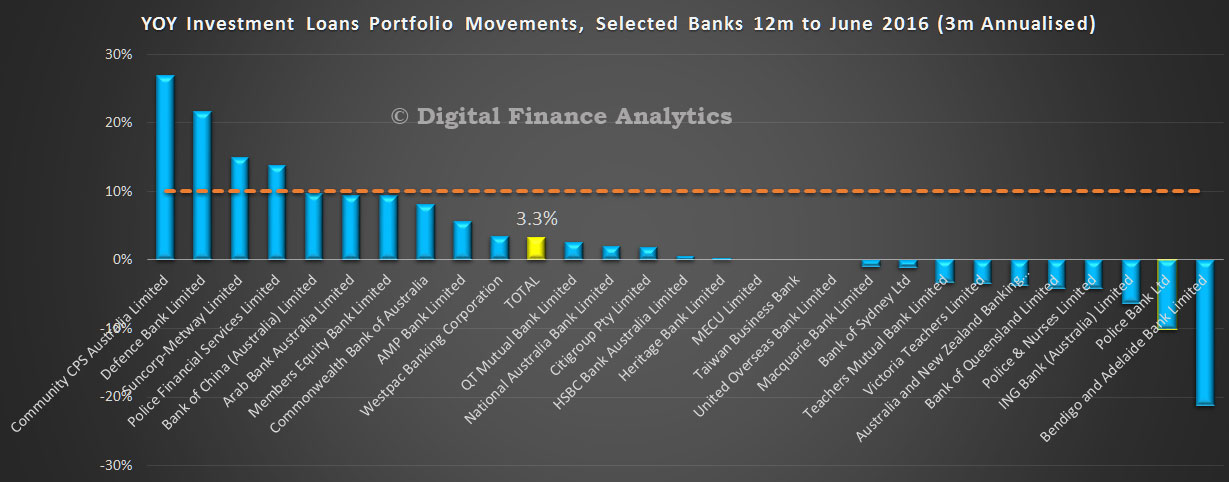
APRA-June-2016-2However, if we take this as right, we can estimate overall investment loans growth. We use the data from the past 3 months, and gross it up to 12 months, to remove some of the noise. On that basis, overall growth is 3.3%, and most players are well within the APRA 10% speed limit.

APRA-June-2016-3

The Implications of Brexit for Australia

The Council of Financial Regulators (CFR) has issued a report to Government on the potential impact of Brexit on the Australian economy. It takes into account developments up to and including Tuesday 5 July. They conclude that the outcome of the vote on 23 June represented an appreciable negative shock, but the impact on domestic and international financial systems and markets was well-contained and orderly. On the evidence to date, they say it suggests that the domestic and international financial reform agenda adopted following the financial crisis is on the right track.

The CFR is comprised of the Reserve Bank of Australia (RBA); the Australian Prudential Regulation Authority (APRA); the Australian Securities and Investments Commission (ASIC); and the Treasury. The report is informed by CFR agencies’ close consultation with their respective counterparts in the UK, Europe and other jurisdictions.

It is uncertain how the UK’s exit will proceed and what the associated impacts on the stability of the rest of the EU will be. This will be a source of continuing uncertainty and market volatility for some time, against the backdrop of an already fragile global economy. Significant shocks could also come from other sources. While the Australian financial system has weathered the immediate reaction to the vote well, the event underscores the importance of pressing ahead with further reforms to enhance our system’s resilience.

The short-run negative effect on economic activity in Australia, through channels such as reduced trade, lower commodity prices and financial linkages, is expected to be very limited for several reasons. The effect on global activity is expected to be small, Australian trade is oriented more towards Asia than Europe, and Australian banks have limited direct exposure to the UK and Europe and are well-placed to handle disruptions to funding markets.

The medium- to longer-term implications for the UK and Europe, and the global economy more broadly, will depend on the degree and persistence of uncertainty, and the length and outcome of negotiations on exit. In the UK, business investment growth was already weak prior to Brexit and is likely to weaken further, at least until the nature of any future trade agreement with the EU, by far the UK’s largest export market, is known. Some firms may also choose to relocate from the UK to EU countries if their businesses depend on access to the single market. Concerns over job security and negative wealth effects will be a drag on household spending. Prior to Brexit, the IMF indicated that should Britain vote to leave the EU, GDP in the EU could be lower by up to 0.5 percentage points and GDP in the rest of the world could be up to 0.2 percentage points lower by 2018.2 There is a significant degree of uncertainty around the estimated economic impact of Brexit. The IMF forecast a wide variation in output losses across individual economies, reflecting differing trade and financial exposures to the UK, as well as the policy space to respond to negative spill-overs.

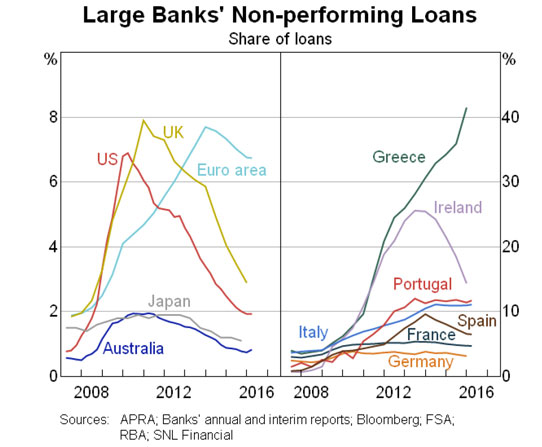
Beyond the central forecasts, the Brexit result has arguably added to global tail risks, particularly through heightened risk in Europe. The result could potentially strengthen exit momentum within euro area countries, which if successful would be considerably more disruptive given the common currency. Ongoing banking sector fragility also remains a potential trigger for political discord and financial instability. European banks have been grappling with weak profitability and a high stock of non-performing loans for many years, which has been reflected in low share price valuations. Market movements reflect increased apprehension about banks in a number of European countries post Brexit, most notably Italy, where the Italian Government has been denied permission by the EU to inject capital into its banking system. The newly established European bank resolution framework, which favours bail-in of private creditors and substantially precludes government support, is largely untested.

Brexit-LoansOverall, tail risk considerations aside, the implications of Brexit for the Australian economy are not likely to be significant, but will depend upon the nature and length of the transition to new arrangements. Australia has proved resilient during past periods of financial market volatility and remains well placed to manage the economic and financial market response from the UK referendum outcome. Additionally, Australia has a relatively small direct trade exposure to both the UK (2.8 per cent of goods and services exports) and the rest of the EU (4.6 per cent of goods and services exports). However, Australia’s major trading partners have larger exposures to these markets. For example, the EU (including the UK) accounts for 15.6 per cent of China’s goods  exports and 18.2 per cent of the US’s goods exports. A sharp slowdown in the EU economies with spill-overs into other major economies would place downward pressure on the demand for Australia’s exports.

The Australian economy may also be affected if the UK transition out of the EU is not orderly and uncertainty remains heightened for a significant period. This poses some downside risk to the domestic outlook, with negative wealth and confidence effects having the potential to affect household consumption and business investment.

The strengthening of the banking system’s capital position over recent years to meet the new ‘Basel III’ requirements represents a material increase in the banking sector’s ability to withstand a significant deterioration in asset quality. The Financial System Inquiry highlighted the importance of ensuring the soundness of the financial system. The Government endorsed its recommendation that capital standards be set such that bank capital ratios are ‘unquestionably strong’. While Australian banks are well-capitalised, a further increase in capital ratios is likely to be required over the coming years to satisfy the ‘unquestionably strong’ benchmark. The Government has also endorsed the implementation by APRA, over
time and in line with emerging international practice, a framework for loss absorbing and recapitalisation capacity.

APRA is also introducing further reforms to strengthen the resilience of the banking system. Of particular note, on 1 January 2018, APRA will implement the Basel III Net Stable Funding Ratio (NSFR) to discourage banks from being overly reliant on less stable sources of funding. The NSFR will be part of APRA’s prudential liquidity rules and will complement the Liquidity Coverage Ratio – introduced on 1 January 2015 – that requires banks to hold sufficient ‘high quality liquid assets’ to withstand a 30-day period of stress. APRA is currently consulting with the industry on the design of the NSFR and intends to finalise proposals by the end of 2016.

Consistent with the Government’s response to the FSI, further work is needed to clarify and strengthen regulators’ powers in the event a prudentially regulated financial entity or financial market infrastructure faces distress. A recent peer review by the Financial Stability Board identified some gaps and deficiencies in the Australian resolution framework and work is progressing on this as a matter of priority.

More broadly, such episodes of significant shocks and market volatility reinforce the value of Australia’s financial (and economic) policy frameworks. The separation of responsibility for prudential regulation and market conduct regulation (between APRA and ASIC), the operation of independent monetary policy and a floating exchange rate continue to serve us well.

APRA confirms its definition of high-quality liquid assets for the Liquidity Coverage Ratio requirement

The Australian Prudential Regulation Authority (APRA) has reviewed the range of assets that qualify for the Liquidity Coverage Ratio (LCR) for some authorised deposit-taking institutions (ADIs), and reconfirmed existing arrangements with an addition to eligible Level 1 assets.

Since 1 January 2015, ADIs subject to the LCR requirement are required to hold a stock of high quality liquid assets (HQLA) sufficient to survive a severe liquidity stress scenario lasting 30 days. There are two categories of assets that can be included in this stock:

  • Level 1 assets – limited to cash, central bank reserves and highest quality sovereign or quasi sovereign marketable instruments that are of undoubted liquidity, even during stressed market conditions; and
  • Level 2 assets (which can comprise no more than 40 per cent of the total stock) – limited to certain other sovereign or quasi sovereign marketable instruments, as well as certain types of corporate bonds and covered bonds, that also have a proven record as a reliable source of liquidity even during stressed market conditions.

Following a review of those assets that qualify for Level 1 and Level 2 assets, APRA has confirmed the existing definitions of HQLA for the LCR in Australia, which are:

  • the only assets that qualify as Level 1 assets are cash, balances held with the Reserve Bank of Australia, and Australian Government and semi government securities; and
  • there are no assets that qualify as Level 2 assets.

However, for the purposes of the LCR requirement, Australian government securities now include debt securities of the Export Finance and Insurance Corporation (EFIC). The debt securities of EFIC are high-quality marketable instruments that have a full guarantee by the Commonwealth of Australia.

APRA’s review assessed a range of marketable instruments denominated in Australian dollars against the eligibility criteria for HQLA. This assessment took a number of factors into account, including the amount of the instrument on issue, the degree to which the instrument is broadly or narrowly held, and the degree to which the instrument is traded in large, deep and active markets. APRA gives particular attention to the liquidity of the instrument during market disruptions such as occurred during the global financial crisis.

APRA will continue to review market developments in Australian dollar debt securities and vary its definition of HQLA if warranted.

The treatment of Level 1 and Level 2 assets for the purposes of the LCR requirement does not affect the set of instruments that the Reserve Bank of Australia (RBA) will accept as qualifying collateral for its committed secured liquidity facility. Qualifying collateral will comprise all assets eligible for repurchase transactions with the RBA under normal market conditions (click here for more details).

International capital comparison update – APRA

APRA has issued an update on Australian Bank capital ratios. They show that banks in Australia have lifted their capital base in the past year, (e.g. CET1 from 11.7% to 13.5% on an international comparison basis  at December 2015), but APRA also underscores the fact that even higher capital ratios will be required to meet tighter rules, and to ensure that local banks do not slip down the international ranking, so as to maintain their ratios as “unquestionably strong”. This is because regulators are driving ratios higher in many countries.

Higher capital costs of course, and in in the normal course of business, will lead to more expensive loans and lower returns to shareholders. We think dividends will be under pressure in the next couple of years.

It is also worth saying that APRA is disclosing aggregate data, so variations across individual banks will be masked. This makes an interesting comparison to data from the FED where the results of capital stress tests are reported at an institution level. We think APRA should report capital ratios by individual institution, but of course they won’t.

In July 2015, APRA published the Information Paper International capital comparison study (2015 study) as an important first step in addressing the Financial System Inquiry (FSI) recommendation to set capital standards such that Australian authorised deposit-taking institution (ADI) capital ratios are ‘unquestionably strong’.

In its final report, the FSI suggested that for banks to be regarded as unquestionably strong they should have capital ratios that position them in the top quartile of internationally-active banks. APRA’s 2015 study, which adjusted for differences in measurement methodology across jurisdictions and uses a number of different measures of capital strength, found that the Australian major banks were well-capitalised, but not in the top quartile of international peers.

In particular, APRA’s 2015 study found that, based on the major banks’ capital adequacy ratios at 30 June 2014, a 70 basis point (bp) increase in capital ratios would be required to position the major banks’ Common Equity Tier 1 (CET1) ratio at the international 75th percentile (i.e. the bottom of the top quartile) and that they would likely need to increase their capital adequacy ratios by a larger amount to be comfortably positioned in the top quartile over the medium to long term.

The Basel Committee on Banking Supervision (Basel Committee) recently published an updated quantitative impact study (QIS)1 including the capital ratios of internationally active banks as of 30 June 2015. Based on the same methodology used in APRA’s 2015 study and using the latest Basel QIS, APRA has recently reviewed the major banks’ relative position to their international peers. To incorporate the capital raisings undertaken by the major banks, particularly during the second half of 2015, this update is based on their capital ratios as at December 2015.

As detailed in APRA’s 2015 study, the major banks’ weighted average comparison CET1 ratio was estimated as 11.7 per cent as at June 2014. Chart 1 shows that by December 2015, this ratio had increased by 180 bps to 13.5 per cent. This increase was the result of a range of factors, but the largest single driver was the substantial capital raisings by the major banks in the latter part of 2015. The differential between the CET1 ratio under APRA’s requirements and the international comparison ratio also increased: in broad terms, the differential as at December 2015 was 350 basis points.

On a relative basis, the strengthening of the major banks’ CET1 ratios placed them, on average, at approximately 40 bps above the June 2015 Basel QIS 75th percentile of 13.1 per cent for Group 1 banks.2 The improvement in the relative position of the major banks in Chart 1 is likely to be somewhat overstated by the timing differences between the international (June 2015) and Australian (December 2015) data. On average, the 75th percentile CET1 ratio in the Basel QIS has tended to increase by approximately 25-35 basis points each half year, suggesting the 75th percentile would be somewhat higher had December 2015 QIS data been available to APRA. Nevertheless, notwithstanding this timing difference, the relative positioning of the Australian major banks’ CET1 ratios now seems broadly in line with the benchmark suggested by the FSI.

Chart 1: CET1 ratios of Basel QIS and major banks3

Bar graph showing CET1 ratios of major banks compared to the distribution of Basel QIS banks. The 2015 study bar shows the CET1 ratios of Australia (headline) at 8.6%, Australia (Basel QIS) at 9.6% and Australia (comparison ratio) at 11.7%. The 2016 update bar shows the CET1 ratios of Australia (headline) at 10.0%, Australia (Basel QIS) at 11.1% and Australia (comparison ratio) at 13.5%.Source: APRA data

Furthermore, since the 2015 study the relative position of the major banks’ other weighted average comparison capital ratios have improved compared to the distribution of Basel QIS Group 1 banks.4 As shown in Chart 2, the major banks’:

  • comparison Tier 1 ratio of 14.8 per cent is positioned in the top quartile as compared to the third quartile as at June 2014; and
  • comparison Total capital ratio of 16 per cent is positioned at the bottom of the top quartile as compared to the median of the distribution as at June 2014.

The relative position of the major banks’ Tier 1 Leverage ratio of 5.4 per cent has also increased to a level above the median (but still below the top quartile) of the distribution of Basel QIS Group 1 banks. This compares to the banks’ position below the median in the 2015 study.

Chart 2: Capital adequacy ratios of Basel QIS (June 2015) and major banks (Dec 2015)

Bar graph showing capital ratios of major banks compared to the distribution of Basel QIS banks. Total capital of Australia (headline) is 13.8%, Australia (Basel QIS) 13.1% and Australia (comparison ratio) 16.0%.Source: APRA data

As noted above the major banks have undertaken significant capital raisings since the 2015 study, which has significantly improved their capital adequacy positon relative to international peers. That said, the trend of international peer banks strengthening their capital ratios continues. Forthcoming international policy developments will also likely mean that Australian banks need to continue to improve their capital ratios in order to at least maintain, if not improve, their relative positioning. The final design and calibration of these reforms will not be decided until around the end of 2016, and it would be prudent for Australian ADIs to continue to plan for the likelihood of strengthened capital requirements in some areas.

As detailed in the 2015 study, APRA’s analysis on the relative positioning of major bank capital ratios is intended to inform, but not determine, its approach for setting capital adequacy requirements. Recent regulatory actions (such as that applying to mortgage risk weights announced in July 2015), and the resulting improvement in the major banks’ international capital comparison, provide the necessary time for APRA to consider the full range of factors that are relevant to satisfy the FSI’s unquestionably strong recommendation. Critically this includes assessing the impact of the Basel Committee reforms as they are finalised and considering how other measures of resilience, such as liquidity, funding, asset quality, and recovery and resolution planning can assist in achieving the FSI’s objective.

APRA intends to provide further insight to these broader considerations once the Basel Committee has completed its deliberations on the international framework around the end of 2016.

1 Basel Committee, Basel III monitoring report, March 2016.

2 Basel QIS Group 1 banks comprises approximately 100 internationally active banks with Tier 1 capital of more than 3 billion Euros.

3 In Charts 1 and 2 the Australia (headline) ratios are determined under APRA’s prudential framework. The Australia (Basel QIS) ratios are derived from the Basel QIS which requires banks to report their regulatory capital base in an internationally-consistent manner. The Australia (comparison ratio) ratios are calculated using the methodology set out in the 2015 study.

4 Consistent with the 2015 study the reported Basel QIS and comparison Tier 1 and comparison Total capital adequacy ratios have not been adjusted for the impact of transitional legacy capital as this issue affects banks in most jurisdictions. The major banks’ headline Total capital ratio is higher than their Basel QIS Total capital ratio as APRA’s framework allows for phasing out of legacy capital instruments

ADI’s Battle For Home Loans

The latest data from APRA provides an insight into the relative movements between players in the home loan market as well as the total book held by ADIs. The RBA today released their aggregate data to May. APRA data shows that total home loans by ADI’s grew by 0.9% in the month, from $1.45 trillion in April to $1.46 in May, up $13 billion. Of this $10.2 billion was for owner occupied loans and $2.8 billion for investment lending, which has gained momentum recently. Total owner occupied loans were worth $938 billion, and investment loans $524 billion, or 35.9% of book.

ADI-May-2016-typeLooking at the monthly movements in absolute dollar terms, CBA grew its book the most, with a hike in both owner occupied and investment lending. Westpac grew its owner occupied book more, compared with its investment loans book, though it still has the largest share.

ADI-May-2016--Mon-MovOverall the relative shares changed but slightly.

ADI-May-2016--ShareFinally, we cross-checked the speed limits for investment loans at 10% (not a squeak from APRA as to whether this limit still applies by the way). The majors are all well below, which gives them capacity to make more investor loans in coming months.  This is based on a 3 month rolling average, annualised. It will still be noisy, as more than $1bn of loans were switched between categories in the month.

ADI-May-2016.-Inv-Trendsjpg

APRA Tweaks, But Retains ADI Points of Presence Reporting

APRA has announced they will continue to report ADI’s point of presence data following a consultation paper last year, with some changes. We welcome this decision, because the data is a valuable resource for those tracking channel evolution and migration.

APRA received seven submissions from ADIs and industry associations in response to the proposals outlined in the discussion paper.

The submissions indicated support for retaining the PoP statistics, with limited feedback provided in relation to the proposed content and format of the streamlined PoP statistics.

Three submissions commented on the costs of the current PoP data collection, with one of the submissions including detailed costings. Based on these submissions, the transitional and ongoing costs of the PoP data collection appear to be small.

On the basis that most of the submissions supported retaining the statistics, and the relatively small costs of reporting, the benefit of publishing the statistics outweighs the ongoing compliance costs of submitting data on the proposed form.

After considering the submissions, APRA concluded that it should continue to collect and publish PoP statistics, but in a modified form. APRA therefore intends to implement the following revisions to the PoP statistics:

  1. establishing a tighter definition of other face-to-face points of presence, which will result in greater consistency of reporting of these service channels;
  2. removing the requirement to report non face-to-face points of presence;
  3. collecting more accurate locational data of the points of presence; and
  4. capturing additional information about the remoteness of these locations using the Australian Statistical Geography Standard.

To lessen the burden of reporting on the current PoP reporting form for 2016, APRA is issuing an exemption that will reduce the reporting requirements in relation to the number of service channels. This exemption will allow ADIs to report no more than the four service channel categories that will be included in the revised reporting form ARF 796: branches, other face-to-face points of presence, ATMs, and EFTPOS terminals. ADIs will not be required to provide information on non-face-to-face point of presence, such as unmanned branches, telephone banking, internet banking and call centres.

The first edition of the streamlined PoP statistics for the reporting period ending on 30 June 2017 will be published in late 2017. In the interim, APRA will release the current version of the PoP statistics for the reporting period ending on 30 June 2016, with reduced service channels 24 August 2016.

APRA eyes commercial lending

From Australian Broker.

Banking regulator APRA Is “dialling up” the scrutiny on banks’ commercial real estate lending after double-digit loan growth.

Charles Littrell, APRA’s executive general manager for supervisory support said the regulator was turning up the pressure amid fears of an apartment oversupply.

According to a report in The Australian, with estimates of a national oversupply of 70,000 apartments, Littrell said it was “not a bad time to be seeing banks strengthen the equity position in their balance sheet”.

Speaking at a Centre for International Finance and Regulation event yesterday, Littrell said commercial property had historically been what “goes wrong” for the banking system. Plus, there is now the added risk of becoming “so systemically concentrated”.

“In 1990 the four major banks had 40% of the banking market; now they’ve got 80%,” he told the event, The Australian has reported.

“They’re all in the same business model, they’re all hugely exposed to each other … and we don’t quite know what would happen if that business model gets whacked by external stress all at once.

“So there is a lot of conventional work at our end – focusing on sound lending and in fact now we’re dialling up our systemic supervisory focus on commercial real estate.”

Luci Ellis, the Reserve Bank head of financial stability, echoed APRA’s concerns. She told the event that commercial property and development was one area that lacked research since the global financial crisis to draw on.

“The thing that has tended to be the causal agent in a banking crisis, even though you saw something go wrong in housing prices, it was the property developers, it was the commercial real estate, these are the vectors of distress,” she said, according to The Australian.

According to Credit Suisse, total bank commercial real estate lending has boomed in the past three years, with exposures growing 10% to $214bn for the year to March, the highest rate of growth since the GFC.