Major Banks Under Pressure?

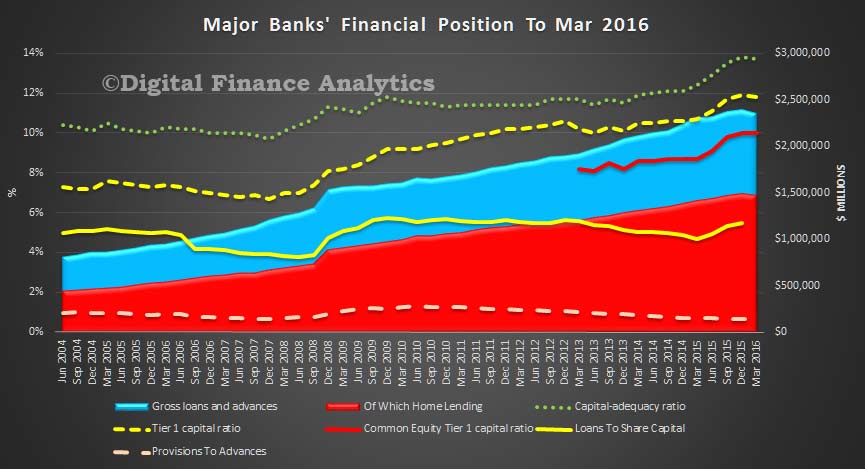
The latest data from APRA to March 2016 relating to the financial position of the banking sector, makes interesting reading. Net Profit after tax for the sector fell 12.5% to $30.8 billion, total assets rose 1.1% from March 2015 and the capital adequacy ratio rose 1.1% to 13.8%. Total provisions were down 13.9% compared with March 2015.

However, once again we have calculated some key ratios, and overlaid this over their loans and advances and there are a number of stresses revealed when we look at the four major banks. Their total provisions are lower despite a rise in consumer delinquency and specific commercial risks, capital adequacy is lower in the past quarter (despite all the raising), and the ratio of loans to share capital, while up slightly, is still lower than in 2010. The sector is under pressure and we think dividend payouts will have to fall and provisions will need to rise.

APRA-QFS-March-2016APRA says

  • on a consolidated group basis, there were 156 ADIs operating in Australia as at 31 March 2016, compared to 157 at 31 December 2015 and 165 at 31 March 2015.
  • The net profit after tax for all ADIs was $30.8 billion for the year ending 31 March 2016. This is a decrease of $4.4 billion (12.5 per cent) on the year ending 31 March 2015.
  • The cost-to-income ratio for all ADIs was 50.0 per cent for the year ending 31 March 2016, compared to 48.4 per cent for the year ending 31 March 2015.
  • The return on equity for all ADIs was 11.6 per cent for the year ending 31 March 2016, compared to 14.2 per cent for the year ending 31 March 2015.
  • The total assets for all ADIs was $4.53 trillion at 31 March 2016. This is an increase of $51.1 billion (1.1 per cent) on 31 March 2015.
  • The total gross loans and advances for all ADIs was $2.91 trillion as at 31 March 2016. This is an increase of $89.0 billion (3.2 per cent) on 31 March 2015.
  • The total capital ratio for all ADIs was 13.8 per cent at 31 March 2016, an increase from 12.7 per cent on 31 March 2015.
  • The common equity tier 1 ratio for all ADIs was 10.3 per cent at 31 March 2016, an increase from 9.2 per cent on
    31 March 2015.
  • The risk-weighted assets (RWA) for all ADIs was $1.83 trillion at 31 March 2016, an increase of $25.9 billion (1.4 per cent) on 31 March 2015.
  • Impaired facilities were $14.4 billion as at 31 March 2016. This is a decrease of $0.8 billion (5.2 per cent) on 31 March 2015.
  • Past due items were $12.5 billion as at 31 March 2016. This is an increase of $18.1 million (0.1 per cent) on 31 March 2015; Impaired facilities and past due items as a proportion of gross loans and advances was 0.93 per cent at 31 March 2016, a decrease from 0.98 per cent at 31 March 2015.
  • Specific provisions were $6.9 billion at 31 March 2016. This is a decrease of $16.7 million (0.2 per cent) on 31 March 2015; and specific provisions as a proportion of gross loans and advances was 0.24 per cent at 31 March 2016, a decrease from 0.25 per cent at 31 March 2015.

Brokers Are The Winners In The Home Loan Wars

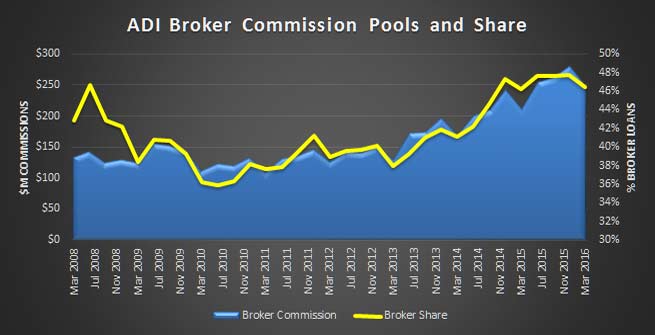
The latest Quarterly ADI Property Exposure stats from APRA paints an interesting picture of lending for residential property.  Total stock of loans across the 150 entities tracked was $1.4 trillion. In the last quarter, $81.7 billion of loans were approved, down by 1.2% a year ago but the average loan balance rose by 5% to $252,000 and the number of loans rose 4% compared with a year ago. Brokers received around $247m in upfront commissions in the quarter from ADIs and generated about 46% of loans by value. The current ASIC review of broker remuneration is therefore highly relevant.

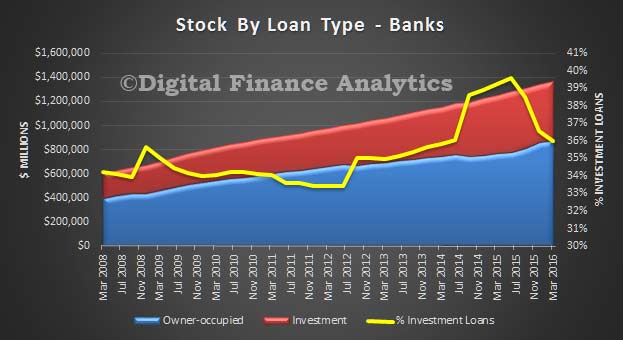
APRA-QP-March-2016-Broker-ComLooking at the banks, we see the mix of investment loans sitting at 36%, down from its high of 39% in 2015. The recent switches between owner occupied and investment loans – around $40 billion, shows in the results.

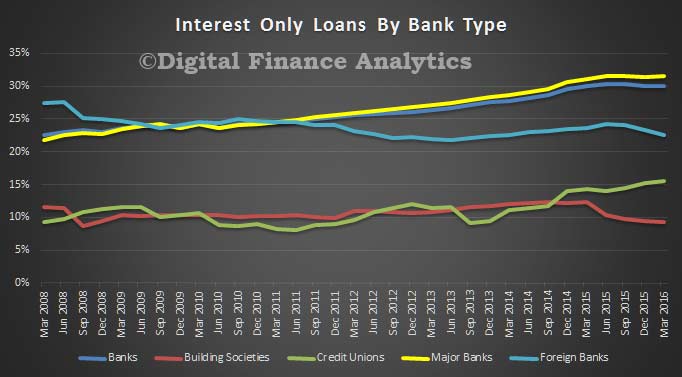
APRA-QP-March-2016-STOCKThe proportion of interest only loans, which at a portfolio level, is sitting at 30% is still close to the record of 30.3%. Interest only loans are taken by investors wanting to maximise their tax benefits, and owner occupied borrowers trying to reduce monthly repayments. Regulators have recently been concerned about the status of these loans, and now new loans have to have a repayment plan, even if interest only. What though of interest only loans written before the tighter standards?

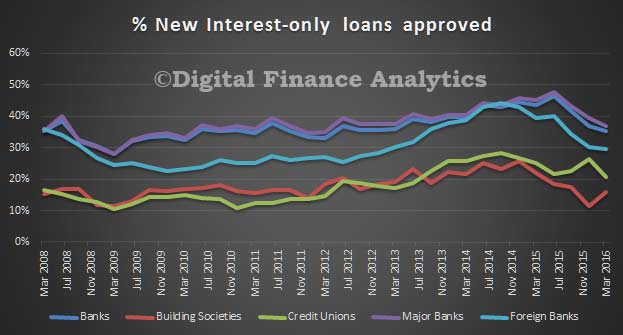
APRA-QP-March-2016-STOCK-IOIt is important to highlight that though the proportion of new loans being written on an interest only basis is around 35%, (from a peak of 43% in 2015), the major banks are still writing a larger share than portfolio, so expect to see continued growth in the interest only sector.

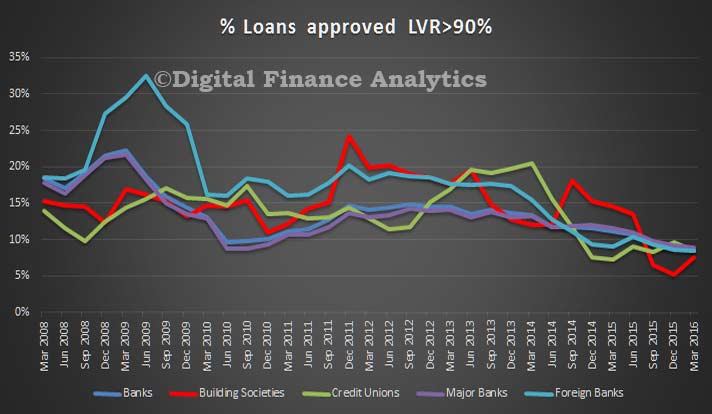
APRA-QP-March-2016-New-IOWe see the regulator’s hand when we look at the new loans, and those over 90% loan to value (LVR). Around 10% of loans are written above this threshold, whereas in 2008 banks lent more than 20% above this level. Also worth noting that credit unions and building societies had a spurt of higher LVR lending in 2013/15, as they completed for business.

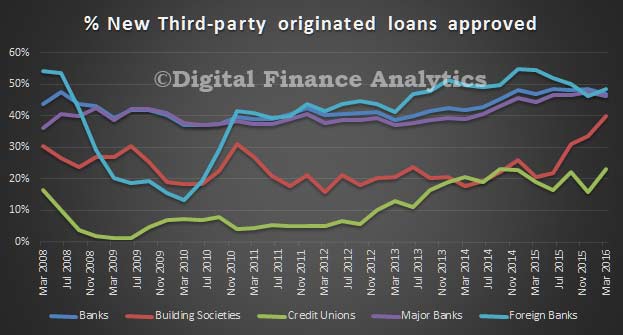
APRA-QP-March-2016-NEW-LVR-HiWe see a rise in the proportion of loans originated by brokers. Around 50% of new loans come though this channel. We also see a rise in the proportion of building societies using brokers, and credit unions are also on the train along with foreign banks. Brokers have become a significant influence in the market and lenders have to work with them (at the expense of loans via branch channels). This changes the competitive landscape, and the economics of loan origination.

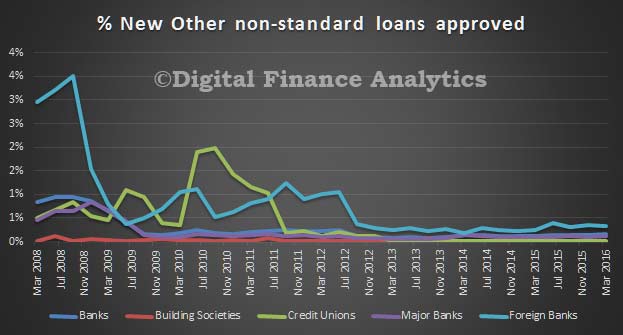
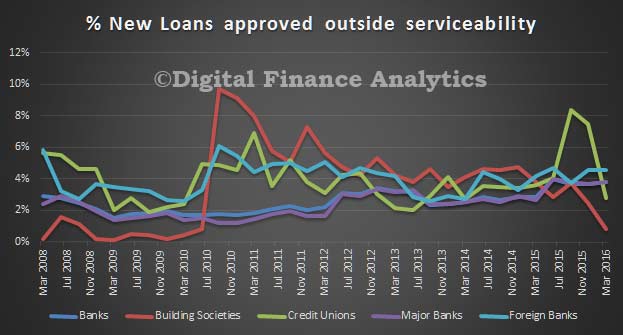
APRA-QP-March-2016-NEW-BrokerFinally, we see a fall in non-standard loans, though around 4% of new loans are still being written outside standard terms.

APRA-QP-March-2016-NEW-NonST APRA-QP-March-2016---New-Servicability

Westpac Turns The Property Investment Lending Tap On

Westpac has lifted the maximum LVR for investment loans to 90%, up from 80% (which was below many other lenders). With the largest share of investment loans they trimmed back their lending to the sector last year in order to get under the regulators 10% speed limit. Now the brakes are off, and with refinance growth slowing, and loans to overseas investors on the nose, lenders are targetting the investment sector.  Other underwriting parameters are still tighter than they were.

The Digital Finance Analytics household survey highlighted that demand from investors was on the rise, and last month there was more growth in investment loans, as investors gained renewed confidence in home price growth, and saw the prospect of negative gearing changes dissipate. The RBA’s rate cut was the gilt on the gingerbread.

Given that household lending appears to be the only game in town to force economic growth, it will be interesting to see how the RBA and APRA react to a resurgence in the more risky investment lending sector. They seem happy with a 7% annual growth in credit, a rate way higher than real incomes or inflation, meaning high household debt will go higher still.

Proposed Financial Institutions Supervisory Levies For 2016-7

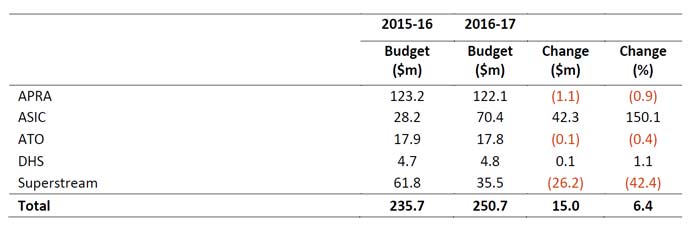
The financial industry levies are set to recover the operational costs of APRA and other specific costs incurred by certain Commonwealth agencies and departments, including the Australian Securities and Investments Commission, the Australian Taxation Office, and the Department of Human Services. ASIC gets a 150% uplift, reflecting the requirement for greater supervision of across financial services.

The Treasury has released a paper, prepared in conjunction with the Australian Prudential Regulation Authority (APRA), seeking submissions on the proposed financial institutions supervisory levies that will apply for the 2016-17 financial year by  Friday, 3 June 2016.

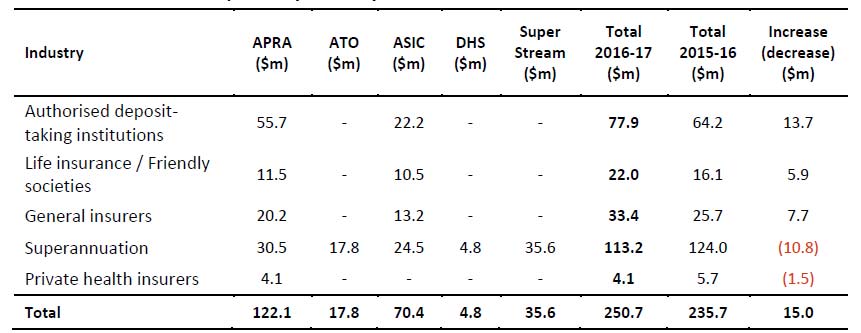
LeveyHere they are itemised by industry segment.

Levey1Australian Securities and Investments Commission component

A component of the levies is collected to partially offset ASIC’s regulatory costs in relation to consumer protection, financial literacy, regulatory and enforcement activities relating to the products and services of APRA regulated institutions as well as the operation of the Superannuation Complaints Tribunal (SCT). In addition, the levies are used to offset the cost of a number of Government initiatives including the over the counter (OTC) derivatives market supervision reforms and ASIC’s MoneySmart programmes.

$70.4 million will be recovered to offset ASIC regulatory costs through the levies in 2016-17. This amount is 150.1 per cent more than in 2015-16 as a consequence of the Government’s decisions to provide funding to the SCT to deal with legacy complaints and improve processes and infrastructure ($5.2 million) and to bolster ASIC to protect Australian consumers ($37.0 million).

As part of the improving outcomes in financial services package, the Government will:

  • invest $61.1 million over four years to enhance ASIC’s data analytics and surveillance capabilities as well as modernise ASIC’s data management systems;
  • provide ASIC with $57.0 million over four years to enable increased surveillance and enforcement in the areas of financial advice, responsible lending, life insurance and breach reporting; and
  • accelerate the implementation of a number of key measures recommended by the Financial System Inquiry.

From 2017-18 onwards, ASIC’s regulatory costs will be recovered from all industry sectors regulated by ASIC. The Government will consult extensively with industry to refine and settle an industry funding model for ASIC.

Australian Taxation Office component

Funding from the levies collected from the superannuation industry includes a component to cover the ATO’s regulatory costs in administering the Superannuation Lost Member Register (LMR) and Unclaimed Superannuation Money (USM) frameworks. In 2016-17, it is estimated that the total cost to the ATO in undertaking these functions will be $17.8 million, with the full amount to be recovered through the levies in line with the requirements of the Government’s Charging Framework.

The majority of this funding supports the ATO’s activities, which include:

  • the implementation of strategies to reunite individuals with lost and unclaimed superannuation money including promotion of the ATO On Line Individuals Portal and targeted SMS/e mail campaigns;
  • working collaboratively with funds to engage members being reunited with their super, including Super Match and providing funds with updated contact information about their lost members;
  • processing of lodgements, statements and other associated account activities;
  • processing of claims and payments, including the recovery of overpayments;reviewing and improving the integrity of data on the LMR and in the USM system; and
  • reviewing and improving data matching techniques, which facilitates the display of lost and unclaimed accounts on the ATO On Line Individuals Portal.

The funding also supports the ongoing upkeep and enhancement of the ATO’s administrative system for USM frameworks and the LMR, and for continued work to improve efficiency and automate processing where applicable.

Department of Human Services component

The Department of Human Services administers the Early Release of Superannuation Benefits on Compassionate Grounds programme (ERSB). The compassionate grounds enable the Regulator (the Chief Executive of Medicare) to consider the early release of a person’s preserved superannuation in specified circumstances.

The volume of ERSB applications has significantly increased since it was made possible to apply online. In 2015-16, the ERSB received 27,688 applications. This was a 44 per cent increase compared with the previous year. In 2016-17, the ERSB is forecast to receive approximately 38,763 applications. This will represent an approximate increase in volume of 40 per cent compared with the previous year.

The programme is expected to cost the Government $4.8 million in 2016-17. In line with the Government’s Charging Framework, this amount will be recovered in full through the levies.

SuperStream component

Announced as part of the former Government’s Stronger Super reforms, SuperStream is a collection of measures that are designed to deliver greater efficiency in back-office processing across the superannuation industry. Superannuation funds will benefit from standardised and simplified data and payment administration processes when dealing with employers and other funds and from easier matching and consolidation of superannuation accounts. The costs associated with the implementation of the SuperStream measures are to be collected as part of the levies on superannuation funds. The levies will recover the full cost of the implementation of the SuperStream reforms and are to be imposed as a temporary levy on APRA-regulated superannuation entities from 2012-13 to 2017-18 inclusive.

The costs associated with the implementation of the SuperStream reforms are estimated to be $35.5 million in 2016-17 and $32.0 million in 2017-18.

Bank Home Lending Credit Growth Continues

The latest data from APRA reporting home lending to end March shows total ADI balances grew by $9.5 bn to $1,441,253, a rise of 0.67% in the month, which is an annualised rate of 7.9%. Superficially, $8.2.billion was for owner occupation and $1.3 billion for investment home purchase but the RBA warned that $1.5 bn was due to loan reclassification between OO and INV loans so there is still noise in the system.

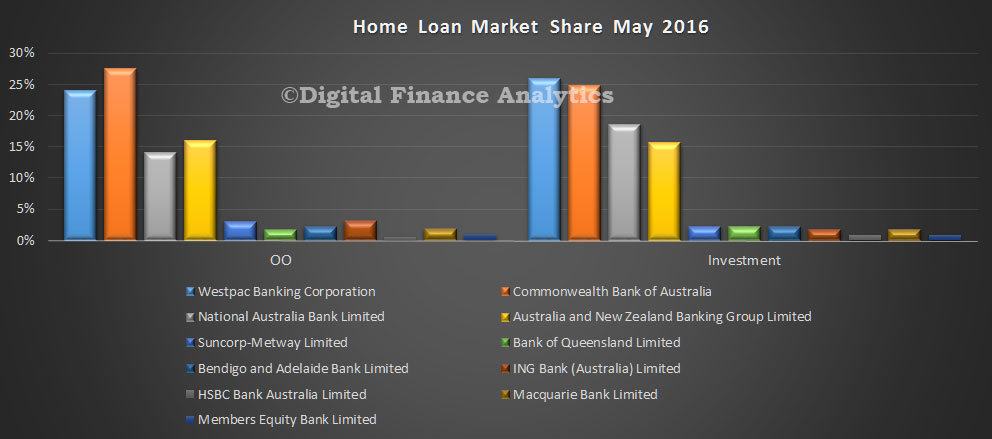
There was little net market share movement among the larger players. CBA still has the largest share of owner occupation loans, and Westpac of investment loans.

APRA-March-2016---Home-SharesThe value of portfolio movements shows the focus on owner occupied lending, compared with investment loans. Perhaps.ANZ’s fall in investment loans could signal a reclassification?

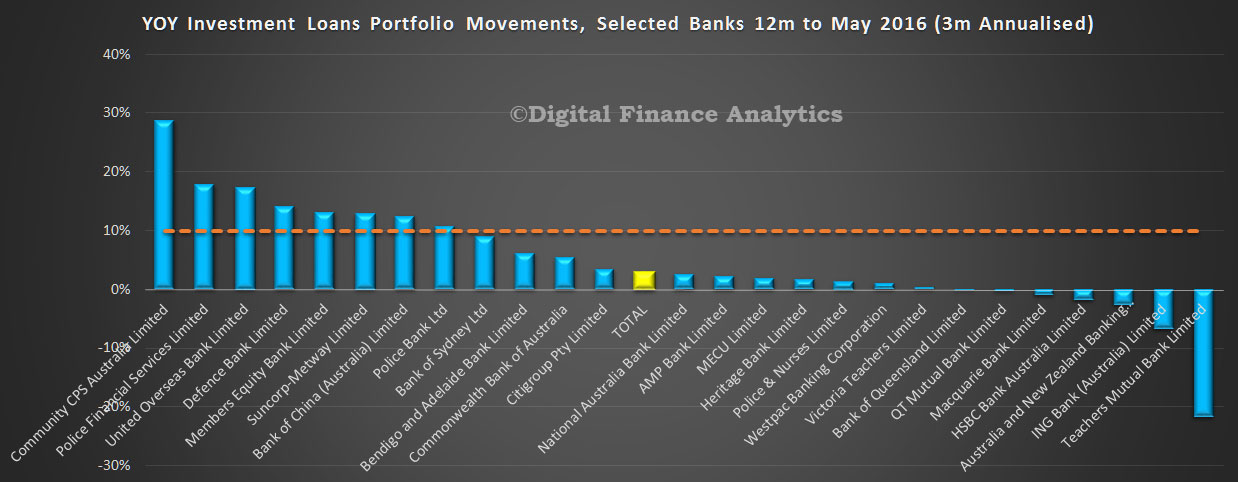
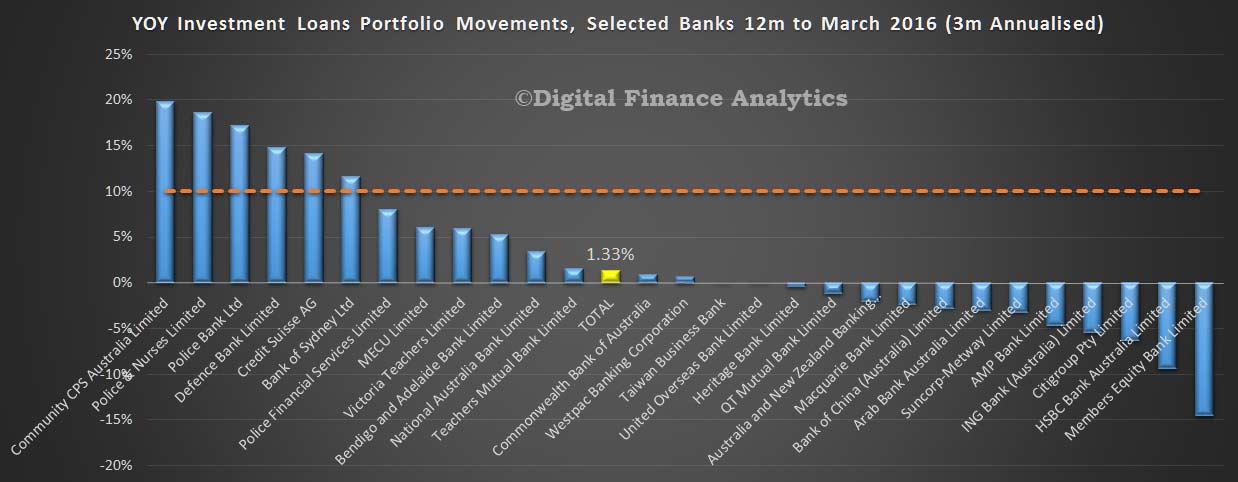
APRA-March-2016---Home-Share-MovcementsLooking at the growth in investment loans in terms of the APRA 10% speed limit, calculating movements on a 3 month annualised basis, against a market movement of 1.33%, NAB has growth above system, whilst the other major players are below system. Some smaller players continue to write high volumes of investment loans.

Investment-Growth-April-2016-By-Bank

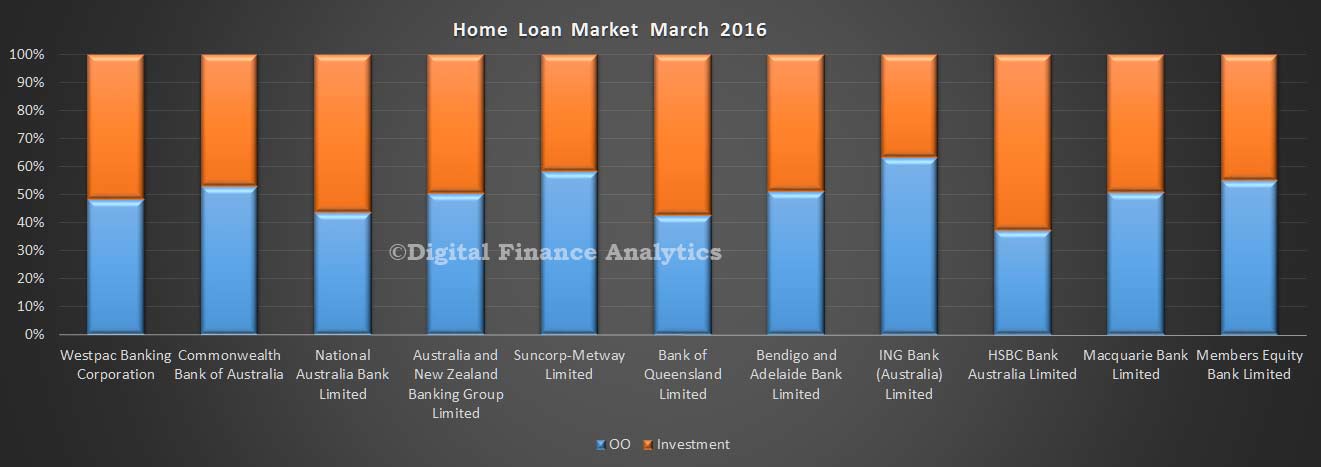
Finally we look at the relative share by loan type. This chart takes the relative percentages for owner occupied and investment loans by bank. It does not show the relative value, but the relative share (which we think is a more important lens).

Share-Splits-Mar-2016-APRAWe will not post on the deposit or credit card portfolios as there is little to see this month.


Life Insurance Industry In Review – APRA

APRA has released a submission made to the Senate Economics Committee relating to the life insurance industry. They highlight significant issues relating to risk assessment, pricing and profitability. Reinsurance is also a significant focus, as these entities took a number of hits. Legacy products are a significant problem. Here is a summary of the submission, with content reordered to make the information more digestible.

The most common products provided by life insurers are death cover, total permanent disability (TPD), trauma, and income protection.  Annuities are also provided by some insurers.

  • Life Insurance Death Cover pays a lump sum to the policy owner. If the policy owner and the life insured are one and the same then often beneficiaries would be a partner or child upon the death of the life insured. In some cases, a terminal illness benefit may be available and is an advancement of the death cover paid if the insured is medically certified as being terminally ill within a defined period (usually 12 or 24 months).
  • Total Permanent Disability – known as TPD – pays a lump sum if the insured becomes totally and permanently disabled.
  • Trauma provides payment if the insured person is diagnosed with a specified illness or injury. These policies include the major illnesses or injuries that will make a significant impact on a person’s life, such as cancer or a stroke.
  • Income Protection replaces the income lost due to a person’s temporary inability to work due to injury or sickness. Sometimes also referred to as disability income insurance or salary continuance insurance.
  • Annuity: An investment product providing a guaranteed income for either a fixed term or the lifetime of the policy holder.

Life insurance business can be divided into three groups according to the type of policyholder.

  • Individual risk insurance: This insurance is sold to the final consumer directly or via a financial advisor. Individual consumers can choose whether to hold one or a range of life products listed above. The Life Insurance Act contains specific restrictions that significantly limit the ability of the life company to re-price the policy or change its terms and conditions.  The policy holder is entitled to a guaranteed renewal of their policy.
  • Group risk insurance: This insurance is sold to superannuation funds to provide cover to their members. Group insurers provide a default level of automatic cover, usually including TPD and death cover and sometimes income protection cover, to the trustee. The policyholder is the trustee of the fund who contracts the insurance on behalf of the membership. The terms, conditions and pricing of the policy are typically periodically re-negotiated periodically between the insurer and the trustee.
  • Reinsurance: is insurance that is purchased by an insurance company (the cedant) from one or more other insurance companies (the “reinsurer”) as a means of risk management. The cedant and the reinsurer enter into a reinsurance agreement which details the conditions upon which the reinsurer would pay a share of the claims incurred by the ceding company in exchange for a premium.

As at 20 August 2015, there were 28 authorised life insurance companies.  Insurers are comprised of a number of distinct groups: 8 large diversified insurers, 4 insurance risk or annuity specialists, 9 relatively small or niche market players and 7 reinsurers. The number of life insurers has reduced in the past decade in a continuation of a steady trend that began around 1990, when the number of licences peaked at 61. Since that time, mutually-owned insurers – which were once the largest life insurers in the market – have largely disappeared, while the banking industry has developed a prominent role in the ownership of life insurance and wealth management businesses more generally.
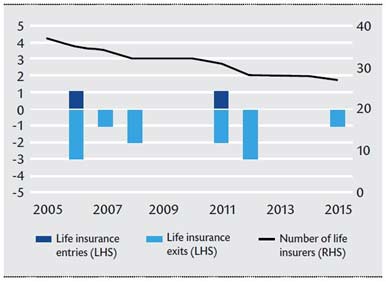
Life-Insurance-NumbersSome reinsurers both reinsure and sell life insurance directly. Many large insurers that provide individual life policies also provide group insurance to superannuation fund trustees but there are a number of insurers that largely specialise in servicing the group insurance market.  Most insurers offer both life lump sum (TPD and Death) and income protection policies.

Although the life insurance industry continues to operate with an adequate excess of capital above minimum regulatory requirements, the profitability of the life insurance sector has been under strain in recent years. Weak profitability has been driven by, in particular, the mispricing of risk which resulted in losses for insurers during 2013-14:

  • group risk insurers experienced higher-than-expected lump sum disablement (TPD) claims payouts which generated substantial losses in 2013, with some reinsurers being particularly affected; and
  • individual disability income business was the most significant source of losses in 2014.

In addition to the issues above, the industry has had to deal with a challenging external environment, including ongoing financial market volatility, persistently low interest rates, and pressures on overall industry operating efficiency. Some insurers have managed these challenges better than others. In particular, those insurers with a strong risk management framework, an effective risk appetite statement and a robust approach to capital management have proven best able to manage and adapt to operating conditions.

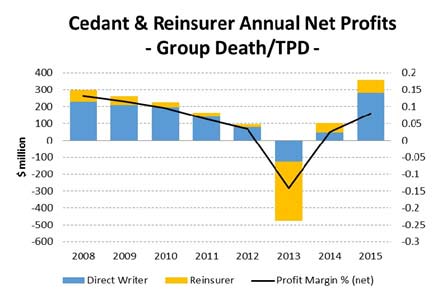
Poor risk management over time led to claims payouts exceeded the premiums collected for group total disability and group income protection, lines of insurance during 2013 and individual total disability and life in 2014. Reinsurers provided reinsurance on generous terms to these insurers, in effect allowing poor underwriting and risk management practices. As a result, reinsurers bore most of the losses during this period.

This outcome is not sustainable in the long term. Consumers of long-term products such as life insurance are ultimately best served if insurers are financially sustainable, thereby enabling firms to deliver on their long-term promises. There were various reasons for losses including :

  • underwriting and pricing practices in both the life insurance and reinsurance industry left both the direct and reinsurance market exposed to adverse movement in market conditions. In particular, thin margins were exposed by pricing that did not properly align with the policy benefits. A notable example was a trend whereby default coverage increased in group life schemes, but the underlying premium rates did not increase, and in many case fell, despite the increased exposure;
  • decreases in global interest rates reduced investment returns;
  • competitive tension in group life market tendering saw the process often weighted toward acquisition and retention of business rather than sustainability; and
  • increased plaintiff solicitor involvement drove an increase in lump sum total permanent disability (TPD) claims. The resulting increase in claims has been seen, in part, as a correction of a rate of claims which may not have accurately reflected the industry’s underlying exposure. For instance, prior to targeted marketing by plaintiffs’ firms, individual members may not have been aware of their available cover. An increase in the number of TPD claims related to mental illness and other complicated injuries, and changing community standards as to what conditions give rise to claims, has also resulted in more claims payments and requires greater claims management and resourcing.

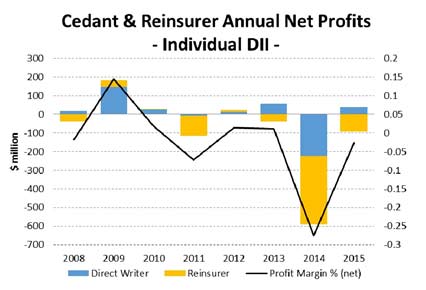
The reinsurers seem to have carried a disproportionate share of the losses.  Reinsurers incurred more than half of the total group death and TPD losses in 2013.  Followed by significant losses in 2014 for individual disability income. This raises the question about the nature of the reinsurance arrangement in place and the role reinsurers may have played in the poor overall performance. Reinsurance-1
Reinsurance-2 Reinsurers sought to mitigate the adverse impact of the poor experience on their financial position by significantly reducing or even ceasing to write or tender for new business. This in turn lead to an increase in prices for policyholders and/or a tightening of coverage, where permitted, which has inevitably been passed on to policyholders. Changes made by insurers include:

  • no longer making ‘opt-in’ offers that allow members to take or increase cover with little or no evidence of health status;
  • increasing the length of the ‘at work’ period for members to become eligible for cover (e.g. from one day to one month);
  • tightening the definition of TPD (for example, from ‘unlikely to work’ to ‘unable to work’);
  • introducing severity-based TPD benefits;
  • introducing TPD benefits payable via instalments rather than as a lump sum;
  • reducing default TPD benefits and increasing default GSC benefits;
  • reducing automatic acceptance limits;
  • making greater use of health questions for optional cover; and
  • making greater use of exclusions for pre-existing conditions, hazardous occupations, suicides and pandemics.

APRA has observed that many insurers chose to increase premiums to improve profitability. While some premium increase may be needed to ensure pricing is sustainable following a period in which premiums were insufficient to reflect risk, in APRA’s view, these increases do not by themselves address the structural reasons that led to the underlying problems and have produced an unexpected increase in the cost of insurance for superannuation fund members.

One area of potential change identified by APRA relevant to this Inquiry is the introduction of a mechanism to allow the rationalisation of legacy products to occur more easily. Legacy products arise particularly in life insurance and superannuation, where the financial products often last a lifetime, but the financial, legal and social environment continually changes.  In addition, the life insurance sector has undergone a significant consolidation over the past 20 years, leading to many duplicated and outdated products. The industry is still grappling with the challenge of addressing those issues.

Life insurers regularly introduce new products to better reflect consumer demand and changed market conditions; while the previous products (legacy products) are typically no longer made available for new business. However, these legacy policies must continue to be administered in accordance with the original contract terms.

Over time, legacy products become more complex and expensive to administer and may no longer meet the requirements of the beneficiaries. Industry estimates suggest that approximately 25 per cent of all funds under management are in legacy products.  The cost of these legacy products is ultimately borne by the policyholders.

As life insurance products involve a contract between the life insurer and the policyholder, terms cannot be unilaterally modified by either party to the contract. Consequently, it is very difficult to rationalise legacy products in the absence of a legislative mechanism, as each policyholder would need to consent to any changes. In the case of individual risk business, a policyholder may not be able switch to a newer product or provider readily, as their health status may have changed in the interim meaning that they either cannot obtain replacement insurance or can only do so at significantly increased cost.

There is a range of very complex legal, consumer and tax issues that arise if a life insurer seeks to move policyholders from a legacy product to a new product, restricting the ability of insurers to close legacy products. The benefits of a simpler, though still robust, mechanism to rationalise legacy financial products has been recognised for some time. The issue was, for example, a recommendation of the Report of the Taskforce on Reducing Regulatory Burdens on Business in 2006. As noted in the Financial System Inquiry Final Report, between 2007 and 2010 Government worked with industry to develop a mechanism to facilitate product rationalisation. However, such a mechanism was not finalised or implemented.

The mechanism would have facilitated rationalisation of genuine legacy products — that is, not simply those that are performing poorly — subject to a ‘no disadvantage test’ for relevant consumers. It would also have provided tax relief to ensure consumers were not disadvantaged as a result of triggering an early capital gains tax event.

Where Did The 10% Investor Mortgage Growth Speed Limit Come From?

An interesting FOI disclosure from the RBA tells us something about the discussions which went on within the regulators in 2014 and beyond, as they considered the impact of the rise in investor loans. Eventually of course APRA set a 10% speed limit, and we have see the growth in investment loans slow significantly and underwriting standards tightened.

Back then, they discussed the risks of investment lending rising, especially in Melbourne.

Macroeconomic: Extra speculative demand can amplify the property price cycle and increase the potential for prices to fall later. Such a fall would affect household spending and wealth. This effect is likely to be spread across a broader range of households than the investors that contributed to the heightened activity.

Concentration risk: Lending has been concentrated in Sydney and Melbourne, creating a concentrated exposure in these cities. The risk could come from a state-based economic shock, or if the speculative upswing in demand brings forth an increase in construction on a scale that leads to a future overhang of supply. In Sydney, the risk of oversupply appears limited because of the pick-up in construction follows a period of limited new supply and it has been spread geographically and by dwelling type. While the unemployment rate has picked up a little over the past 18 months, the overall economic environment in NSW is in a fairly good state. In Melbourne, there has been a greater geographic concentration of higher-density construction in inner-city areas. Some developments have a concentration of smaller-sized apartments that may only appeal to some renters, or purchasers in the secondary market. Economic conditions are not as favourable in Victoria and the unemployment rate is 6.8%.

Low interest rate environment: While a pick-up in risk appetite of households is to some extent an expected outcome given the low interest rate environment, their revealed preference is to direct investment into the housing market.  Historically low interest rates (combined with rising housing prices and strong price competition in the mortgage market) means that some households may attempt to take out loans that they would not be able to comfortably service in a higher interest rate environment. APRA’s draft Prudential Practice Guide (PPG) emphasises that ADIs should apply an interest rate add-on to the mortgage rate, in conjunction with an interest rate floor in assessing a borrower’s capacity to service the loan. In order to maintain the risk profile of borrowers when interest rates are declining, the size of the add-on needs to increase (or the floor needs to be sufficiently high).

Lending standards: In aggregate, banks’ lending standards have been holding fairly steady overall; lending in some loan segments has eased a little, while lending in some other segments has tightened up a bit. The main lending standard of concern is the share of interest-only lending, both to owner-occupiers and investors. For investors, 64% of banks’ new lending is interest-only loans and for owner-occupiers the share is 31%. The typical interest-only period is 5 years, but some banks allow the interest-only period to extend to 15 years. During this period, the loan is amortising more slowly than a loan that requires principal and interest (P&I) payments. If housing prices should fall, this increases the risk that the loan balance may exceed the property value (negative equity). There is some risk that the borrower could face difficulty servicing the higher P&I payments when the interest-only period ends, although this is typically mitigated by banks assessing interest-only borrowers on their ability to make P&I payments.

Of course the regulators found underwriting standards were more generous than they thought, at times in 2015 more than half of all new loans were investment loans, and recently banks have reclassified loans, causing the absolute proportion of investment loans to rise. Things were whose than they thought.

Next they discussed how to set the “right” growth rate:

How to calibrate the benchmark growth rate?  Household debt has been broadly stable as a share of income for about a decade. National aggregate ratios are not robust indicators of a sector’s resilience because the distribution of debt and income can change over time. But as a first pass, it is reasonable to expect that the current level of the indebtedness ratio is sustainable in a range of macroeconomic circumstances. Therefore there does not seem to be a case to set the benchmark growth rate significantly below the rate of growth of household income, in order to achieve a material decline in the indebtedness ratio. With growth in nominal household disposable income running at a little above 3 per cent, this sets a lower bound for possible benchmarks at around 3 per cent. Current growth in investor credit, at nearly 10 per cent, suggests an upper bound around 8 per cent to achieve
some comfort about the leverage in this market. Within this range, there are several options for the preferred benchmark rate for investor housing credit growth (including securitised credit).

a) Around 4½ per cent, based on projected household disposable income growth over calendar 2015. This could be justified as being consistent with stabilising the indebtedness ratio. However, it would be procyclical, in that it would be responding to a period of slow income growth by insisting that credit growth also slow. It would also be materially slower than the current rate of owner-occupier credit growth, which so far has not raised systemic concerns.

b) Around 6 per cent, based on a reasonable expectation of trend growth in disposable income, once the effects of the decline in the terms of trade have washed through. It is also broadly consistent with current growth in owner-occupier housing credit, which as noted above has not been seen as adding materially to systemic risk.

c) 7 per cent, consistent with the system profile for residential mortgage lending already agreed as part of the LCR/CLF process. Unless owner-occupier lending actually picks up from its current rate, however, the growth in investor housing credit implied by the CLF projections would be stronger than this. It is therefore not clear that these projections should be the basis for the preferred benchmark.

Staff projections suggest that only a moderate decline in system investor loan approvals would be required to meet a benchmark growth rate for investor housing credit in the 5–7 per cent range for calendar 2015. The exact size of the decline depends partly on assumptions about repayments through churn, refinancing and amortisation in the investor housing book. For a reasonable range of values for this implied repayment rate, and assuming that investor housing credit growth remains at its current rate for the remainder of 2014, the required decline in investor approvals is of the order of 10–20 per cent. This would take the level of investor housing loan approvals back to that seen a year ago. It is worth noting that investor loan approvals would have to increase noticeably from here to sustain the current growth rate of investor housing credit, even though the implied repayment rate is a little below its historical average. Since credit is not available at a state level, the benchmark can only be expressed as a national growth rate. The flow of loan approvals at a state level can be used as a cross-check to ensure that the benchmark incentive has had its greatest effects in the markets that have been strongest recently.

When the 10% cap (note this is higher than those bands discussed above) was announced, some Q&A’s provide some insights into their thinking.

Isn’t 10 per cent a bit soft?  We are not trying to kill the market stone dead. Investor housing credit is currently running at a bit under 10 per cent. Some lenders will have investor credit growth well below this benchmark anyway, so if all lenders do end up at least a little under this benchmark, which we hope they will, then aggregate growth in investor credit will be noticeably below 10 per cent. Setting a benchmark for individual institutions is not the same thing as setting it for an aggregate, and APRA has allowed for that.

Where did the 10 per cent benchmark come from?  This was a collective assessment by the Council agencies. We took the view that we did not want to clamp down on the market excessively. We also took the view that in the long run, household credit can expand sustainably at a rate something like the rate of trend nominal household income growth, maybe a bit more or less in shorter periods. Trend income growth is below 10 per cent, more like 6 per cent or thereabouts. But it was important to make an allowance for the fact that some lenders will undershoot the benchmark, so the aggregate result will likely be slower than that.

But isn’t household income growth likely to be below average in the next few years, because of the end of the mining boom?  Maybe, but we don’t want to be procyclical and clamp down on credit supply more when the economy growing below trend.

This of course confirms the regulators were wanting to use household debt as an economic growth engine (interesting, see the recent post “Why more-finance-is-the-wrong-medicine-for-our-growth-problem” )

We also see a significant slow down in household income growth, yet credit growth, especially housing has been stronger, creating higher risks if interest rates or unemployment was to rise. Raises the question, were the regulators too slow to act, and did they calibrate their interventions correctly? We will see.


APRA releases Trio investigation report

The Australian Prudential Regulation Authority (APRA) has released the report on its investigation into the failure of Trio Capital Limited (Trio), as a result of which APRA removed 13 former Trio directors from the superannuation industry for specified periods of time.

These 13 individuals were Trio Directors between 2003 and 2009, and APRA’s enforceable undertakings have prevented them from holding senior roles in the APRA-regulated superannuation industry for periods between 3 years 6 months and 15 years (with one having no expiry date).

APRA’s view is that, given the wide interest in this matter over a number of years, it is appropriate to release the investigation report as it provides a concise summary of the circumstances surrounding the collapse of Trio, together with an overview of APRA’s regulatory actions following the collapse.

The release of APRA’s investigation report follows the publication in May 2015 of final reports from the Trio liquidator and with the final steps in the winding up of Trio’s five registerable superannuation entities in progress.

APRA’s investigation focussed on six related-party investments totalling approximately $150 million, all of which were lost or unable to be recovered.  This included losses associated with investments in the Astarra Strategic Fund (ASF) as a result of fraudulent conduct.

The outcomes of the Trio investigation provide important lessons for trustees more broadly. APRA considers the significant investment losses can be attributed to a number of key factors:

  • inadequate investment governance processes;
  • failure to adequately manage conflicts of interest from dealings with related parties; and
  • failure to have adequate controls to mitigate fraud-related investment risk.

Since the Trio matter there have been a number of important enhancements to the regulation of the superannuation industry which impact directly on these three critical areas. These include introduction of prudential standards in superannuation, additional statutory duties imposed on trustees and directors, and further guidance provided by APRA on fraud risk management. Further detail on the lessons for trustees arising from the Trio investigation is available on APRA’s website at: www.apra.gov.au/Super/Publications/Pages/Other-Information-for-Superannuation.aspx

A copy of the investigation report is available on APRA’s website at: www.apra.gov.au/Super/Publications/Pages/Other-Information-for-Superannuation.aspx

Copies of APRA’s media releases announcing the enforceable undertakings of the 13 former Trio directors are available at: www.apra.gov.au/MediaReleases/Pages/13_34.aspx

Background

Q: What were the main outcomes of the investigation?
A: APRA accepted enforceable undertakings from 13 individuals, who were Trio directors between 2003 and 2009.  The enforceable undertakings effectively removed these individuals from holding senior roles in the APRA-regulated superannuation industry for periods between 3 years 6 months and 15 years (with one having no expiry date).

Q: What were the main areas of conduct by Trio directors that the investigation focused on?
A: The investigation focused on six related-party investments totalling some $150 million, all of which were lost or unable to be recovered.  The report notes that the key concerns identified by APRA were that Trio and former Trio directors failed to act in members’ best interests as:

  • the related-party investments had been made on the basis of insufficient due diligence;
  • the investments were on terms more favourable to related parties than would reasonably be expected had they been at arm’s length; and
  • there was inadequate monitoring of the performance of the related-party investments.

Q: What compensation has been provided to Trio members?
A: In 2011 and 2012 the Minister determined grants of financial assistance of approximately $55 million and $16.7 million respectively, totalling $71.7 million, for losses associated with the investments by Trio superannuation members in the ASF as a result of fraudulent conduct.  The grants included an allowance for costs associated with the grant applications and incidental costs of the acting trustee incurred as a consequence of the fraudulent conduct.

Q: What are the main lessons for industry from the Trio matter?
A: The main lessons for trustees out of Trio are the importance of a sound investment governance framework, adequately managing conflicts of interest and ensuring the risk management framework effectively manages fraud risk.  For further information on lessons for industry see www.apra.gov.au/Super/Publications/Pages/Other-Information-for-Superannuation.aspx

Q: What changes have there been to the prudential supervision of superannuation funds since the Trio matter?
A: In 2012 the Stronger Super Reforms expanded trustees’ statutory duties and included a duty to give priority to the interests of members over the interests of the trustee or other persons. APRA has also been given the power to make prudential standards in the superannuation industry, aligning APRA’s powers in this regard with those in the banking and insurance sectors. Prudential standards in superannuation also cover areas such as investment governance, conflicts of interest and risk management.

Q: Are there other relevant changes expected to the prudential framework for the superannuation industry?
A: The Government has introduced into Parliament legislative changes to further improve superannuation governance and improve transparency through portfolio-holding disclosure measures. APRA’s review of the Trio failure has also identified other areas of potential legislative reform, such as enhanced requirements for significant changes in ownership or control of RSE licensees, and is liaising with the Government on these changes.


The Australian Prudential Regulation Authority (APRA) is the prudential regulator of the financial services industry. It oversees banks, credit unions, building societies, general insurance and reinsurance companies, life insurance, private health insurers, friendly societies, and most members of the superannuation industry. APRA currently supervises institutions holding $5.4 trillion in assets for Australian depositors, policyholders and superannuation fund members.

APRA, Basel Committee: Another GFC is coming

From Australian Broker.

Both the global banking regulator and Australia’s banking regulator have warned another financial crisis is imminent.

Speaking at the Australian Financial Review (AFR) Banking and Wealth Summit in Sydney yesterday, Bill Coen, the secretary-general the Basel Committee on Banking Supervision, the global banking regulator, said another global financial crisis is “statistically certain”.

“As regulators, our focus is invariably on the downside risks rather than the upside. I’m an optimist by nature but maybe a pessimist by fact and experience. We know with statistical certainty there will be another financial crisis,” Coen said.

Echoing Coen’s warning, Wayne Byres, the chairman of Australian banking regulator APRA, said it is not a matter of “if” but “when”.

“When adversity arrives – and it will, it is not ‘if’, it will – to the extent possible we want the banking system to help alleviate rather than exacerbate problems. Ideally act as shock absorber not an amplifier.”

Byres said this is why it is important to build strength and resilience now.

“The main message I want to talk about today is that it is better we continue to invest in building resilience now when it can be done in an orderly manner from a position of relative strength than try to do so in more difficult times.”

Last year, the regulator announced an increase in the amount of capital required to be held by lenders against residential mortgages. This resulted in the big four banks raising more than $18 billion combined in new equity from shareholders.

APRA also enforced a limit on investment lending and warned it would be keeping a close watch on credit asessments.

Byres said capital requirements were likely to continue to move higher in 2016, amongst other regulatory work, to ensure our Australian banks are “unquestionably strong”, as recommended by the Murray Financial System Inquiry (FSI).

“Achieving this objective will involve work in four broad areas, and take the next several years to fully implement,” Byres told the summit.

“The four areas I have highlighted are: reinforcing capital strength; improving the stability of liquidity and funding profiles; enhancing both the public and private sectors’ readiness for adversity; and strengthening the risk culture within the financial system.”

According to Coen, increasing bank resilience in good times is the “most efficient and effective” way of dealing with periods of stress.

“The message here is caution against complacency,” Coen said.

ADI’s Housing Loans Now At $1.43 trillion

The latest data from APRA, the monthly banking stats to February 2016 shows lending portfolios held by the banks for housing was $1,432 billion. The gap between this figure and the RBA reported figure – $109.4 billion,  is the non-bank sector, which represents a 1.38% rise (up $1.49 billion) compared with last month. So one important observation is the non-bank sector is now growing their mortgage loan books faster than the banks.

Looking at the ADI specific data, 63.8% of loans on book are for owner occupation, which is now at $913 billion, up $6.8 billion, or  0.75% from last month, whist the rest is for investment loan purposes, and this was up 0.06% or $340m to $519 billion.

We still of course have noise in the numbers thanks to the ongoing restatements, (RBA says $1.9 billion was restated in February).

But looking at the detail, CBA holds first place for owner occupied loans, and WBC for investment loans.

Lonn-Mix-Feb-2016-NewThe mix of loans between owner occupied and investment loans shows that Bank of Queensland and Westpac have the largest relative proportion of investment loans.

Loan-Mix-Feb-2016Looking at the portfolio movements in real terms, NAB grew their investment loan book faster than their owner occupied loans. The other three large players all focused on owner occupation loan growth, and this is largely related to loan refinancing.

Loan-POrt-Movements-Feb-2016Looking at the 12 month loan growth data by bank, using the APRA baseline, and incorporating adjustments where possible, annual growth rate at a system level for investment loans is now sitting at below 2%. All the big players are below the 10% speed limit now, though some smaller players may be getting some attention from the regulator.

INV-Loan-Growth-12m-Feb-2016On the other hand, growth in the owner occupied portfolios continues a pace, with a estimated average over 12 months of more than 12%. This is high, when compared to average income growth or inflation.

OO-12m-Loan-Growth   Looking at deposits, total balances rose by 0.33% in the month, by $6.4 billion, reaching $1.92 trillion. There was little change in the relative share in the month.

Deposits-Share-Feb-2016This is confirmed by looking at the value of movements month on month.

Deposits-Movements-Feb-2016Finally, credit card balances rose by $382 million to $41.8 billion. There was little change in portfolios, with CBA holding more than 27% of the market.

Cards-Share-Feb-2016The monthly movements highlight the ipact of Christmas spending, and the January repayments. WBC saw the largest lift in balances in the month.

Cards-Movements-Feb-2016