APRA releases Trio investigation report

The Australian Prudential Regulation Authority (APRA) has released the report on its investigation into the failure of Trio Capital Limited (Trio), as a result of which APRA removed 13 former Trio directors from the superannuation industry for specified periods of time.

These 13 individuals were Trio Directors between 2003 and 2009, and APRA’s enforceable undertakings have prevented them from holding senior roles in the APRA-regulated superannuation industry for periods between 3 years 6 months and 15 years (with one having no expiry date).

APRA’s view is that, given the wide interest in this matter over a number of years, it is appropriate to release the investigation report as it provides a concise summary of the circumstances surrounding the collapse of Trio, together with an overview of APRA’s regulatory actions following the collapse.

The release of APRA’s investigation report follows the publication in May 2015 of final reports from the Trio liquidator and with the final steps in the winding up of Trio’s five registerable superannuation entities in progress.

APRA’s investigation focussed on six related-party investments totalling approximately $150 million, all of which were lost or unable to be recovered.  This included losses associated with investments in the Astarra Strategic Fund (ASF) as a result of fraudulent conduct.

The outcomes of the Trio investigation provide important lessons for trustees more broadly. APRA considers the significant investment losses can be attributed to a number of key factors:

  • inadequate investment governance processes;
  • failure to adequately manage conflicts of interest from dealings with related parties; and
  • failure to have adequate controls to mitigate fraud-related investment risk.

Since the Trio matter there have been a number of important enhancements to the regulation of the superannuation industry which impact directly on these three critical areas. These include introduction of prudential standards in superannuation, additional statutory duties imposed on trustees and directors, and further guidance provided by APRA on fraud risk management. Further detail on the lessons for trustees arising from the Trio investigation is available on APRA’s website at: www.apra.gov.au/Super/Publications/Pages/Other-Information-for-Superannuation.aspx

A copy of the investigation report is available on APRA’s website at: www.apra.gov.au/Super/Publications/Pages/Other-Information-for-Superannuation.aspx

Copies of APRA’s media releases announcing the enforceable undertakings of the 13 former Trio directors are available at: www.apra.gov.au/MediaReleases/Pages/13_34.aspx

Background

Q: What were the main outcomes of the investigation?
A: APRA accepted enforceable undertakings from 13 individuals, who were Trio directors between 2003 and 2009.  The enforceable undertakings effectively removed these individuals from holding senior roles in the APRA-regulated superannuation industry for periods between 3 years 6 months and 15 years (with one having no expiry date).

Q: What were the main areas of conduct by Trio directors that the investigation focused on?
A: The investigation focused on six related-party investments totalling some $150 million, all of which were lost or unable to be recovered.  The report notes that the key concerns identified by APRA were that Trio and former Trio directors failed to act in members’ best interests as:

  • the related-party investments had been made on the basis of insufficient due diligence;
  • the investments were on terms more favourable to related parties than would reasonably be expected had they been at arm’s length; and
  • there was inadequate monitoring of the performance of the related-party investments.

Q: What compensation has been provided to Trio members?
A: In 2011 and 2012 the Minister determined grants of financial assistance of approximately $55 million and $16.7 million respectively, totalling $71.7 million, for losses associated with the investments by Trio superannuation members in the ASF as a result of fraudulent conduct.  The grants included an allowance for costs associated with the grant applications and incidental costs of the acting trustee incurred as a consequence of the fraudulent conduct.

Q: What are the main lessons for industry from the Trio matter?
A: The main lessons for trustees out of Trio are the importance of a sound investment governance framework, adequately managing conflicts of interest and ensuring the risk management framework effectively manages fraud risk.  For further information on lessons for industry see www.apra.gov.au/Super/Publications/Pages/Other-Information-for-Superannuation.aspx

Q: What changes have there been to the prudential supervision of superannuation funds since the Trio matter?
A: In 2012 the Stronger Super Reforms expanded trustees’ statutory duties and included a duty to give priority to the interests of members over the interests of the trustee or other persons. APRA has also been given the power to make prudential standards in the superannuation industry, aligning APRA’s powers in this regard with those in the banking and insurance sectors. Prudential standards in superannuation also cover areas such as investment governance, conflicts of interest and risk management.

Q: Are there other relevant changes expected to the prudential framework for the superannuation industry?
A: The Government has introduced into Parliament legislative changes to further improve superannuation governance and improve transparency through portfolio-holding disclosure measures. APRA’s review of the Trio failure has also identified other areas of potential legislative reform, such as enhanced requirements for significant changes in ownership or control of RSE licensees, and is liaising with the Government on these changes.


The Australian Prudential Regulation Authority (APRA) is the prudential regulator of the financial services industry. It oversees banks, credit unions, building societies, general insurance and reinsurance companies, life insurance, private health insurers, friendly societies, and most members of the superannuation industry. APRA currently supervises institutions holding $5.4 trillion in assets for Australian depositors, policyholders and superannuation fund members.

APRA, Basel Committee: Another GFC is coming

From Australian Broker.

Both the global banking regulator and Australia’s banking regulator have warned another financial crisis is imminent.

Speaking at the Australian Financial Review (AFR) Banking and Wealth Summit in Sydney yesterday, Bill Coen, the secretary-general the Basel Committee on Banking Supervision, the global banking regulator, said another global financial crisis is “statistically certain”.

“As regulators, our focus is invariably on the downside risks rather than the upside. I’m an optimist by nature but maybe a pessimist by fact and experience. We know with statistical certainty there will be another financial crisis,” Coen said.

Echoing Coen’s warning, Wayne Byres, the chairman of Australian banking regulator APRA, said it is not a matter of “if” but “when”.

“When adversity arrives – and it will, it is not ‘if’, it will – to the extent possible we want the banking system to help alleviate rather than exacerbate problems. Ideally act as shock absorber not an amplifier.”

Byres said this is why it is important to build strength and resilience now.

“The main message I want to talk about today is that it is better we continue to invest in building resilience now when it can be done in an orderly manner from a position of relative strength than try to do so in more difficult times.”

Last year, the regulator announced an increase in the amount of capital required to be held by lenders against residential mortgages. This resulted in the big four banks raising more than $18 billion combined in new equity from shareholders.

APRA also enforced a limit on investment lending and warned it would be keeping a close watch on credit asessments.

Byres said capital requirements were likely to continue to move higher in 2016, amongst other regulatory work, to ensure our Australian banks are “unquestionably strong”, as recommended by the Murray Financial System Inquiry (FSI).

“Achieving this objective will involve work in four broad areas, and take the next several years to fully implement,” Byres told the summit.

“The four areas I have highlighted are: reinforcing capital strength; improving the stability of liquidity and funding profiles; enhancing both the public and private sectors’ readiness for adversity; and strengthening the risk culture within the financial system.”

According to Coen, increasing bank resilience in good times is the “most efficient and effective” way of dealing with periods of stress.

“The message here is caution against complacency,” Coen said.

ADI’s Housing Loans Now At $1.43 trillion

The latest data from APRA, the monthly banking stats to February 2016 shows lending portfolios held by the banks for housing was $1,432 billion. The gap between this figure and the RBA reported figure – $109.4 billion,  is the non-bank sector, which represents a 1.38% rise (up $1.49 billion) compared with last month. So one important observation is the non-bank sector is now growing their mortgage loan books faster than the banks.

Looking at the ADI specific data, 63.8% of loans on book are for owner occupation, which is now at $913 billion, up $6.8 billion, or  0.75% from last month, whist the rest is for investment loan purposes, and this was up 0.06% or $340m to $519 billion.

We still of course have noise in the numbers thanks to the ongoing restatements, (RBA says $1.9 billion was restated in February).

But looking at the detail, CBA holds first place for owner occupied loans, and WBC for investment loans.

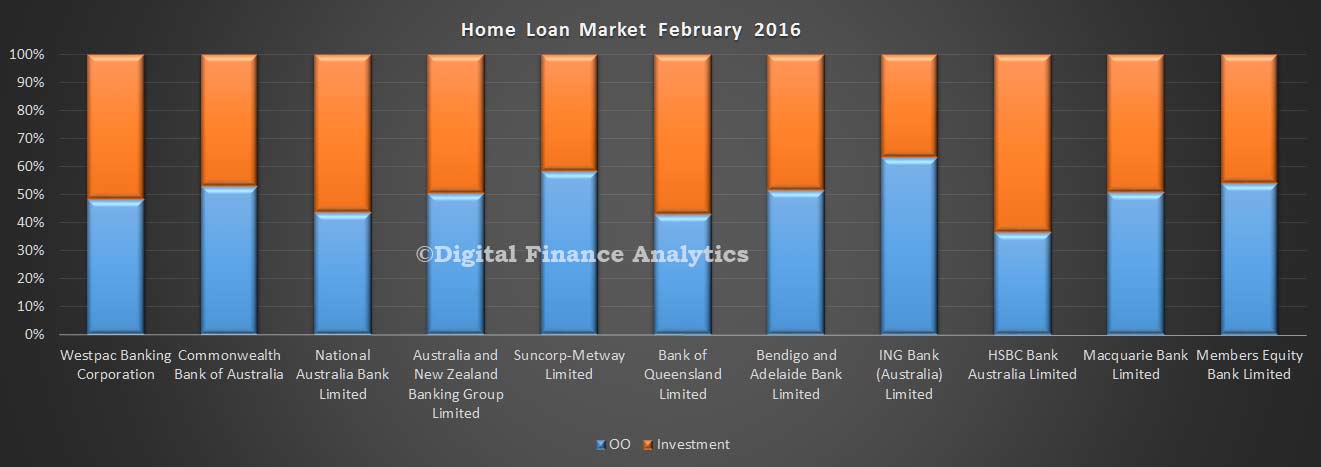
Lonn-Mix-Feb-2016-NewThe mix of loans between owner occupied and investment loans shows that Bank of Queensland and Westpac have the largest relative proportion of investment loans.

Loan-Mix-Feb-2016Looking at the portfolio movements in real terms, NAB grew their investment loan book faster than their owner occupied loans. The other three large players all focused on owner occupation loan growth, and this is largely related to loan refinancing.

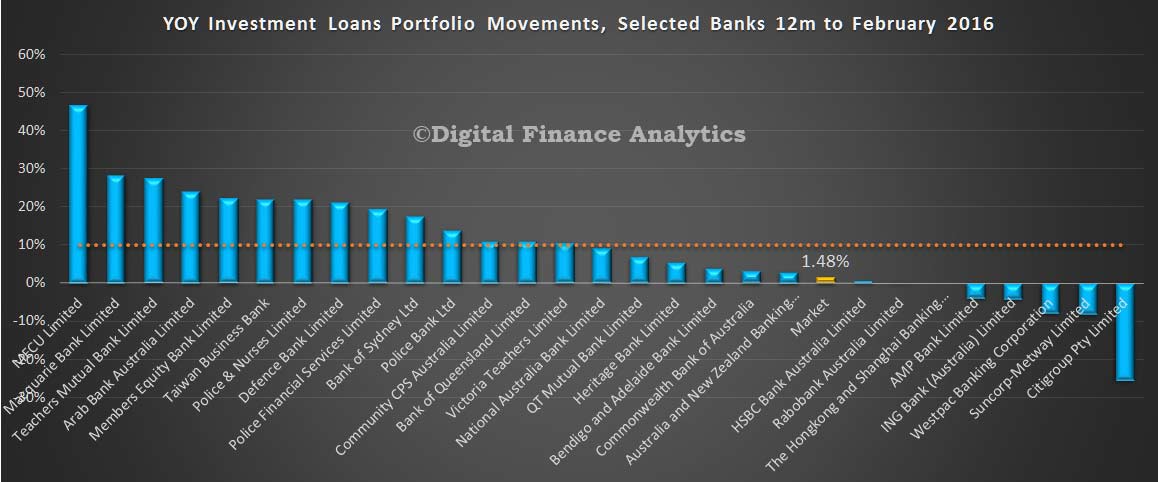
Loan-POrt-Movements-Feb-2016Looking at the 12 month loan growth data by bank, using the APRA baseline, and incorporating adjustments where possible, annual growth rate at a system level for investment loans is now sitting at below 2%. All the big players are below the 10% speed limit now, though some smaller players may be getting some attention from the regulator.

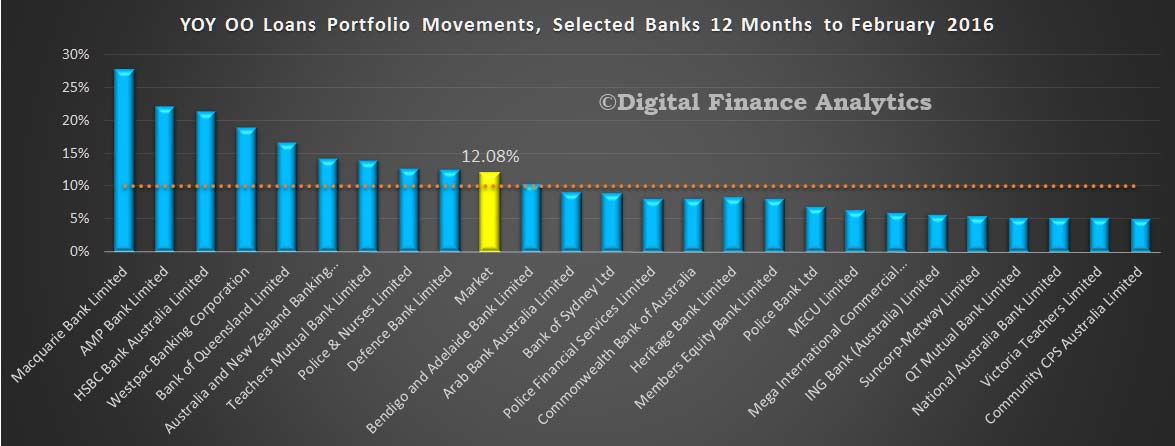
INV-Loan-Growth-12m-Feb-2016On the other hand, growth in the owner occupied portfolios continues a pace, with a estimated average over 12 months of more than 12%. This is high, when compared to average income growth or inflation.

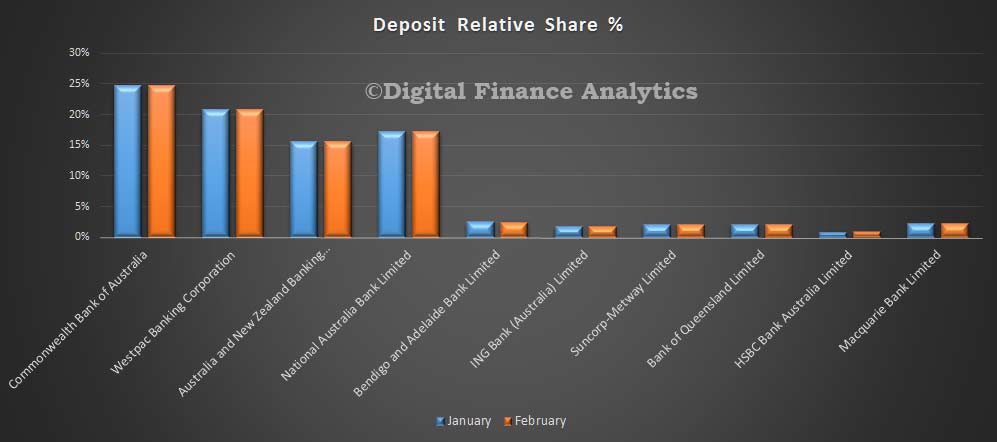
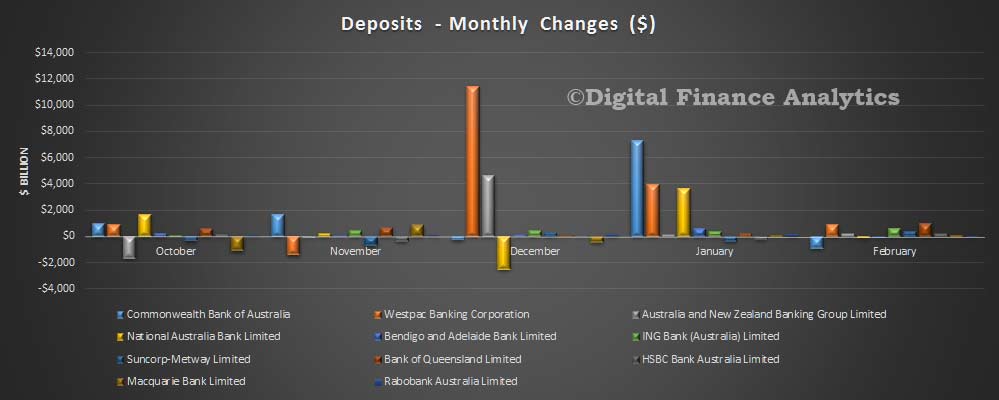
OO-12m-Loan-Growth   Looking at deposits, total balances rose by 0.33% in the month, by $6.4 billion, reaching $1.92 trillion. There was little change in the relative share in the month.

Deposits-Share-Feb-2016This is confirmed by looking at the value of movements month on month.

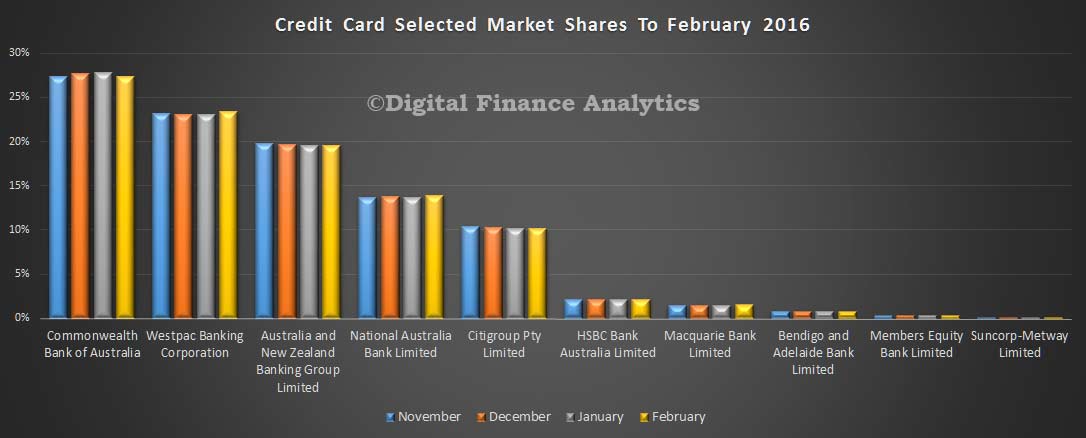
Deposits-Movements-Feb-2016Finally, credit card balances rose by $382 million to $41.8 billion. There was little change in portfolios, with CBA holding more than 27% of the market.

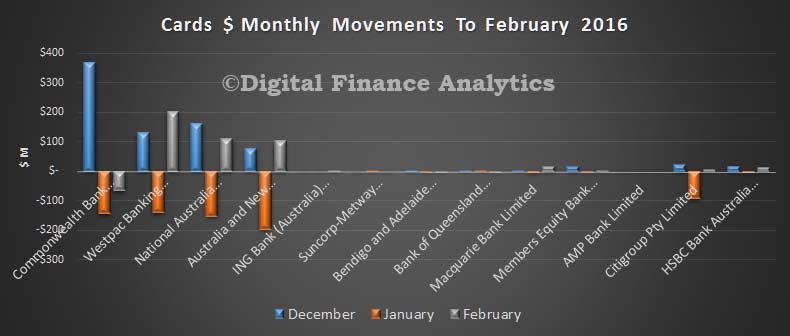
Cards-Share-Feb-2016The monthly movements highlight the ipact of Christmas spending, and the January repayments. WBC saw the largest lift in balances in the month.

Cards-Movements-Feb-2016

APRA releases consultation package on Net Stable Funding Ratio

The Australian Prudential Regulation Authority (APRA) has today released for consultation a discussion paper outlining its proposed implementation of the Net Stable Funding Ratio (NSFR). It is proposed that the new standard would come into effect from 1 January 2018, consistent with the international timetable agreed by the Basel Committee on Banking Supervision (BCBS).

The discussion paper also proposes options for the future operation of a liquid assets requirement for foreign authorised deposit-taking institutions (ADIs), i.e. foreign bank branches, in Australia.

APRA originally consulted on proposals for the introduction of the NSFR in 2011, but subsequently placed further consultation on hold pending finalisation of the NSFR by the BCBS, which released details of its final NSFR standard in October 2014.

APRA’s objective in implementing the NSFR in Australia, in combination with the Liquidity Coverage Ratio (LCR) implemented in 2015, is to strengthen the resilience of ADIs. The NSFR encourages ADIs to fund their activities with more stable sources of funding on an ongoing basis, and thereby promotes greater balance sheet resilience. In particular, the NSFR should lead to reduced reliance on less-stable sources of funding — such as short-term wholesale funding — that proved problematic during the global financial crisis.

As with the earlier introduction of the LCR, APRA is proposing that the NSFR will only be applied to larger, more complex ADIs. APRA is currently proposing that 15 ADIs be subject to the NSFR. They are: AMP Bank; Arab Bank; Australia and New Zealand Banking Group; Bendigo and Adelaide Bank; Bank of China; Bank of Queensland; Citigroup; Commonwealth Bank of Australia; HSBC Bank; ING Bank; Macquarie Bank; National Australia Bank; Rabobank Australia; Suncorp-Metway; and Westpac Banking Corporation.

Smaller ADIs with balance sheets that comprise predominantly mortgage lending portfolios funded by retail deposits are likely to have stable funding well in excess of that required by the NSFR, meaning there is limited value in applying the new standard to these entities.

APRA Chairman Wayne Byres said: ‘ADIs have increased the amount of funding from more stable funding sources over the past seven years or so, reflecting an important lesson from the financial crisis as to the need for greater liquidity and funding resilience.

‘The NSFR will serve to reinforce and maintain those improvements in ADI funding profiles. It will also be an important consideration, in addition to capital strength, when determining how to implement the Financial System Inquiry’s recommendation regarding ‘unquestionably strong’ ADIs.’

Liquid assets requirement for foreign bank branches

The discussion paper also sets out proposals for the future application of a liquid assets requirement for foreign bank branches that are currently subject to a concessionary 40 per cent LCR requirement. APRA is consulting on two options: (i) the continuation of the existing regime or (ii) replacing the existing regime with a simple metric that would require foreign bank branches to hold specified liquid assets equal to at least nine per cent of external liabilities.

APRA invites written submissions on the proposals in the discussion paper by 31 May 2016. APRA intends to release a draft revised prudential standard, and an associated prudential practice guide, for consultation later in 2016. This will be followed by revised draft reporting requirements during the second half of 2016.

The discussion paper can be found on APRA’s website at:
http://www.apra.gov.au/adi/PrudentialFramework/Pages/Basel-III-liquidity-NSFR-March-2016.aspx.


APRA Conglomerate Supervision Framework (Level 3) Consultation

The Australian Prudential Regulation Authority (APRA) has today released for consultation clarifications to the governance and risk management components of the framework for supervision of conglomerate groups (Level 3 framework).

This includes clarifications to nine prudential standards, intended to become effective on 1 July 2017, and two prudential practice guides. These clarifications are not changes in policy position.

APRA released the Level 3 framework1 in August 2014, but considered it appropriate to wait until the findings of the Financial System Inquiry (FSI) and the Government’s response to FSI recommendations before settling on the final form of the conglomerate framework.

APRA has also announced today that it has deferred the implementation of conglomerate capital requirements until a number of other domestic and international policy initiatives are further progressed. These policy initiatives include:

  • APRA’s implementation of the FSI recommendation on unquestionably strong capital ratios for ADIs (FSI recommendation 1);
  • consideration of proposals in relation to loss absorption and recapitalisation capacity (FSI recommendation 3); and
  • proposed legislative changes to strengthen APRA’s crisis management powers (FSI recommendation 5).

Taken together, these initiatives will influence APRA’s final views on the appropriate requirements with respect to the strength, resilience, recovery and resolution capacity of conglomerate groups.

APRA Chairman Wayne Byres said: ‘The group governance and risk management requirements released today will further strengthen conglomerate groups, by enhancing oversight of group risks and exposures, and limiting potential contagion and systemic risks.’

‘While the timetable for the implementation of the conglomerate capital requirements has been extended, in APRA’s view this is the most appropriate course of action. To finalise the conglomerate capital requirements at this stage would introduce the possibility of needing to amend them within a few years, and this would be unnecessarily disruptive and inefficient for the groups directly affected.’

Given some time has passed since the prudential standards were released in August 2014, APRA is providing a six-week consultation period (until 13 May) for comments on the clarifications to the nine non-capital prudential standards. APRA also invites submissions on the two prudential practice guides by 27 May. As the consultation largely deals with issues of clarification, APRA is not expecting any changes to the underlying policy positions

While the clarifications to the cross-industry standards of Risk Management, Outsourcing, Governance, Business Continuity Management, and Fit and Proper largely relate to their application to conglomerates, these standards also apply to all authorised deposit-taking institutions (ADIs), general insurers and life companies. As such, APRA encourages all entities covered by these standards to review the clarifications.

The Level 3 framework, including prudential standards, prudential reporting forms, and draft prudential practice guides can be found on the APRA website at:

www.apra.gov.au/CrossIndustry/Pages/Supervision-of-conglomerate-groups-L3-March-2016.aspx.

1 www.apra.gov.au/MediaReleases/Pages/14_15.aspx

New Investor Mortgage LVR’s Being Trimmed

The peak LVR’s on investment mortgage transactions is down according to a speech today given by Heidi Richards, General Manager, Industry Analysis APRA, which developed further the information published yesterday relating to mortgage underwriting standards. This is important because 62% of bank lending is mortgage related (a high). Whilst much of the information in the speech covered the same ground, which we discussed yesterday, there was a striking piece of data on the LVR’s of investment loans.

More recently, APRA’s initiative to rein in growth in the investor segment of the market has prompted a number of ADIs to use LVR caps as a lever to reduce loan approvals in this segment. Although many ADIs traditionally required more equity for investment loans, some ADIs reduced maximum LVRs for investors significantly over the course of 2015. Note the actual distribution of loans approved for investors is much lower than these maximum levels, and overall, LVRs for investors on average tend to be lower than for owner-occupiers.

APRA-LVR's-Speech

Two observations. First different lenders clearly had – and have different policies relating to LVR limits, and second LVR limits have been reduced, by some in recent times. For example, a maximum from 92.5% down to 65%! Others have not changed their maximum ratios (though may not be lending to the maximum of course).

Towards the end of her speech she brings together the various steps taken to reduce lending, and referring to the hypothetical borrower model summaries:

…the hypothetical borrower exercise illustrated a material tightening of lending standards that we believe is appropriate and reflects more sensible risk assessment practices. Between 2014 and 2015, the maximum loan sizes that could have been extended to our four hypothetical borrowers declined by, on average, around 12 per cent for investors and 6 per cent for owner-occupiers. The actual change for individual ADIs was greater, up to 25 per cent in some cases. This should not be interpreted as an indication that actual loan sizes are shrinking, however, only that the maximum allowable loan for a given borrower income profile is now more conservative.

The next two charts illustrate the key drivers of this result. For owner-occupiers, the largest impact has come from the use of more realistic estimates of living expenses. For investors, interest-rate buffers that ADIs now apply more consistently to the borrower’s other debts are most significant. I should mention that there are also changes to standards at some ADIs that are yet to be implemented, due to systems constraints or other hurdles, so these results will continue to evolve and we will most likely conduct additional exercises in the future.

Change-1

CHange-2 These changes reflect the policies of each lender, but it is always possible that practice may be divergent from policy. Lenders generally allow some scope for the standard credit criteria to be overridden by experienced lending staff. APRA would clearly be concerned if these tighter policies were being undermined in practice to any material degree.

As a result, we are taking a hard look at loans approved outside serviceability policy. Many loans are approved or declined based on automated criteria. In some cases, however, an application might be referred for a manual decision because it marginally fails a serviceability test. The loan might ultimately be approved by a lending officer with appropriate delegation if there is other evidence that the borrower can service the loan—this might be, for example, because there is other income that was not captured in the decisioning tool, the borrower is on maternity leave with temporarily lower income, or for bridging finance. However, there is also the potential for weaker loans being approved, and in our view ADIs need to have good oversight and monitoring of these approvals. APRA data shows a recent uptick in loans approved outside serviceability; anecdotal evidence indicates much of this relates to loans in the pipeline that were preapproved under older, looser criteria now being settled. So we expect to see this volume taper off.

Another way to look at the situation is that there are tranches of loans which were written under more generous underwriting terms, for at least the last 2-3 years. These loans may well have a higher probability of default down the track (after all why else would APRA want to tighten the criteria), so it will be interesting to see if indeed defaults rise higher than average in these loan pools. Across the board defaults are up, if only a little.  For the major bank issuers, the 30 day delinquency rate increased to 1.15 per cent at December also up from 0.94 per cent at September according to Moody’s.

Mortgage Underwriting Standards Vary By Lender, and Over Time

APRA’s Insight Issue One 2016 included a section on mortgage underwriting standards. The recent falls in average loan sizes noted in the recent monthly banking data reflects tighter underwriting standards. APRA data also highlights the diversity of underwriting standards in the market.

One key element of ADIs’ lending practices is the method by which they assess a customer’s ability to service a loan against a range of potential future circumstances. This assessment of loan serviceability is not merely a legal obligation for lenders; it is also an important, prudent risk management practice.

Loan serviceability methodologies

In making serviceability assessments of borrowers, most ADIs currently use a methodology in which they calculate the borrower’s Net Income Surplus (NIS). Computing NIS is a multi-faceted calculation, with a number of different inputs, and for which the relative importance of each input is not always clear. Assessing the relative prudence of NIS assessments across ADIs can therefore be problematic, as it can be difficult to determine the extent to which one conservative assumption outweighs another less- conservative assumption, and apparent minor differences in methodology can sometimes have a significant impact on the overall outcome.

To assess and compare lending standards across ADIs, one technique used by APRA has been a Hypothetical Borrower Exercise (HBE). In early 2015, APRA asked a number of the larger ADIs to provide their serviceability assessments for four hypothetical mortgage borrowers — two owner-occupiers and two investors — using their policies in place as at 31 December 2014. This allowed APRA to compare the lending decisions of ADIs based on identical borrower characteristics. Importantly, it also allowed APRA to disassemble assessments into their component parts. In May 2015, APRA outlined some results and conclusions from the first HBE.1

To test how lending policies had changed in response to APRA’s scrutiny, APRA ran a second HBE in late 2015, based on the policies ADIs had in place as at 30 September 2015. By asking the same population of ADIs to assess the same four hypothetical borrowers, not only could APRA compare across ADIs, it could also compare the same ADI at two different points in time.

The four charts below relate to the four calculation components for one of the hypothetical borrowers — in this case, a ‘typical’ investor. The blue bars show the results for December 2014, while the red dots show the September 2015 results for the same lender. Each chart is sorted with the most conservative lender for that particular component (as at September 2015) on the left, and the least conservative on the right.

Chart A – Income recognised (less tax and haircuts)

Percentage of gross pre-tax income

 Chart A shows income recognised, as a percentage of the borrower's gross pre-tax income. A number of ADIs have reported more prudent income recognition in September 2015 than in December 2014.

Bars represent individual lender data

Chart B – Minimum living expense assumptions

Percentage of borrower pre-tax salary income

 Chart B shows ADIs' minimum living expense assumptions as a percentage of the borrower's pre-tax salary income. Many ADIs have reported higher minimum living expense assumptions in September 2015 compared to December 2015.

Bars represent individual lender data

Chart C – New mortgage

Interest rate used in serviceability assessment

Chart C shows the interest rate used in the serviceability assessment for a new mortgage. The interest rate used in December 2014 ranged from 6.3 - 8.1 per cent. The range for September 2015 was 7.1 - 8.6 per cent.

Bars represent individual lender data

Chart D – Existing mortgage

Interest rate used in serviceability assessment

 Chart D shows the interest rate used in the serviceability assessment for an existing mortgage commitment.The interest rate used in December 2014 ranged from 5.3 - 8.1 per cent. The range for September 2015 was 6.4 - 9.2 per cent.

Bars represent individual lender data
The current interest rate on the existing mortgage debt is 5.2%
 Chart A shows income recognised, as a percentage of gross pre-tax income.  While the assessment of PAYG salary income has usually remained the same between the two periods, a number of lenders have applied larger haircuts (i.e. discounts) to less stable sources of income such as overtime, bonuses, commissions, investment dividends and rental income.

Chart B shows minimum living expense assumptions as a percentage of pre-tax salary income.  Some lenders have made quite large changes to this component of their NIS assessment.  This impact has typically arisen from two main sources:

  • considering borrower-declared expenses where these are greater than calculated benchmarks; and/or
  • scaling living expense assumptions in line with income.

Chart C shows the interest rate used in the serviceability assessment for this new mortgage.  Various lenders have increased that rate in response to APRA’s December 2014 letter, in which APRA stated that prudent serviceability policies should incorporate a ‘serviceability buffer of at least 2 per cent above the loan product rate, with a minimum floor assessment rate of 7 per cent.’

Chart D shows the interest rate used in the serviceability assessment for an existing mortgage commitment. Here, the changes are even more dramatic than for Chart C, as at the time of the first HBE a number of ADIs were not using any serviceability buffer on existing debt.

These four components combine to calculate NIS. Whilst there was little overall change in NIS for the lenders that were already relatively conservative in December 2014, lenders that were the least conservative in December 2014 generally reported a significant drop in calculated NIS using their September 2015 policies. These changes had the effect of tightening the spread of calculated NIS from the most to the least conservative ADI. Overall, the maximum loan sizes reported by ADIs for the four hypothetical borrowers declined by, on average, around 12 per cent for investors and 6 per cent for owner-occupiers. (Note that this does not imply actual loan sizes are falling across the board; indeed the average size of loans continues to rise.)

Conclusion

APRA’s HBEs have proven a simple but effective tool for examining the impact of changes to residential mortgage lending policies during 2015.

Overall, debt serviceability assessments now appear to be both more prudent and more consistent across ADIs, relative to December 2014.  APRA will continue to engage ADIs on this issue in 2016 to assess whether the observed improvements in sound underwriting practices are maintained. APRA will also be examining the extent to which loans are able to be approved outside an ADI’s own (tightened) policy parameters.

1 Sound lending standards and adequate capital: preconditions for long-term success
http://www.apra.gov.au/Speeches/Pages/Sound-Lending-Standards-and-Adequate-Capital.aspx

APRA Warns On Mortgage Reclassification

APRA has written to all ADI’s with regards to the spate of mortgage reclassification between investment and owner occupied loans which amounts now to around $35bn of adjustments in the past few months. Reclassification seem to emanate from internal review within the banks when APRA introduced 10% speed limit on investment loans, and also is customer initiated following the price differences between owner occupied and investment mortgages which have emerged. These movements are “strange” and may reflect some divergence from the true state of play.  The mix of loans clearly has an impact on policy, and has the potential later to impact potential capital requirements.

So APRA’s warning is timely. There are however no overt penalties of inaccurate reporting and some banks have made adjustments without any formal statements, although others did disclose significant recalculations.

A number of ADIs have recently reported significant changes in housing loan purpose between investment and owner-occupied. This letter provides guidance to assist authorised deposit-taking institutions (ADIs) report these data to APRA consistently and accurately.

These data are used in public policy decisions, prudential supervision and statistical publications. Where the change in loan purpose is not reported correctly (i.e. from the period that the change occurred), APRA, the Reserve Bank of Australia (RBA) and the Australian Bureau of Statistics (ABS) are impeded in accurately ascertaining the underlying movements in housing loans.

Reporting of fixed term housing loans must reflect the current purpose of the loan because the split by housing loan purpose is important for monetary policy and financial stability considerations.

Use of data

APRA uses these data for supervision and publication. The data are also used by the RBA and the ABS.

The classification of investment and owner-occupied housing loans is used by the RBA to:

  • calculate the financial aggregates;
  • assess the transmission of monetary policy through the financial system;
  • assess potential risks to financial stability; and
  • meet international statistical standards and reporting obligations.

The ABS uses the domestic books data to compile Gross Domestic Product, of which ADIs are a major component

Banks’ reporting of Statement of Financial Position ARF 320.0 (ARF 320.0)

In order to report loan data on the ARF 320.0 accurately each period, according to whether a loan is owner occupied or investment housing, ADIs must report data for existing (non-revolving) housing loans by current loan purpose.

The instructions to ARF 320.0 item 5.1.1.1 owner-occupied housing loans state that the figure reported must:

Include:

  • the value of housing loans to Australian households, for the construction or purchase of dwellings for owner occupation; and
  • revolving credit or redraw facilities originally approved for a purpose of predominantly owner-occupied housing.

The instructions to ARF 320.0 item 5.1.1.2 investment housing loans state that the figure reported must:

Include:

  • the value of investment housing loans to Australian households, for the construction or purchase of dwellings for non-owner occupation; and
  • revolving credit or redraw facilities originally approved for a purpose of predominantly non-owner-occupied housing.

Therefore:

  • when an ADI becomes aware there is a change in the purpose of an existing (non-revolving) housing loan between investment and owner-occupied, the ADI must report that loan under the new purpose on the ARF 320.0 from the month that the change in purpose occurred; but
  • for housing loans to households comprising revolving credit secured by residential mortgage, the instructions state that the loan must NOT be reported under the new purpose but continue to be reported under the purpose of the loan for which it was originally approved.

Loans must be reported according to the purpose of the loan. Where the purpose of a loan is not for the purchase or construction of a dwelling, the loan should NOT be recorded under item 5.1.1.1 or 5.1.1.2 of ARF 320.0: the loan should be reported under the relevant loan item elsewhere in ARF 320.0. In particular, non-housing loans that are secured by residential property mortgages should not be reported under item 5.1.1.1 or 5.1.1.2, but reported under the relevant loan item elsewhere in ARF 320.0. For example, a loan to a sole trader business secured by a residential property mortgage would be reported in item 5.3 Loans to non-financial corporations.

Credit unions’ and building societies’ reporting of Statement of Financial Position ARF 323.0 (ARF 323.0)

In order to report data on the ARF 323.0 accurately each period, according to whether a loan is owner occupied or investment housing, ADIs must report data for existing (non-revolving) housing loans by current loan purpose. Switching of purpose between investment and owner-occupied housing loans should be recorded under the new purpose on the ARF 323.0 from the month that the change in purpose occurred.

As per the ARF 323.0 instructions, fixed term housing loans should be reported per the current purpose and therefore should change category when the purpose changes. Revolving credit and redraw facility housing loans should continue to be reported under the purpose that the loan was originally approved for.

Housing Loan Reconciliation ARF 320.8 (ARF 320.8)

Loans which switched purpose between investment and owner-occupied housing loans should be reported under the new purpose in the outstanding stocks on ARF 320.8 Tables 1, 2 and 3.

In Table 1 of ARF 320.8, if the changed purpose of housing loans is recorded in an ADI’s system as an internal refinance, then the change in classification should be reported as ‘Excess repayments due to sale of property or refinancing’ under the original purpose, and also as ‘Drawdowns (new loans and redraws)’ for the new purpose. An example of an internal refinance is when a new contract is signed by the customer. If the reclassifying by housing loan purpose is not recorded in your system as an internal refinance, then the reclassification should be recorded as ‘Other adjustments’ under both the original and new purpose. Once the reclassifying by housing loan purpose has occurred, any other flows related to that loan should be recorded under the new purpose.

In Table 1, the flow for the reporting period should be recorded under the new purpose. Opening balances in Table 1 of the supplementary information template should be reported as nil. In Tables 2 and 3, the balances should be recorded under the new purpose.

As per the Housing Finance ARF 392 series and Personal Finance ARF 394 series instructions, reclassifying by housing loan purposes should not be reported as a new loan approval if there is no change in the property offered as security or the lender. As such, it should not be captured in Table 4.

Housing Finance ARF 392 (ARF 392) series

The general instructions for ARF 392 (page 5) state that institutions should exclude commitments to refinance existing loans where there is no change in the property offered as security and the institution was the original lender. Therefore, switching of purpose between existing investment and owner-occupied housing loans should not be reflected in the housing approvals reported on the ARF 392. Loan purpose switching does not qualify as a new commitment, nor is it an external refinance.

Personal Finance ARF 394 series

Switching of purpose between existing investment and owner-occupied housing loans should not be reflected in new commitments reported on the ARF 394 in ‘Loans for personal investment purposes – dwellings for rent/resale’ and ‘Loans for personal investment purposes – refinancing’. Loan purpose switching does not qualify as a new commitment, nor is it an external refinance.

Banks’ reporting of Impaired Assets ARF 220.0

Loans which switched by purpose between impaired investment and owner-occupied housing loans and between past due investment and occupied housing loans should be recorded under the new purpose categories on the ARF 220.0 Parts 1B and 2B from the reporting period that the reclassification occurred.


Bank Profits Up 6.9% To $36.8 bn At December 2015

APRA released the quarterly banking performance statistics today, to December 2015. On a consolidated group basis, there were 157 ADIs operating in Australia as at 31 December 2015, compared to 159 at 30 September 2015 and 166 at 31 December 2014.

The net profit after tax for all ADIs was $36.8 billion for the year ending 31 December 2015. This is an increase of $2.4 billion (6.9 per cent) on the year ending 31 December 2014.The cost-to-income ratio for all ADIs was 49.4 per cent for the year ending 31 December 2015, compared to 49.2 per cent for the year ending 31 December 2014. The return on equity for all ADIs was 13.8 per cent for the year ending 31 December 2015, compared to 14.3 per cent for the year ending 31 December 2014.

The total assets for all ADIs was $4.58 trillion at 31 December 2015. This is an increase of $241.3 billion (5.6 per cent) on 31 December 2014.The total gross loans and advances for all ADIs was $2.95 trillion as at 31 December 2015. This is an increase of $206.4 billion (7.5 per cent) on 31 December 2014.

The  total capital ratio for all ADIs was 13.9 per cent at 31 December 2015, an increase from 12.5 per cent on 31 December 2014.The common equity tier 1 ratio for all ADIs was 10.2 per cent at 31 December 2015, an increase from 9.1 per cent on 31 December 2014.The risk-weighted assets (RWA) for all ADIs was $1.87 trillion at 31 December 2015, an increase of $120.6 billion (6.9 per cent) on 31 December 2014.

For all ADIs, impaired facilities were $13.6 billion as at 31 December 2015 (chart 7). This is a decrease of $2.3 billion (14.6 per cent) on 31 December 2014. Past due items were $11.7 billion as at 31 December 2015. This is an increase of $317 million (2.8 per cent) on 31 December 2014. Impaired facilities and past due items as a proportion of gross loans and advances was 0.86 per cent at 31 December 2015, a decrease from 1.00 per cent at 31 December 2014. Specific provisions were $6.4 billion at 31 December 2015. This is a decrease of $543 million (7.9 per cent) on 31 December 2014; and specific provisions as a proportion of gross loans and advances was 0.22 per cent at 31 December 2015, a decrease from 0.25 per cent at 31 December 2014.

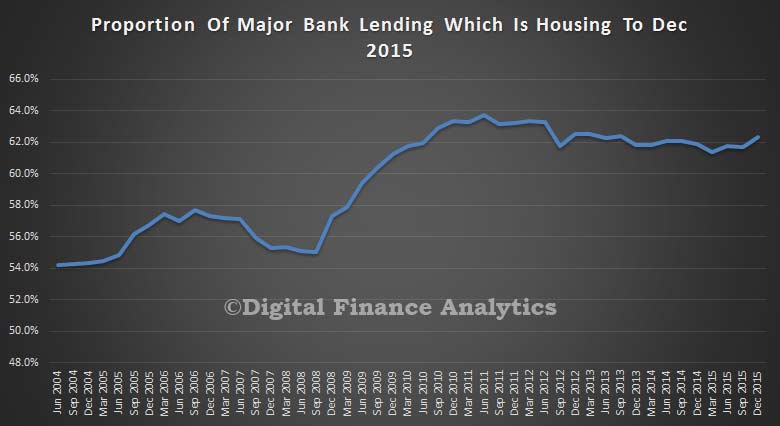
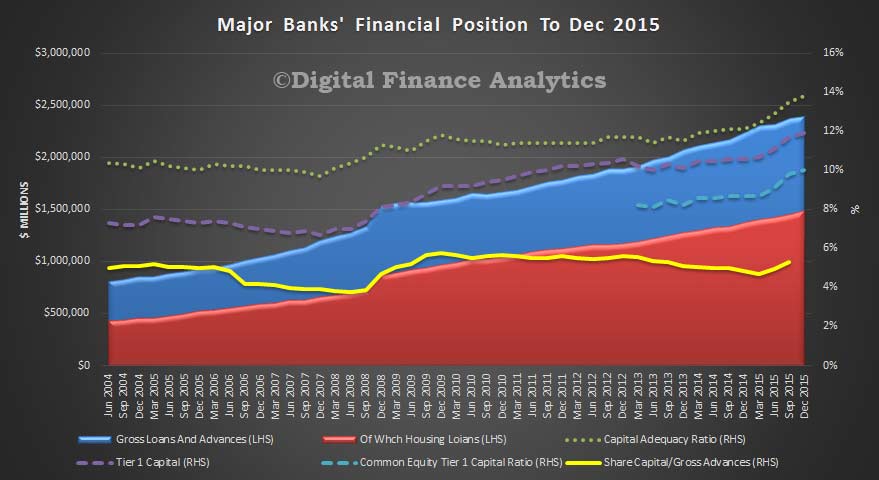
Turning to the big four major banks,  we see that 62% of all of their lending is for housing (either owner occupied or investment), so they are highly concentrated in this sector of the market. Note the rise from mid-fifties in 2004, the peak in 2011, and the new upward trend in recent quarters. Banks have their eggs firmly in the residential property basket.

Bank-Lenidng-Split-Dec-2015

If we look at their ratios, we see capital rising, under the direction of the regulators, with the ratio of share capital to gross advances rising from 4.9% to 5.3%, but you can still see the highly leveraged state of the banks, and their absolute reliance on profits from home lending. For every $100 lent on housing, shareholders are risking $5. Not a bad proposition (for them).

Bank-Position-Decv-2015

The Truth About Mortgage Brokers

Recent media coverage about mortgage brokers has been quite negative, with allegations of poor ethical standards and false application data being used by some to bolster loan applications. So in this post and in our latest video blog we look at data from our household surveys to portray the current state of play.

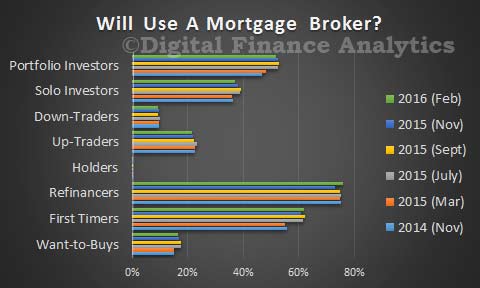
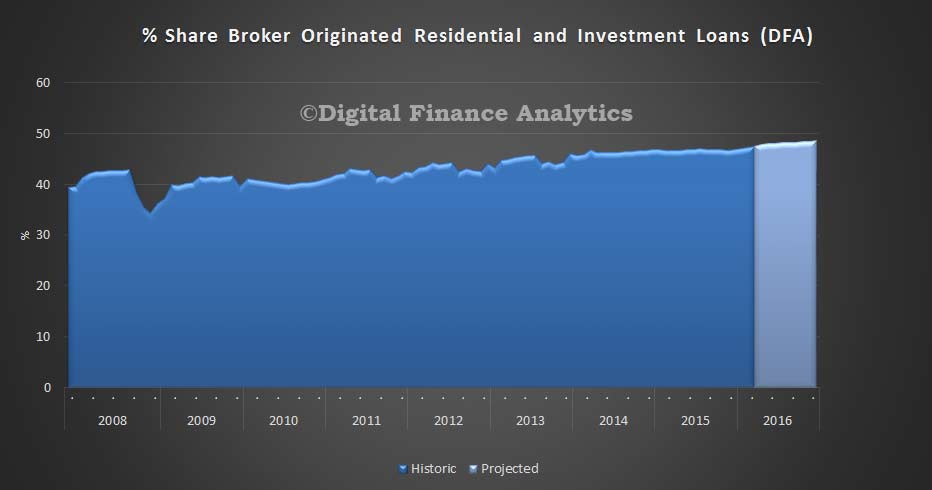
To begin, mortgage brokers have become a significant feature in the mortgage industry landscape. Indeed almost half of new loans are now originated by brokers. Different household segments have different propensities to use brokers. Those seeking to refinance, first time buyers and property investors are most likely to use a mortgage broker.

Broker-Feb-2016We expect this growth to continue, thanks to the current appetite for refinancing, and the broker focus now apparent among major banks. For example CBA, in their recent results reported to December 2015 that 45% of their loans came via the broker channel, up from 40% a year earlier. In addition regional players and credit unions are using brokers, alongside foreign banks operating here and the non-bank sector.

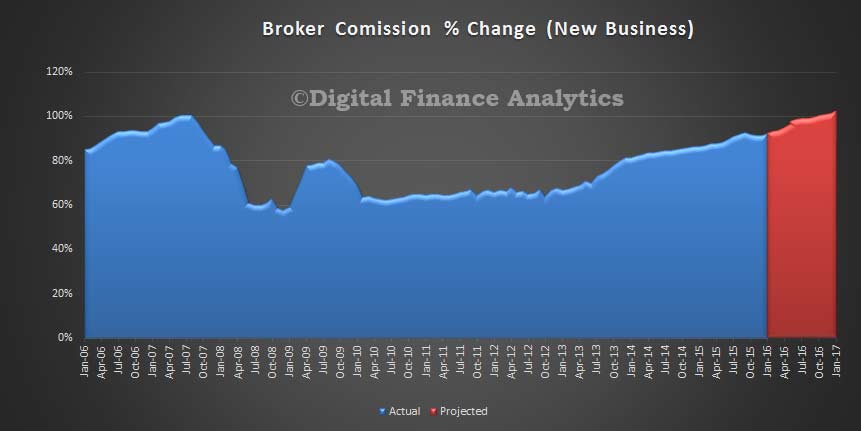
Broker-Share-Feb-2016Commissions have been tweaked recently, and the industry commission take is now back up to pre-GFC levels, (after adjusting for inflation) because whilst overall commissions were trimmed, volumes have grown.

Broker-Commissions-2016Remember that brokers get a commission payment at the start of the loan, as well as a trail paid in subsequent years. The bigger the loan, the bigger the commission. Very few aggregators normalise actual commissions paid – although Mortgage Choice does, so they claim their brokers are less influenced by commission structures.

“At Mortgage Choice we pay your broker the same rate, no matter which home loan you choose from our wide choice of lenders. That means you can tap into a Mortgage Choice broker’s expertise at no charge, with peace of mind that they have your best interests at heart”.

Some brokers refund a proportion of the commission from the lender back to the borrower. For example Peach Home Loans says:

“When we arrange your loan we are doing quite a bit of the work that the lender’s staff would otherwise have to do and as a result the lenders pay us a commission on the upfront (loan amount) – this is typically around 0.6% or $600 per $100,000. We try to recover our costs from this commission and then share what is left over with you. Lenders also pay us a small trailing commission typically from 0.15% to 0.25% pa paid on the outstanding loan balance … and this is where we try to make our profit.. after all we are in business to make a profit.”

Consider next who is the broker working for? Whilst some are directly employed by banks or aggregators, others are self employed businesses. They are mostly aligned to aggregators or banks to get access to the lender lists and access to various tools and calculators. As a broker, they want to do a deal and the legislation controlling their conduct says they need to consider the financial status of an applicant to ensure the loan is “not unsuitable.” From ASIC’s responsible lending provisions:

“As a credit licensee, you must decide how you will meet the responsible lending obligations. RG 209 sets out our expectations for compliance. Meeting your responsible lending obligations will require taking three steps:

  1. make reasonable inquiries about the consumer’s financial situation, and their requirements and objectives;
  2. take reasonable steps to verify the consumer’s financial situation; and
  3. make a preliminary assessment (if you are providing credit assistance) or final assessment (if you are the credit provider) about whether the credit contract is ‘not unsuitable’ for the consumer (based on the inquiries and information obtained in the first two steps).

In addition, if the consumer requests it, you must be able to provide them with a written copy of the preliminary assessment or final assessment (as relevant)”.

This is quite weak protection, because suitability may depend on many factors, including financial sophistication of the potential borrowers, income and expenditure assessments and other elements.

The list of lenders a broker may consider will depend on the lender panel they have access to. Most brokers will access a restricted list of potential lenders, and cannot offer a “whole of market” view of options. Quite often they will use on-line tools with a client to come up with the best deals, although often the basis for selection and lender recommendation is vague and is often not fully disclosed.

Some brokers are very proactive when it comes to shepherding the loan application through to funding, others less so. Some brokers will also keep a diary note to instigate a possible refinance conversation down the track.

But, to be clear, whilst many brokers will give good advice, they are in an area of potential conflict thanks to commissions, and limitations thanks to the panel. Brokers should be disclosing potential commissions and also their selection criteria.

The alleged poor conduct where brokers falsify applicant data is in our view a marginal activity of a “few bad apples.” That said, consumers should be using a mortgage broker with their eyes open. Ask yourself if the broker is truly working in your best interests.

APRA recently said that they considered loans written via brokers to be more risky than loans written direct by the banks. APRA chairman Wayne Byres said:

“Third-party originated loans tend to have a materially higher default rate compared to loans originated through proprietary channels.”

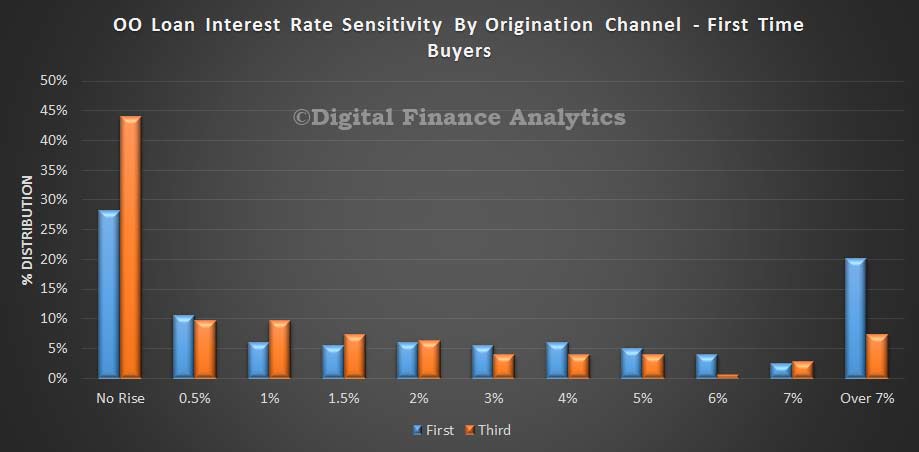
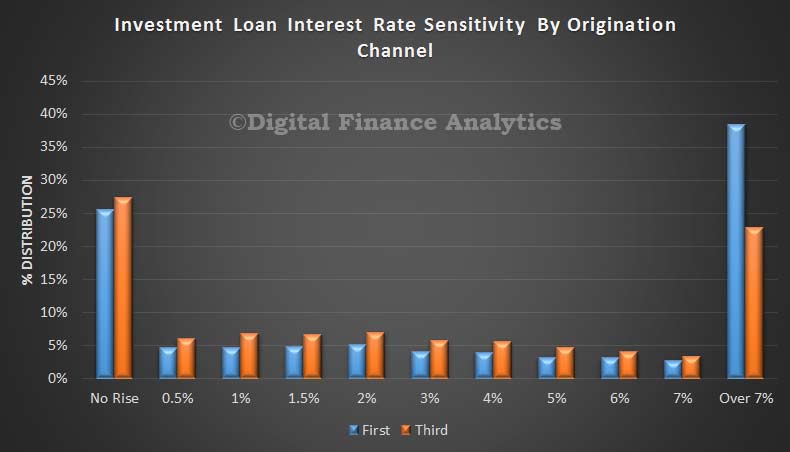
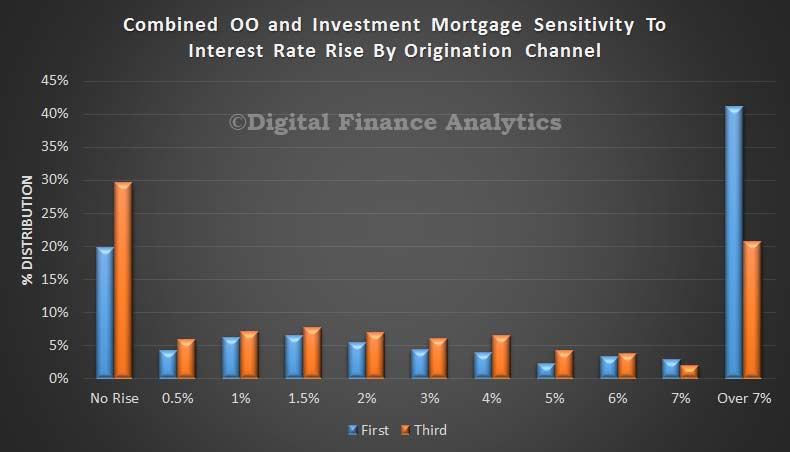
So we decided to analyse our current household survey data, looking at relative risks between third party (broker) and first party (bank) loans. We tested risks by asking households about their perceived sensitivity to interest rate rises on mortgage loans. You can read about our approach here.

The results show that households who originated loans via brokers have less headroom and more exposure to potential interest rate rises (should they occur). For example, among owner occupied first time buyers, 28% of those who got a loan direct from a bank said they would have difficulty if rates rose at all from their current levels, whereas for owner occupied borrowers via a broker this rose to 43%, a significantly higher proportion. Further analysis showed that on average loans via brokers was at a higher loan to value and loan to income ratio than those direct via the bank.

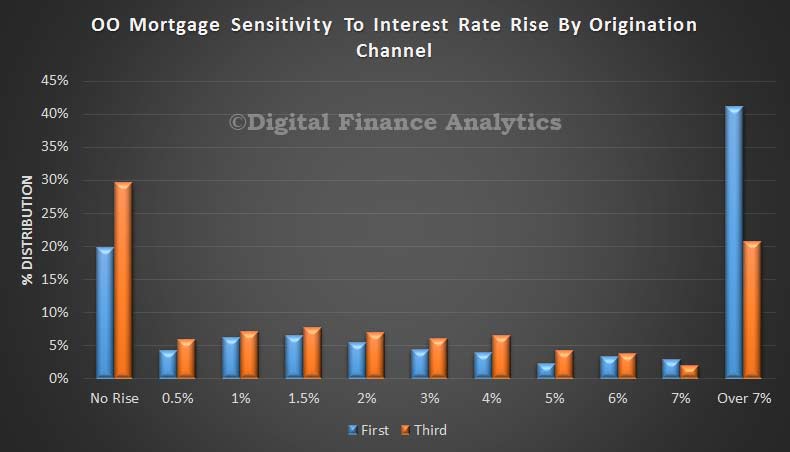
FTB-OOThere was a similar, though less extreme shift in risk across all owner occupied portfolios, with 40% of borrowers direct from a bank saying they could cope with more than 7% rise, compared with 20% of those via a broker.

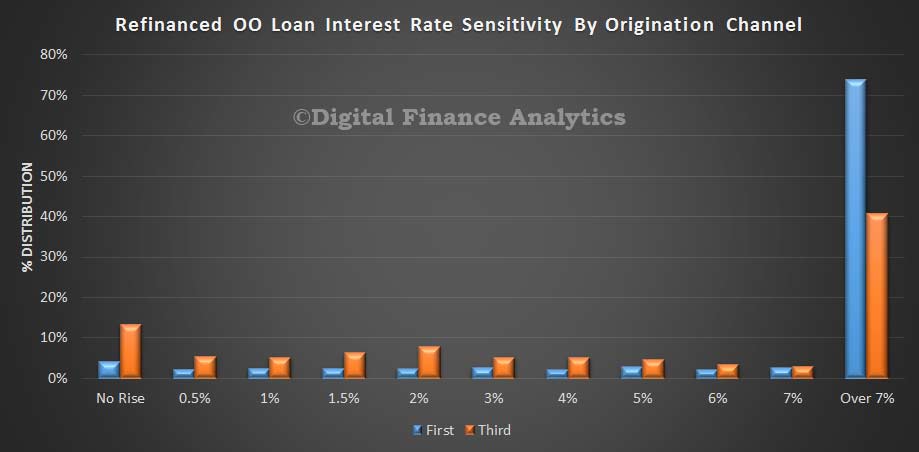
OO-HeadroomLooking at refinanced owner occupied loans we again saw a higher proportion less able to cope with a rise in rates among households who got their loan via a broker channel.

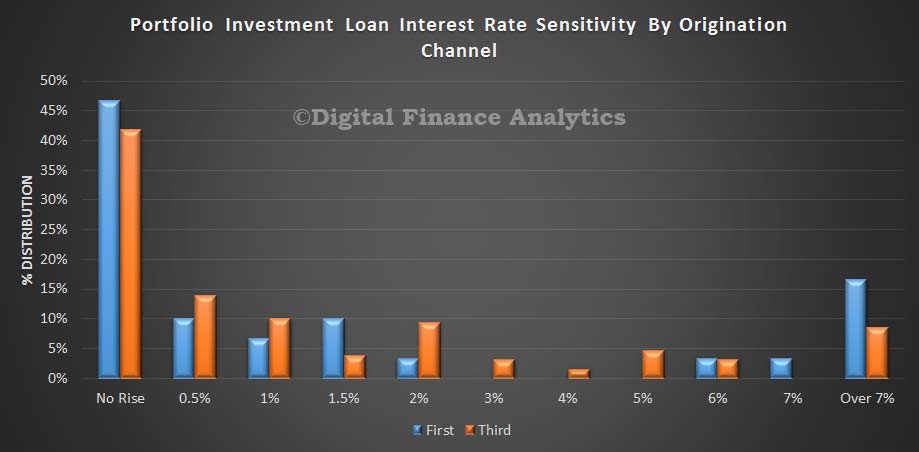
Refinanced-OOOn the investment property side of the ledger, among portfolio investors – those with multiple properties in a portfolio, there was a higher proportion who would be exposed by any rate rise among those going direct to a bank, compared with a broker – but the difference is quite small and combined more than 40% of portfolio investors would have issues if rates rose.

Portfolio-Investor-HeadroomWhen we looked at all investment loans, we found that households who obtained a loan via a broker were slightly more likely to be under the gun if rates rose, and a significantly higher proportion of borrowers who went direct to a bank were confident of handling a rise of more than 7% from current levels.

Broker-Headroom Consolidating all the results, we conclude that households who accessed loans via brokers have on average less head room to accommodate rate rises compared with those who went direct. APRA is correct.

Broker-and-OO-Headroom