Capital Rules Likely To Be Sharpened

In an important speech given today by Wayne Byres, Chairman of APRA, “Perspectives on the Global Regulatory Agenda”, there are some important pointers which indicate to me that we should expect some changes to the capital regulatory framework quite soon. We highlighted the capital questions recently.

Whilst talking about the global agenda, he did confirm the FSI Inquiry view that local and global cannot be separated. Whilst Basel III was focusing on systemically important banks, the current agenda is to minimise the impact of bank failure. He comments that the role of internal models now being used by the large banks to calculate capital requirements is being questioned. “The Chairman of the Basel Committee has made it clear that there is a problem, and something must be done about it”. APRA recently indicated that the route would likley be an increase in the risk weightings.

Next he discussed the need to bolster the ability of banks to handle losses should they arise.

Finally, he also highlighted concerns about bank culture, and the incentives which drive behaviour within these organisations.

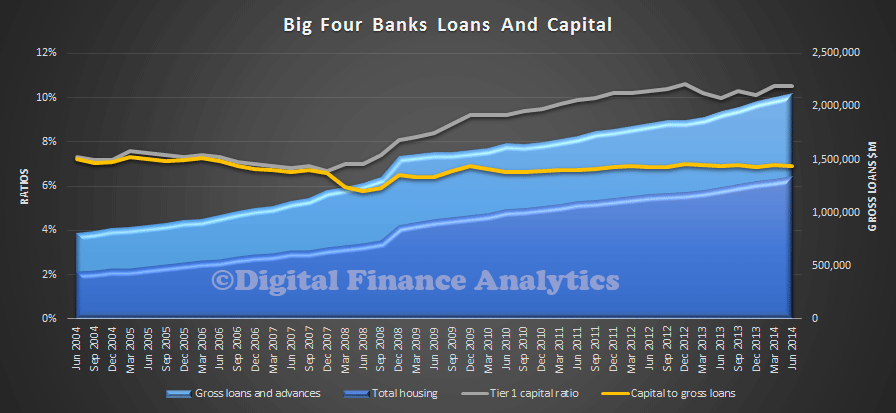
These are important issues, and as we showed, the major Australian banks now hold less capital to assets than they did before the GFC, and before Basel II and III were implemented. This is a concern.

BanksRatiosJuly2014How might this play out?

Well, we would expect banks using the advance internal methods of capital calculation will be required to hold more capital than they do today. This will reduce their ability to lend, and raise the costs of loans to borrowers. Second, we would expect the concept of creating additional categories of capital using subordinated instruments to be blocked (many of the banks have been calling for this, as it would reduce their capital costs further). Finally, we we expect lending standards to be examined, and especially serviceability, or loan to income criteria be established.

Whether this will be triggered by the findings from FSI, or directly by APRA is an open question. But it looks to me as if capital just got more expensive for the large players. Some would say, better late then never!

But strangest of all is the apparent disconnect between the RBA minutes today which highlighted the banks strong capital position, and the APRA discussions. They cannot both be right.



Bank Profits Up To $8.4 Billion In June Quarter – APRA

Yesterday APRA published their quarterly ADI performance statistics to June 2014. So today we look at some of the detail contained in this mammoth release, with a focus on the four major banks, which makes up the bulk of the industry.

APRA reported that the net profit after tax for all ADIs was $8.4 billion for the quarter ending 30 June 2014. This is an increase of $0.1 billion (1.2 per cent) on the quarter ending 31 March 2014 and an increase of $0.2 billion (2.6 per cent) on the quarter ending 30 June 2013. The profit margin for all ADIs was 32.3 per cent for the year ending 30 June 2014, compared to 29.8 per cent for the year ending 30 June 2013. Impaired facilities were $19.9 billion as at 30 June 2014. This is a decrease of $1.8 billion (8.3 per cent) on 31 March 2014 and a decrease of $5.9 billion (22.9 per cent) on 30 June 2013. Whilst there are 161 entities within the data, a quick analysis of net profit shows that the big four have the lions share of profit after tax. So, we will focus our analysis on the majors.

AllandMajorsNetProfitJune2014We note that for the majors loans and deposits continue to grow, and they are overall quite well aligned, though deposit growth is slowing slightly more recently.

MajorsGrowthDepositsandLoansIncomeJune2014Looking at income sources for the majors, overall net interest income continues to rise, but the impact of lower rates, and discounting in the home loan market shows that gross interest income from the home loans has fallen from its peak in 2011. Bank margins are rising thanks to a change in funding, and lower international capital market rates.

MajorsInterestIncomeJune2014Looking at fee income, we see fees holding their own in value, but as a percentage of all income, fees are falling, standing at 20% of total income in the most recent quarter.

MajorsFeeIncomeJune2014Lower interest rates have had an impact on the mix of deposits, with more money going into call deposits than term deposits. With rates so low, term deposits, and certificates of deposits are less attractive.

MajorsDepositMixJune2014Looking at asset quality, the value of specific provisions have fallen again, as impaired facilities and past due payments have reduced. In fact the bulk of the profit growth can be traced to a reduction in the level of provisions!

MajorsAssetQualityJune2014Capital ratios stand at 12%, the highest they have been, although these are relatively modest compared with some other countries. We commented on the capital ratio question recently.

MajorsHomeCapitalJune2014So, overall, the banks remain strong, but the big four which dominate the banking scene in Australia are relying largely on the release of provisions and improved margins to maintain profit growth and profit margins.

Interest Only Loans Up To 43.2% In June – APRA

APRA just released their quarterly data on housing exposures of the Authorised Deposit-taking Institutions in Australia for the June 2014 quarter. As at 30 June 2014, the total of residential term loans to households held by all ADIs was $1.23 trillion. This is an increase of $29.7 billion (2.5 per cent) on 31 March 2014 and an increase of $97.2 billion (8.6 per cent) on 30 June 2013. Owner-occupied loans accounted for 66.2 per cent of residential term loans to households. Owner-occupied loans were $811.7 billion, an increase of $16.5 billion (2.1 per cent) on 31 March 2014 and $56.5 billion (7.5 per cent) on 30 June 2013.

ADIs with greater than $1 billion of residential term loans held 98.4 per cent of all residential term loans as at 30 June 2014. These ADIs reported 5.1 million loans totalling $1.21 trillion and an average loan size was approximately $237,000, compared to $230,000 as at 30 June 2013.

There are a number of interesting observations within the data, but the one which stands out is the continued growth in interest only loans. Looking at the new loans written, we see that 43.2% were interest only loans. This is the highest ever, and reflects the growth in investment loans where tax offsets are maximized by keeping the balance as high as possible.

NewLoansInterestOnlyJune2014We also see a growth in the number of loans which are approved outside normal criteria. It lifted to more than 3.5% of all loans written in the quarter. At a time when regulators are stressing the importance of good lending practice, this is a surprise, but reflects the fact that larger loans are required by some to chase inflated house prices.

OutsideServicabilityJune2014The proportion of new loans originated via brokers was 43%, based on the value of loans written. This is the highest for 5 years.

BrokerLoansJune2014Low documentation loans continue to make up only a small proportion of all loans written.

LowDocJune2014Turning to the portfolio data, (the stock of all loans held by ADI’s) we see the continued growth in interest only loans, to 35% of all loans, the continued fall in low document loans,

LoanStockTypesJune2014

The average loan balances across the portfolio for loans with offsets, and interest-only mortgages continues to rise, with the average balance for the latter now at $299,000.

LoanStockAverageBalancesJune2014Investment loans across all ADI’s now make up 33.8% of all lending in the portfolio.

LoanStockPCInvestmentJune2014We see that the number of lending entities fell again to 162, highlighting continued concerns about the competitive tension in the industry.

NumberofEntitiesJune2014


Super Balances Now Up To $1.85 trillion – APRA

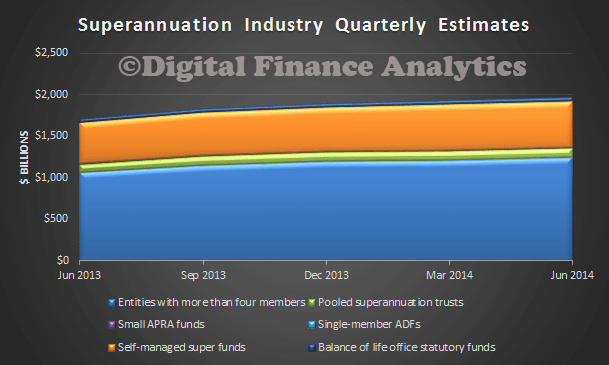
APRA just published their Quarterly Superannuation Performance data to June 2014. Superannuation assets totalled $1.85 trillion at the end of the June 2014 quarter. Over the 12 months to June 2014 there was a 15.3 per cent increase in total superannuation assets. Over the June 2014 quarter, total superannuation assets increased by 2.6 per cent.

SuperJune2014 There were $27.6 billion of contributions in the June 2014 quarter, up 5.9 per cent from the June 2013 quarter ($26.1 billion). Total contributions for the year ending June 2014 were $95.0 billion. Outward rollovers exceeded inward rollovers by $531 million in the June quarter. There were $14.7 billion in total benefit payments in the June 2014 quarter, an increase of 8.3 per cent from the June 2013 quarter ($13.6 billion). Total benefit payments for the year ending June 2014 were $55.3 billion. Net contribution flows (contributions plus net rollovers less benefit payments) totalled $12.4 billion in the June 2014 quarter, an increase of 15.1 per cent from the June 2013 quarter ($10.8 billion). Net contribution flows for the year ending June 2014 were $37.3 billion.

The number of entities with assets of more than $50m fell by 3 in the last 12 months, from 213, to 210.

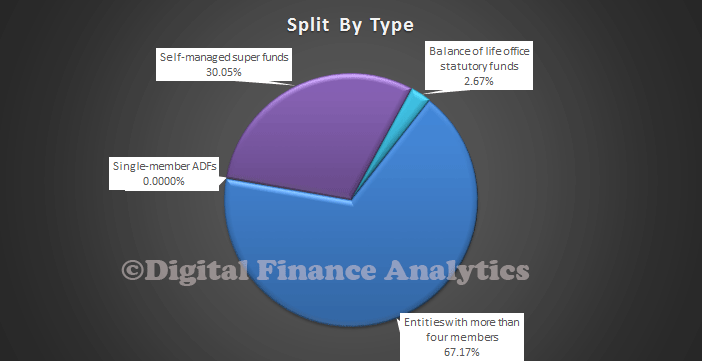
The self managed super fund sector, according to the ATO, accounted for 30.05% of all assets.

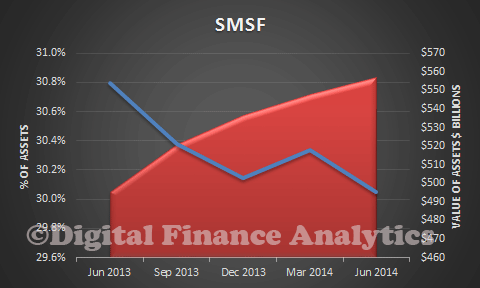
SuperSplitJune2014The value of assets in SMSF continues to grow, standing at $557 billion (the red area), although the absolute percentage has fallen in the past year, from 30.8% to 30.05% (the blue line).

SuperSMSFSummaryJune2014