In the second part of our series on the anatomy of the property auction results, we dive deeper into the numbers.
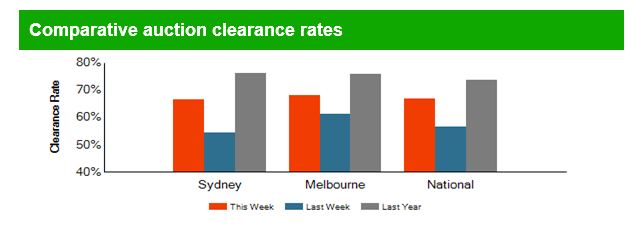
 We compared data from CoreLogic and Domain, two of the players who report auction clearance rates. We summarised the research in our latest video blog.
In each case, there is an interim step, where both Domain and CoreLogic adjust to a lower number of actual auctions on the day. Domain calls them “the number of reported auctions” and CoreLogic “CoreLogic Auctions”.
So, this takes us to two questions. First how are the figures collated and second, what adjustment are made between the listed auctions and final figures?
Domain says their data comes from Australian Property Monitors (APM). APM is of course part of the Domain Group which is a subsidiary of Fairfax Media Limited. APM publishes auction activity results for the Sydney, Melbourne, Brisbane and Adelaide capital cities every Saturday evening, providing a snapshot of how demand and supply in the auction market is behaving and as a leading indicator for the overall property market. (Auction activity for the other capital cities is also monitored and made available by mid week)
APM adopts the Australian Bureau of Statistics geographic definition for capital cities, referred to as the Statistical Division (SD).
APM publishes Auction Clearance Rates (ACR) on the Saturday evening, based on the majority sample collected on that day, for release across various publications on the Sunday, while the process of collecting results continues throughout the week.
When reporting auction activity, APM monitors the following five key elements that can occur to properties listed for auction. These are;
- a) Sold prior to auction;
- b) Sold at auction (under the hammer)
- c) Passed in
- d) Withdrawn from auction, or
- e) Sold after auction
Including some or all of these five elements of auction activity in the calculation used will affect the reported clearance rate.
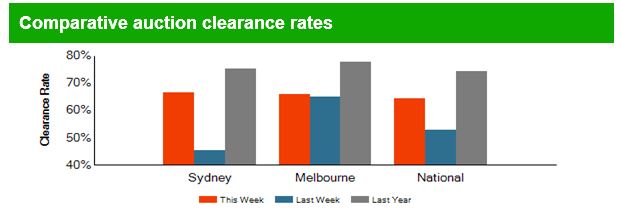
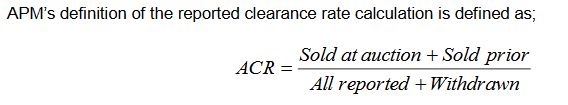
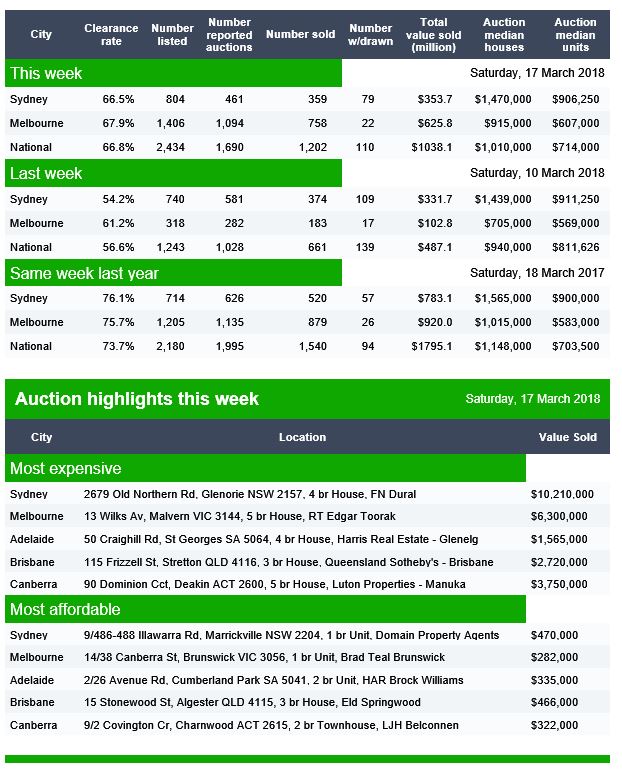
APM’s definition of the reported clearance rate calculation is defined as: Sold at auction plus sold prior, over all reported plus withdrawn.
On the “top-line” of the clearance rate calculation, APM considers only those properties sold either prior or during the auction to be “sold at auction”.
On the “bottom-line”, APM includes all reported auctions (including properties passed in), and any listed auctions withdrawn prior to the scheduled auction time.
APM includes withdrawn auctions in the calculation to prevent any bias in the clearance rate caused by properties being withdrawn due to expectations it may not sell or fail to achieve an expected price. It’s still counted as no sale.
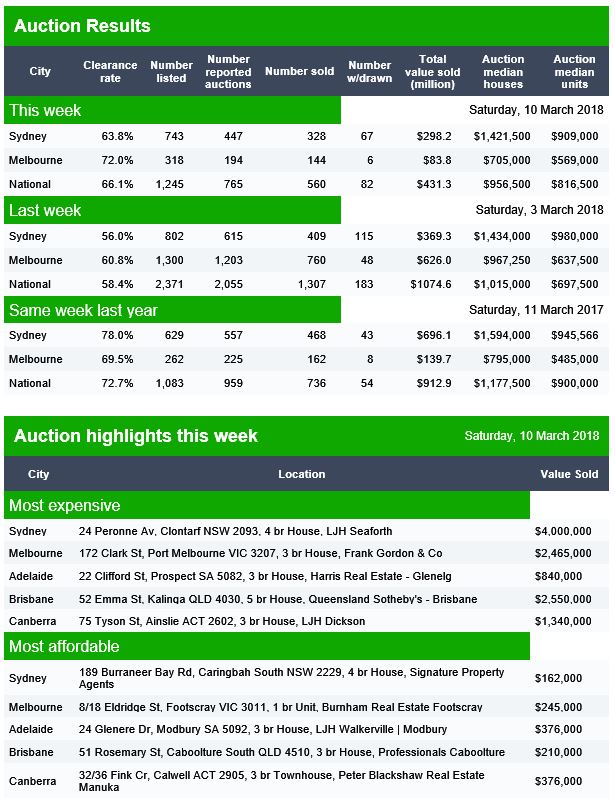
I also examined in detail the weekly listings of property sold, each transaction is coded in line with the APM method. I also saw a small number of what appeared to be duplicate transactions across weeks, but not a significant number so I think we can lay to rest the idea that the results may be being inflated by duplicating the same results across multiple weeks.
Turning to CoreLogic, I spoke with Tim Lawless their research guru. This is what he told me:
Our auction data is collected directly from the industry, via a variety of channels including our call centre based in Adelaide, results which are pushed through from agents via our app or portal, or via direct data feeds from agency groups. Each week we publish three sets of clearance rates: Saturday night, Sunday morning (CoreLogic media release) and final results on Thursday morning. The collection of auction results progressively improves across each release as we receive more results from the industry. By the time we finalise our collection on Wednesday afternoon, on average, we collect 90% of auction results.
There has been some discussion that auction results which are not reported each week must also be unsuccessful auctions intentionally withheld by the agent. There may be an element of this – real estate agents aren’t obliged to provide us with their results, however each week it is generally the same agents who choose not to provide their auction results to us.
Regardless, we publish our results with full transparency, showing the number of auctions, together with the number of results collected segmented by successful auctions (sold before, at or prior to auction) and unsuccessful results (unsold, vendor bid, withdrawn). For those that believe the clearance rate should be adjusted lower based on unreported auctions, it’s pretty easy to do so… however the direction of the trend would be very similar, just a lower clearance rate.
For a long time there has been discussion around whether auction results are accurate or not. As a data aggregator and analytics provider, it’s in our best interest to publish results that are as accurate as possible; we have no interest in talking the market up or down.
Thanks Tim.
My take out of that is there may be some holding back of failed sales by some agents, but there is no way to triangulate the quantum of the problem, and there is no mandatory reporting of results. So the data must be seen as a best endeavours exercise. Tim also makes an excellent point that the trends really tell the tale.
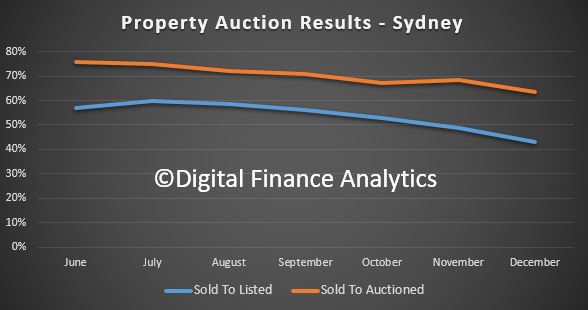
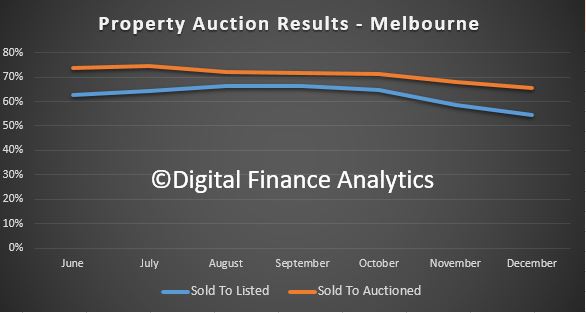
So, one final piece of the puzzle is some analysis we have done of the results, using both the percentage of all listings and sold property. I have charted the monthly trends for the second half of last year.
Here is the plot for Sydney. We see the clearance rates are declining, and the ratio of sold to listed is falling faster – suggesting that more properties are withdrawn (perhaps a sign of a fading market).
 Compare this with Melbourne, where the momentum is also slowing, but the ratio of sold to listed is not so far below the sold to auctioned ratio – which suggests Melbourne is a little more buoyant (though is still slowing).
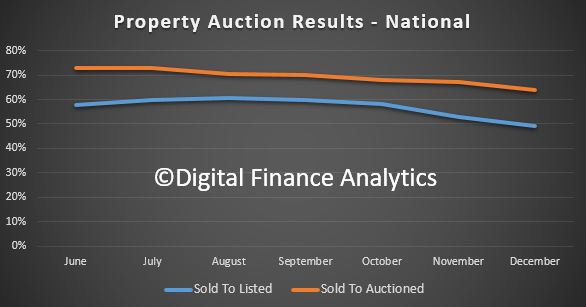
 Finally, we can look at the national picture, which tells a similar story.
 One final piece of the puzzle. If I then calculate the number sold properties compared with the transfer counts, which we discussed in a previous post, in the quarter to September 2017, the auctions comprised around 32% of all transfers made – allowing for an average 6-week delay in settling and completing the transaction. Looking back further, this ratio is pretty consistent. But in the December quarter, this shot up to 62% of transfers, which suggests that either there is now more false positives in the auction data, or the volume of non-auction sales has fallen. The former is, I think more likely than the latter, because in a falling market, I would expect a smaller number of auctions to run, compared with private sales. And we know that the listing volumes, and time in market, as well as discounts made to close a sale are all rising.
So, I think we need to be very careful when using the auction data. There is potential for agents to withhold negative results, but no one knows the extent of this. There is also some evidence of double counting, but only at the margin. Sydney looks the most suspicious.
In terms of the calculations, there are various tweaks made to the numbers and the two sources of data we looked at came out with different results. The trends are most telling, and the momentum was easing, up to the end of last year. We have not had enough normal weeks since January to trend the more recent weeks, and the ABS data will not be out for several weeks. We will revisit this later in the year
The most telling data is the mapping, or lack of it between the transaction data from the ABS and the auction results. This suggests to me there are more questions to ask. I have put some questions in to the ABS to dig further into their datasets, but I am still waiting for a reply. I will update you when I hear back. My suspicion is that ABS uses data feeds from CoreLogic, but the relevant page which outlines this, and the various terms report a missing page – 404 error – on the ABS site. Not good.
So here is the bottom line, be cautious with these numbers, and remember they have no statutory authority, may be contaminated with partial data, and of course the “marketing” use of the data may pull against the quest for accuracy, especially remembering Domain’s links to Fairfax and its property related businesses.
So, my conclusion is, we are without a really good chart and compass, here, just as we are with the RBA data series. More noise in the system!