ABA Says Growth in Fees Paid by Households and Businesses Remains Low

On the day the RBA published its analysis of banking fees, the Australian Bankers Association also released their report.

The ABA’s report is based on the RBA’s banking fees survey. The ABA data is different to the RBA data for personal loans, (and hence aggregate fees paid by households), because of a discrepancy in the treatment of data for personal loans for one bank. This results in ABA data showing aggregate fees paid by households were flat while RBA shows a very small rise. The RBA has included the full amount of the discrepancy in their data this year, while the ABA did not have sufficient information to allocate the data accurately. Both the ABA and RBA will review the treatment of this discrepancy next year.

Total bank service fees increased slightly to $12.5 billion in 2016, but increased less quickly than bank activity.

Fees paid by households were broadly unchanged at $4.3 billion in 2016. They averaged around $9.00 per week for each household and have changed little in five years.

Fees paid by businesses increased by 1.5 per cent to $8.2 billion in 2016, but remained well below the peak of 2007.

What is missing from both the RBA and ABA report is segmented analysis. For example, the RBA says SME’s bear significant loan fees, and there is no analysis of which households pay more, or less. We think bank fees vary across households, and exception fees hit a small but significant portion of households. Averages are relatively meaningless.

Exception fees, which include include late payment fees and over-the-limit fees, accounted for 5.8 per cent of all bank service fees this year. A total of $724 million in exception fees were paid by households and businesses over 2016 – an increase of 5.6 per cent or $38 million. Households paid $611 million in fees while businesses paid $113 million. This is an increase of $8 million for households and $83 million for businesses.

The number of customer transactions, loans and accounts are increasing but growth in fees paid by households and businesses remains low, the Australian Bankers’ Association said today.

“The past year has seen little change in bank fees paid by households, at the same time as more than 900,000 new home loans were provided by banks, and half a million new credit card accounts were opened,” ABA Chief Executive Anna Bligh said.

“This is due to a combination of factors including strong competition, more low-fee and no-fee products being offered, and the industry’s efforts to educate customers about how to minimise the fees they pay.”

The ABA report1 released today, Fees for banking services, shows the average weekly bank fees paid by households is $9, the same amount it has been over the past five years.

“We know how important transaction accounts are for bank customers to do their day-to-day banking and virtually every Australian has one. Pleasingly, the amount households paid in 2016 in fees for their transaction accounts was at its lowest level in 15 years.

“At the same time, we’re seeing more people using their transaction accounts more often,” Ms Bligh said.

“Also, mortgage fees relative to the number of home loans provided to customers were the lowest on record and fees for credit cards relative to the amount of credit accessed remained at the lowest level in more than a decade.”

Ms Bligh said bank fees paid by businesses for loans were also low when compared to the increase in lending.

“Over the past year, the increase in fees of 2.4 per cent was well below the 8 per cent increase in business loans.

“Large businesses accounted for 58 per cent of bank service fees from business loans,” she said.

Other key findings include:

  • Fees as a proportion of banks’ operating income is 13 per cent, well below the peak of 18 per cent in 2003.
  • Credit card fees as a proportion of the total balance outstanding is 3.7 per cent, which is around the same as the past 10 years.
  • Bank fees relative to their assets (the bulk of which is loans) is at a record low of 0.37 per cent.

Bank Fee Income Growing More Slowely

The latest RBA Bulletin includes a section on Bank fees. In 2016, domestic banking fee income from households and businesses grew at a relatively
slow pace of 1.7 per cent, to around $12.7 billion.

Deposit and loan fee income relative to the outstanding value of products on which these fees are levied was slightly lower than in the previous year.

Banks’ fee income from households grew by 1.5 per cent in 2016. This represented a slowing in growth from the previous year, reflecting lower
growth in fee income from housing lending and credit cards.

Growth in fee income from credit cards slowed in 2016 to slightly below the average since 2010, but remains the largest component of fee income from households. The growth in fees was supported by continued take-up of credit cards bundled with home loan packages. There were also more instances of fees being charged, with some banks no longer waiving fees for transferring a credit card balance to a new card provider.

Total fee income from businesses increased by 1.9 per cent in 2016, around the slowest pace for a decade. Slower growth was recorded for fee income from both small and large businesses. By product, growth in fee income
was driven by increases in business loan fees and merchant service fee income from processing card transactions. Fee income from deposit accounts also increased slightly, while fee income from bank bills and other sources declined. The increase in business loan fees mainly
reflected higher reported fee income from small businesses.

Growth in merchant service fee income was mainly attributable to increased transaction volumes, particularly for credit cards due to wider
acceptance of contactless payments. Increased use of platinum and business credit cards, which attract higher interchange fees, also contributed to growth in merchant service fee income from small businesses. Nevertheless, growth in merchant service fee income was evenly spread across small and large businesses.

Total fee take was $12.6 billion, still a substantial sum, but small beer compared with the $31 billion grabbed by the superannuation industry.

Time To Read Your Credit Card Small Print

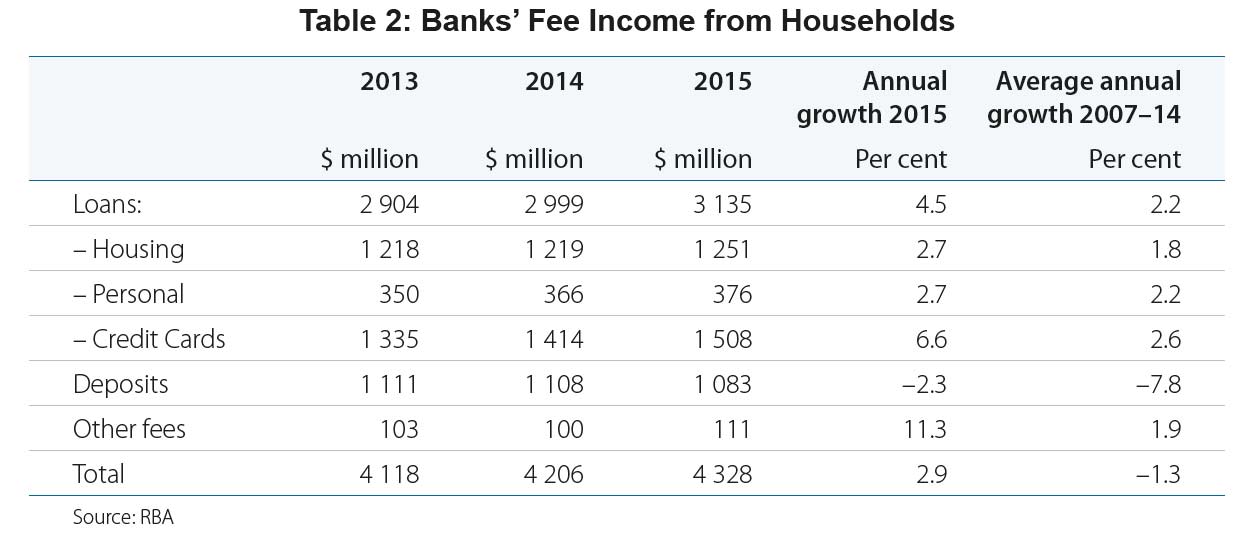
Our research shows that households do not know what they are paying in fees and charges on their credit cards, nor the value of “rewards” on these cards. This is over and above transaction surcharging which has been subject of recent regulatory review.  The RBA says in 2015, households paid $1.5 billion in card fees, up 6.6% from the previous year.

Bank-Fees-2016-2

In fact there have been a number of changes to the terms and conditions of credit cards from several of the large providers. This is in response to recent changes to payment regulation, and banks seeking to capture more value from non-revolving card holders.

It is worth checking the true value of rewards points, which we think are being devalued (the so called earn and burn rate) means you spend more for less benefit. In addition, fees on reward cards have been rising steadily.

In addition, there are a range of other potential transaction fees. For example, an Australian dollar transactions from overseas merchants now carries a fee, by for example the CBA. Whilst foreign currency transactions did cop a charge, Australian dollar transactions did not. The CBA says:

We charge you an international transaction fee when you make a purchase or obtain a cash advance (whether in a foreign currency or Australian dollars):

While overseas; or In Australia (for example online) where there is an overseas connection, as the merchant, or the financial institution or entity processing the transaction, is located overseas. The international transaction fee for these transactions is:

  • Transactions converted by MasterCard® or Visa – 3.00%
  • Transactions converted by American Express® – 2.00% (plus a currency conversion factor of 1.50% which is included in the converted transaction amount)
  • Transactions in Australian dollars but with an overseas connection – 3.00%
  • In some cases, overseas merchants may allow you to pay in Australian dollars, e.g. when you’re shopping online or over the phone. This is still considered an international transaction because your transaction is processed overseas.
  • Note: Even though a merchant has a website address ending in ‘.com.au’ and displays prices in Australian dollars, they may still be located overseas or otherwise choose to process their credit card payments outside of Australia.  It’s best to check with the merchant before you pay if you are unsure.

Depending on your card use – if you revolve and pay interest, then the interest charges will swamp most other charges, – it would be worth looking at some of the non-reward, no fee cards which are available, because these sneaky little fees soon add up.

We think there is a case to make the disclosure of fees on credit cards clearer, and for consumers to reconsider whether reward schemes attached to cards are worth having at all. You can compare cards here.

Bank Fees Rose More than 3% Over The Year

According to the Australian Bankers Association, total bank fees paid by households and businesses were $12.5 billion in 2015. This is an increase of 3.4 per cent over the year, (which is significantly higher than inflation). The ABA report, Fees for banking services, was released, on the same day as the latest analysis from the RBA.

The mix of fees has changed, with more drawn from loans and payments, whilst fees on transaction accounts – a product used by virtually every household – are now at the lowest level in 15 years. Fees have fallen by $1 billion or 51 per cent since the peak in 2008, yet the number of transactions has increased by around 60 per cent over that same time.” “Households are paying an average of $9 a week in bank fees – the same as what we were paying in 2004”

The ABA highlighted the increased volumes of products and services accessed. “Banks provide around six million housing loans and last year alone approved more than 900,000 new home loans. The number of credit card accounts also increased last year by more than half a million to 13.5 million. So, the growth in fees paid on home loans and credit cards is low given many more of these products are in the market”

The RBA data, contained in the latest Bulletin, shows overall growth of 3.5%.

Bank-Fees-2016Banks’ fee income from households grew by 2.9 per cent in 2015, the third consecutive year of positive growth. Higher fee income largely reflected growth in fee income from credit cards, which grew strongly for the second consecutive year. Growth in housing and personal lending fees was moderate, while fee income from deposit products declined in 2015. Fee income from credit cards, the largest single source of fee income from households, increased strongly in 2015. The increase in fee income from credit cards was due to both more instances of fees being charged and an increase in unit fees on some products. An increase in currency conversion fees incurred by households for overseas purchases was largely a result of an increase in the number of foreign currency transactions, with only a small increase in average unit fees. Banks increased some unit fees during 2015, in particular those relating to credit card annual fees and cash advances. Several banks also increased fee income from credit cards through the acquisition of existing credit cards from other providers.

Bank-Fees-2016-2The main drivers of modest growth in fee income on personal lending were higher unit fees and increased turnover. Some banks also increased lending volumes, resulting in higher establishment and loan registration fee income. Exception fees and transaction fees on personal lending declined. Growth in fee income from housing loans was consistent with housing credit growth during 2015. Higher fee income was due to a higher volume of new loans, more instances of early repayment fees and, to some extent, higher unit fees on home loan packages. The major banks and large regional banks recorded the highest growth in housing loan fee income, while some smaller regional banks reported declines in fee income as a result of lower volumes of loans.

Fee income from deposit accounts declined further over 2015. The decline in fee income was broad based across most types of deposit fees, but there were notable declines in fee income relating to non-transaction accounts such as term deposits and online savings accounts.

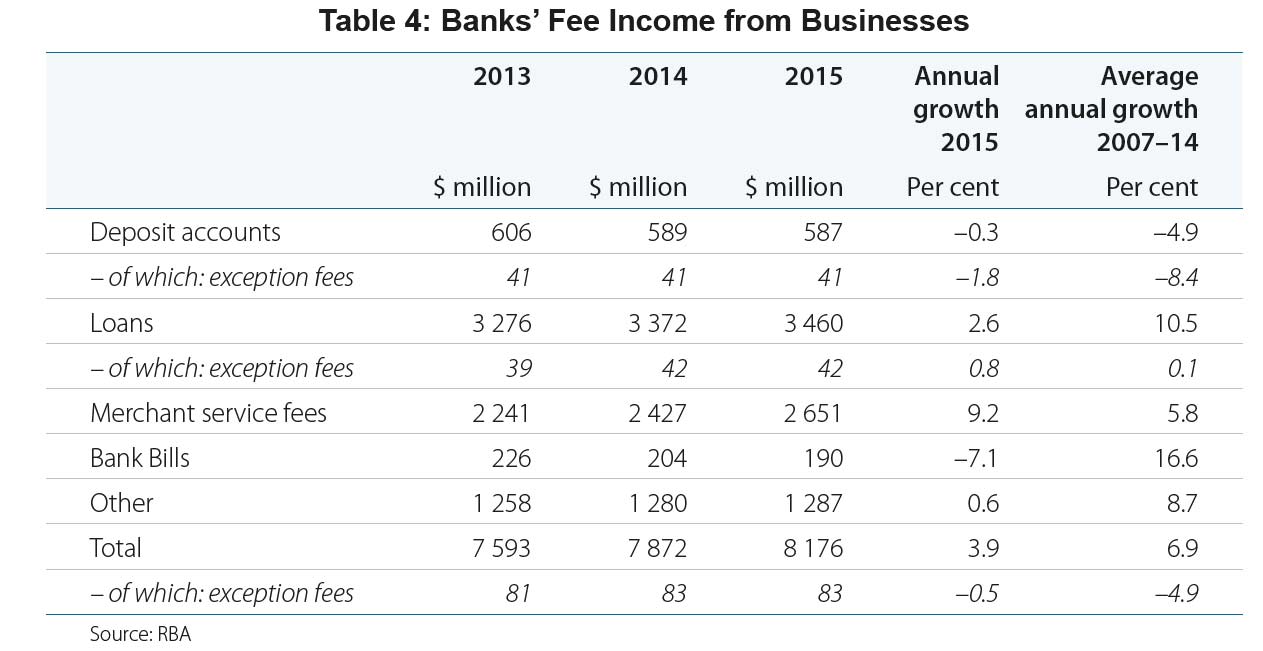
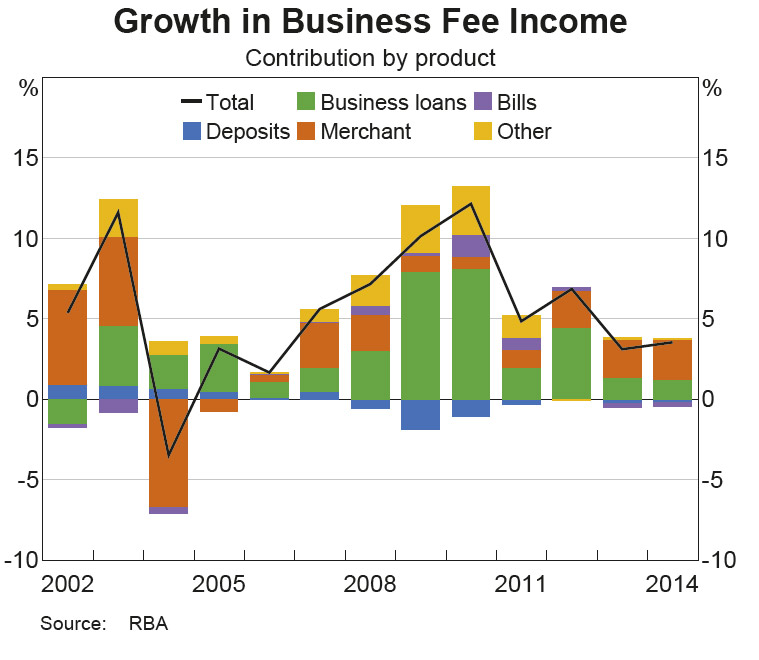
Total fee income from businesses increased by 3.9 per cent, primarily reflecting higher fee income from small businesses. By product, growth in fee income from businesses continued to be driven by merchant fees and business loans. Fee income from bank bills declined sharply in 2015, similar to previous years. Fee income from other business products was little changed. The increase in loan fee income was mainly due to increases in unit fees for small business loans, although lending volumes also increased. Loan fee income from large businesses declined over 2015 as several banks lowered their unit fees due to increased competitive pressures.

Bank-Fees-2016-3Growth in merchant fee income over 2015 was evenly spread across small and large businesses. The increase in income from merchant fees was largely a result of growth in the number and value of transactions, resulting from a higher number of merchant terminals on issue and increased use of contactless payments. This partially offset a decline in fees earned on cash payment services, via ATM and deposit account withdrawals. A few banks also increased unit fees on merchant services, although the ratio of merchant fee income to the value of credit and debit card transactions continued to decline during 2015. Fee income from business deposit products also declined slightly. This was mainly due to a reduction in deposits held by these customers; however, the decline in fee income was also the result of customer switching between deposit accounts in order to make use of lower fee products.

Bank Fees $12 Billion in 2014

The RBA just published the results of its annual bank fee survey, based on data from 16 institutions covering 90% of the Australian banking sector. Last year, overall fees rose 2.8% to $12 billion compared with 2.6% the previous year. The rise is a combination of rises in unit prices, and volumes. Households fees rose 1.5% to $4,141 million, and business grew 3.5% to $7,791 million. The data does not include wealth management, broker, loan mortgage insurance, or other fees across financial services and the non-bank sector.

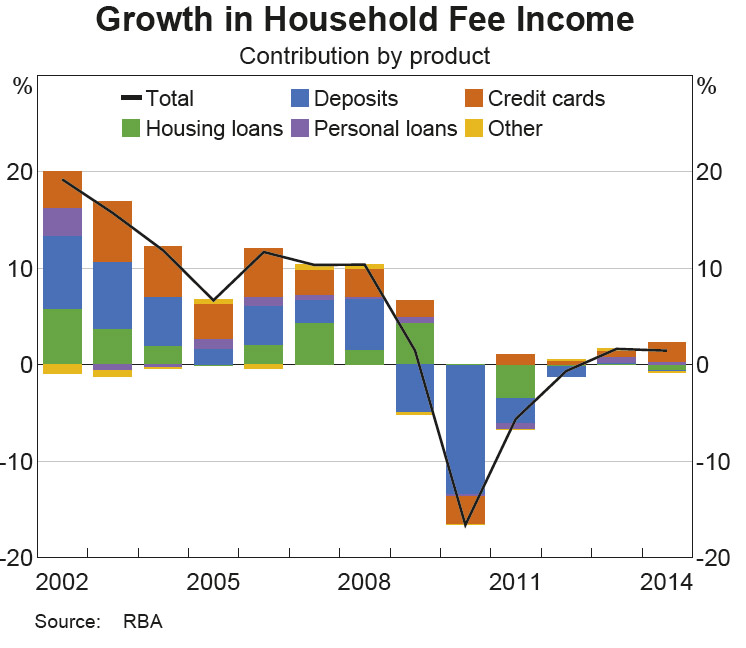
Looking in more detail at households, higher fee income reflected growth in credit card and personal lending fees, whereas fee income from housing lending and deposit accounts declined.

Household-Fees-2014Fee income from credit cards, which represents the largest component of fee income from households, increased by 5.9 per cent. You can read our previous analysis of the credit card business here.

Total deposit fee income decreased slightly in 2014, following a modest increase in 2013. The decrease in fees from household deposits was broad based across most types of fees on deposit accounts. In particular, account-servicing and transaction fee income, as well as some fee income on other non-transaction accounts (e.g. break fees on term deposit accounts) declined notably. This decrease was the result of fewer customers incurring these fees rather than a decrease in the level of fees, as well as customers shifting to lower fee products. However, this was partially offset by an increase in income from more frequent occurrences of exception fees (such as overdrawn fees and dishonour fees) and foreign exchange conversion fees being charged on deposit accounts involving such transactions.

Total fee income from housing loans decreased in 2014, with all components of housing loan fee income decreasing, including exception fees. This was due to a combination of fewer instances of penalty fees being charged, and lower unit fees as a result of strong competition between banks in the home lending market. Similar to 2013, there was a decrease in fee income from housing lending despite strong growth in such lending. Several banks again reported waiving fees on this type of lending for some customers.

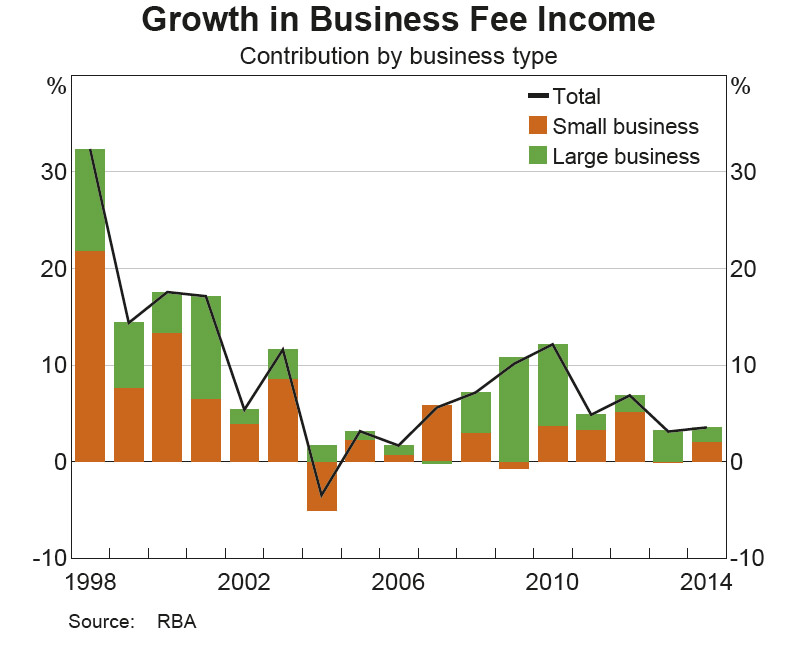
Fees to business rose, across both small and large businesses.

Business-Fees-By-Coy-Size-2014Growth was driven by increases in merchant service fee income and, to a lesser extent, fee income from loans. Business fee income from deposit accounts and bank bills declined over 2014.

The increase in merchant service fees was mainly attributable to an increase in utilisation of business credit cards and a slight increase in some merchant unit fees. Merchant fee growth was approximately evenly spread across both small and large businesses. The increase in loan fee income was mainly from an increase in account-servicing and exception fees from small businesses, which was a result of higher lending volumes (including through the introduction of some new lending products). Fee income from loans to large businesses increased slightly due to a higher volume of prepayment fees (though this was mostly offset by declines in other fee income from large businesses).

The increase in exception fee income from business loans was also mainly from small businesses, mostly in the form of honour fees (fees charged in association with banks honouring a payment despite insufficient funds in the holder’s account).

Fee income from business deposits continued to decline in 2014, with most of the decrease resulting from lower account-servicing and transaction fees, particularly for small businesses (small businesses account for the majority of business deposit fee income). The decrease was the result of a combination of lower volume growth and customers shifting to lower fee products.

Business-Fees-By-Type-2014  We observe that the “fee wars” appears to be over now (triggered by NAB a few years ago), and we expect to see subtle rises in fees as bank margins come under increasing pressure. Also, small business bears the brunt of the charges across a number of categories, and we expect this to continue, because the sector is under less pressure from a bank competitive standpoint, and many SME’s have no where else to go.

Court Approves Application Paving Path To Bank Fees Settlement

According to a media release from Maurice Blackburn, the Federal Court has today approved orders to help facilitate settlement negotiations in the bank fees class action against the National Australia Bank.

NAB has publicly indicated its commitment to exploring settlement opportunities, and law firm, Maurice Blackburn Lawyers, worked with the bank in agreeing on today’s orders.

Today, in the Federal Court in Sydney, Justice Jacobson approved orders that will give all NAB customers a further opportunity to participate in this class action, and potentially to recover millions of dollars charged in exception fees.

Between 25 November this year and 27 January 2015, NAB customers who haven’t already registered their interest in joining the class action, will be able to do so.

Banking Fees Cost $11.6 bn

We have updated our bank fee analysis, to take account of the 2013 data from the RBA. They collect fees data from 17 banks operating in Australia, covering over 90 per cent of total banking sector assets. Each bank provides data on income received over the financial year that is used as the basis for their public annual accounts. All fees are net of rebates and other concessions granted.

It does not include wealth management, broker, loan mortgage insurance, or other fees across financial services and the non-bank sector. The total reported in more than $11.6 bn, up 2.6% from 2012. Business fees grew at 2.8%, and Household fees at 2.3%. Business contributed around 65% of all fees in 2013.

Fees2013SplitsLooking at fees charged to households, we see total fees are below their 2009 peaks, when exception fees reach their highs, and before banking competition, led by nab initially, forced some fees down.

Fees2013HouseholdsTrendIn 2013, credit cards remains the single largest source of fees at 29%, with housing loans at 26% and transaction deposit accounts 22%.

Fees2013HouseholdsLooking at fees charged to businesses, we see a consistent rise. This is one reason why many small businesses continue to struggle.

Fees2013BusinessTrendIn 2013, 42% of fee income came from business loans, 30% from merchant service fees and 16% from other categories. Exception fees were around 1% of total business fees.

Fees2013Business


The RBA definitions are included below:

  • Deposit account fees comprise mainly account-servicing and transaction fees, but also fees for overdrawing the account.
  • Loans are either direct loans or accounts that have a facility to become overdrawn without penalty (particularly in the case of business loans). Loan account fees comprise mainly establishment and loan servicing fees.
  • ‘Credit card’ fees comprise mainly annual fees, but also include late payment, over-limit, cash advance and foreign-currency conversion fees.
  • ‘Other’ fees paid by households include fees from items such as travellers’ cheques, foreign currency transactions, and custodial services.
  • Fees from business also include fees and charges collected from government entities, including statutory authorities and corporatised bodies.
  • ‘Merchant fees’ include credit card and debit card fees charged to merchants, as well as non-transaction fees associated with the provision of terminal facilities.
  • ‘Bank bills’ fees include activation, application, commitment, drawdown, facility, late presentation, and line fees.
  • ‘Other’ business fees include export collections, foreign exchange guarantees, payroll service, safe custody and special clearance fees.
  • ‘Exception fees’ are those charged by the bank when the customer breaches the terms of a banking product, typically by making a late payment or exceeding a credit limit on a credit card or by overdrawing a deposit account.

A few observations. First the data is likely to understate the total fees being paid, as it relates to 90% of bank assets, and does not include the non bank sector, and other financial services categories. The average household will be paying more than $500 each year. We ran our international fee benchmarks, and discovered that total fee take is line ball with other similar markets, but we still have more fees active in Australia – more than 200 fee categories for households!

So banking fees is a nice little earner for the banks. The class action on late payment fees continues with attention being directed to nine banks – Westpac, Citibank, ANZ, CBA, NAB, St.George, BankSA, BankWest and AmericanExpress.

For comparison purposes, more than $18.6bn is charged by the wealth management sector, and $1.5bn by mortgage brokers.