APRA Released Revisions to the related entities framework for ADIs

APRA has released a discussion paper on making changes to the related parties framework for ADI’s. As APRA says an ADI’s associations with related entities can expose the ADI to substantial risks, including through financial and reputational contagion. Complex group structures may also adversely impact on the ability of an ADI to be resolved in a sound and timely manner. The consultation period open until 28 September 2018 and changes would come into force in 2020.

The existing requirements established by the Australian Prudential Regulation Authority (APRA) for authorised deposit-taking institutions (ADIs) governing associations with related entities are a long-standing and important component of the prudential framework for ADIs. The requirements have not been materially updated since 2003.

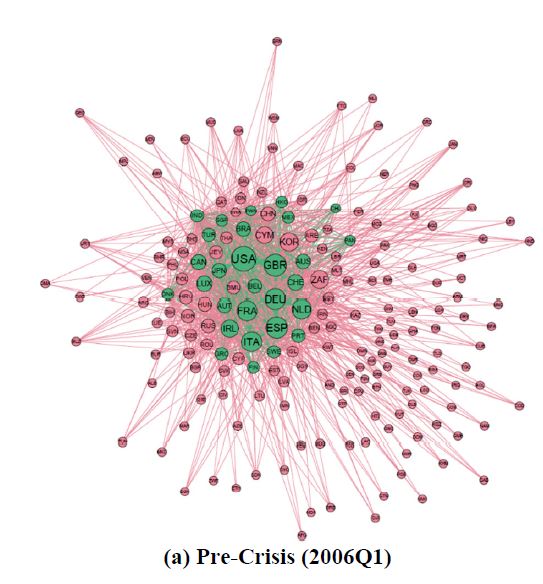
Since then, international developments have emphasised that deficiencies in prudent controls can expose an ADI to substantial risks in relation to its related entities. For example, during the global financial crisis, reputational pressures meant that overseas banks were inclined to support, often beyond their legal obligations, certain funds management vehicles that suffered significant falls in value or impaired liquidity. In effect, these banks were exposed to substantial credit and liquidity risks through their associations.

APRA is proposing to update its existing related entities framework to account for lessons learned from the global financial crisis on mitigating the flow of contagion risk to an ADI, particularly from related entities, and incorporate changes to the revised large exposures framework, published in December 2017. This update includes revisions to the:

  • definition of related entities to capture all entities (including individuals) that may expose the ADI to contagion and step-in risk. This is expected to impact all ADIs;
  • measurement of exposures to related entities by aligning with requirements in the revised large exposures framework. This is expected to impact all ADIs;
  • prudential limits on exposures to related entities. APRA is proposing to adjust the size of the limits and align the capital base used in limit calculations with the more appropriate Tier 1 base now used in the revised large exposures framework. The proposal is expected to primarily impact ADIs that have a small capital base;
  • extended licensed entity (ELE) framework by amending the criteria for a subsidiary to be consolidated in an ADI’s ELE. This is expected to impact those ADIs that utilise the ELE framework and particularly those that have offshore ELE subsidiaries, which hold or invest in assets; and
  • reporting requirements to capture more prudential information on substantial shareholders and subsidiaries that are treated as part of an ADI’s ELE. This is expected to impact more complex ADIs.

The impact of the proposed changes on each ADI will depend on, among other factors, the number and size of entities captured by the proposed definition of related entities; the size of exposures to related entities relative to an ADI’s capital base; the extent to which an ADI undertakes business through subsidiaries; and differences in how an ADI currently measures to related entities compared with the proposed methodology.

APRA is cognisant of the impact these reforms may have on ADIs and is particularly interested in receiving feedback on whether the proposed reforms best meet APRA’s mandate to improve financial safety and financial system stability without material adverse impacts on efficiency or competition. ADIs are encouraged to provide alternative proposals where it is considered that an alternative will better meet the prudential objectives.

APRA is seeking feedback on the proposed amendments with the consultation period open until 28 September 2018. Given the potentially material nature of the proposals, APRA anticipates that a finalised framework would come into force on 1 January 2020, with transition potentially offered to ADIs that are most impacted by the reforms.

Federal Reserve’s Review of Banks’ Capital Plans Highlights Some Gaps

In a release late last week, the FED said that as part of its annual examination of the capital planning practices of the nation’s largest banks, the Federal Reserve Board did not object to the capital plans of 34 firms but objected to the capital plan from DB USA Corporation due to qualitative concerns.

Due in part to recent changes to the tax law that negatively affected capital levels, two firms will maintain their capital distributions at the levels they paid in recent years. Separately, one firm will be required to take certain steps regarding the management and analysis of its counterparty exposures under stress.

The Comprehensive Capital Analysis and Review, or CCAR, in its eighth year, evaluates the capital planning processes and capital adequacy of the largest U.S.-based bank holding companies, including the firms’ planned capital actions, such as dividend payments and share buybacks. Strong capital levels act as a cushion to absorb losses and help ensure that banking organizations have the ability to lend to households and businesses even in times of stress.

“Even with one-time challenges posed by changes to the tax law, the CCAR results demonstrate that the largest banks have strong capital levels, and after making their approved capital distributions, would retain their ability to lend even in a severe recession,” said Vice Chairman Randal K. Quarles.

When evaluating a firm’s capital plan, the Board considers both quantitative and qualitative factors. Quantitative factors include a firm’s projected capital ratios under a hypothetical scenario of severe economic and financial market stress. Qualitative factors include the strength of the firm’s capital planning process, which incorporates risk management, internal controls, and governance practices that support the process.

This year, 18 of the largest and most complex banks were subject to both the quantitative and qualitative assessments. The 17 other firms in CCAR were subject only to the quantitative assessment. The Board may object to a capital plan based on quantitative or qualitative concerns.

The Board objected to the capital plan from DB USA Corporation due to qualitative concerns. Those concerns include material weaknesses in the firm’s data capabilities and controls supporting its capital planning process, as well as weaknesses in its approaches and assumptions used to forecast revenues and losses under stress.

The Board issued a conditional non-objection to the capital plans of both Goldman Sachs and Morgan Stanley and both firms will maintain their capital distributions at the levels they paid in recent years, which will allow them to build capital over the next year. Each firm’s capital ratios, under the capital plans they originally submitted and with the one-time capital reduction from the tax law changes, fell below required levels when subjected to the hypothetical scenario. This one-time reduction does not reflect a firm’s performance under stress and firms can expect higher post-tax earnings going forward.

The Board also issued a conditional non-objection for the capital plan from State Street Corporation. The stress test revealed counterparty exposures that produced large losses under the hypothetical scenario, which assumes the default of a firm’s largest counterparty under stress. The firm will be required to take certain steps regarding the management and analysis of its counterparty exposures under stress.

The Federal Reserve did not object to the capital plans of Ally Financial, Inc.; American Express Company; BB&T Corporation; BBVA Compass Bancshares, Inc.; BMO Financial Corp.; BNP Paribas USA; Bank of America Corporation; The Bank of New York Mellon Corporation; Barclays US LLC.; Capital One Financial Corporation; Citigroup, Inc.; Citizens Financial Group; Credit Suisse Holdings (USA); Discover Financial Services; Fifth Third Bancorp; HSBC North America Holdings, Inc.; Huntington Bancshares, Inc.; JP Morgan Chase & Co.; Keycorp; M&T Bank Corporation; MUFG Americas Holdings Corporation; Northern Trust Corp.; The PNC Financial Services Group, Inc.; RBC USA Holdco Corporation; Regions Financial Corporation; Santander Holdings USA, Inc.; SunTrust Banks, Inc.; TD Group US Holdings LLC; U.S. Bancorp; UBS Americas Holdings LLC; and Wells Fargo & Company.

U.S. firms have substantially increased their capital since the first round of stress tests led by the Federal Reserve in 2009. The common equity capital ratio–which compares high-quality capital to risk-weighted assets–of the 35 bank holding companies in the 2018 CCAR has more than doubled from 5.2 percent in the first quarter of 2009 to 12.3 percent in the fourth quarter of 2017. This reflects an increase of more than $800 billion in common equity capital to more than $1.2 trillion during the same period.

FED Passes ALL The US Bank In Their 2018 Stress Tests

The 2018 results from the Federal Reserve bank stress testing are out, and as normal they include the results for all 35 named institutions, a laudable degree of transparency compared with the Australian version!

The Fed says that all 35 Banks will be fine, even if stocks crash by 65%, the volatility index reaches 60, home prices fall 30% and commercial real estate drops 40% all at the same time.

They say that in the aggregate, the 35 firms would experience substantial losses under both the adverse and the severely adverse scenarios but could continue lending to businesses and households, due to the substantial accretion of capital since the financial crisis. So that’s alright then…

Aggregate losses at the 35 firms under the severely adverse scenario are projected to be US$578 billion and the net income before taxes is projected to be −US$139 billion.

The aggregate Common Equity Tier 1 (CET1) capital ratio would fall from an actual 12.3 percent in the fourth quarter of 2017 to its minimum of 7.9 percent over the planning horizon. Since 2009, the 35 firms have added about $800 billion in common equity capital.

Goldman Sachs ended up with a Tier 1 minimum supplementary leverage ratio (SLR) of 3.1, just exceeding the required 3.0 minimum the Fed set for its annual capital plan, the lowest among participating banks. However,  Morgan Stanley was next, at 3.3, then State Street at 3.7. The others were above 4.

Projected aggregate pre-provision net revenue (PPNR) is $492 billion, and net income before taxes is projected to be −$139 billion.

Some US outposts of European banks are most at risk in this analysis, together with some of the big investment banks.

Some observations.

First, losses from trading and counter-party losses were estimated at $133 billion, stemming from 9 institutions, including $17.3 billion from Bank of America Corporation, $16.3 billion from Citigroup, $13.3 billion from Goldman Sachs, $29.4 billion from JP Morgan $29.4 billion, Morgan Stanley $11.7 billion and $12.2 billion from Wells Fargo.

These estimate of losses are calibrated based on historical performance, but given the massive size of the derivatives market, this is just a best guess. We discussed the size and shape of the derivatives market recently in the $37 trillion dollar black hole.

Second, its hard to estimate the potential impact of contagion and freezing of the markets as happened into 2007, as each bank is modelled separately. This begs the question as to whether the system level modelling is robust enough. Especially if one major counter-party fell over during a crisis. 2007 showed the problem when trust across the markets falls, and margins widen significantly.

Third the assumptions are that things will revert to normal conditions in a few years – suggesting this is a “blip type crises.” Some of the smaller banks may have performed better in the tests than they would in the real world.

But the bottom line, according to the FED is that the banks can stand on their own two feet in the mother of all crises, so not excuse for any bail-out then… We will see.

That said, the analysis is the most comprehensive in the world. Its worth reading the detail.

The Federal Reserve has established frameworks and programs for the supervision of its largest and most complex financial institutions to achieve its supervisory objectives, incorporating the lessons learned from the 2007 to 2009 financial crisis and in the period since. As part of these supervisory frameworks and programs, the Federal Reserve assesses whether bank holding companies BHCs with $100 billion or more in total consolidated assets are sufficiently capitalized to absorb losses during stressful conditions, while meeting obligations to creditors and counterparties and continuing to be able to lend to households and businesses.

This annual assessment includes two related programs:

  • Dodd-Frank Act supervisory stress testing is a forward-looking quantitative evaluation of the impact of stressful economic and financial market conditions on firms’ capital.
  • The Comprehensive Capital Analysis and Review (CCAR) consists of a quantitative assessment for all firms, and a qualitative assessment for firms
    that are LISCC or large and complex firms.

For this year’s stress test cycle (DFAST 2018), which began January 1, 2018, the Federal Reserve conducted supervisory stress tests of 35 firms.

The adverse and severely adverse supervisory scenarios used in DFAST 2018 feature U.S. and global recessions. In particular, the severely adverse scenario is characterized by a severe global recession in which the U.S. unemployment rate rises by almost 6 percentage points to 10 percent, accompanied by a global aversion to long-term fixed-income assets. The
adverse scenario features a moderate recession in the United States, as well as weakening economic activity across all countries included in the scenario.

In conducting its supervisory stress tests, the Federal Reserve calculated its projections of each firm’s balance sheet, risk-weighted assets (RWAs), net income, and resulting regulatory capital ratios under these scenarios using data on firms’ financial conditions and risk characteristics provided by the firms and a set of models developed or selected by the Federal Reserve. For DFAST 2018, the Federal Reserve updated the calculation of projected capital to reflect changes in the tax code associated with the passage of the Tax Cuts and Jobs Act (TCJA) in December 2017. As in past years, the Federal Reserve also enhanced some of the supervisory models to incorporate new data, where available, and to improve model stability and performance. The enhanced models generally exhibit an increased sensitivity to economic conditions compared to past years’ models.

The results of the DFAST 2018 projections suggest that, in the aggregate, the 35 firms would experience substantial losses under both the adverse and the severely adverse scenarios but could continue lending to businesses and households, due to the substantial accretion of capital since the financial crisis. Over the nine quarters of the planning horizon, which for DFAST 2018 begins in the first quarter of 2018 and ends in the first quarter of 2020, aggregate losses at the 35 firms under the severely adverse scenario are projected to be $578 billion. This includes losses across loan portfolios, losses from credit impairment on securities held in the firms’ investment portfolios, trading and counterparty credit losses from a global market shock, and other losses.

Projected aggregate pre-provision net revenue (PPNR) is $492 billion, and net income before taxes is projected to be −$139 billion. In the severely adverse scenario, the aggregate Common Equity Tier 1 (CET1) capital ratio would fall from an actual 12.3 percent in the fourth quarter of 2017 to its minimum of 7.9 percent over the planning horizon. The aggregate CET1 ratio is projected to rise to 8.7 percent by the end of the planning horizon.

In the adverse scenario, aggregate projected losses, PPNR, and net income before taxes are $333 billion, $467 billion, and $125 billion, respectively. The aggregate CET1 capital ratio under the adverse scenario would fall to its minimum of 10.9 percent over the planning horizon.

Here are the scenarios.

Bail-in May Become More Complex For Mid-Sized EU Banks

Proposed amendments to the EU Bank Recovery and Resolution Directive (BRRD) regarding minimum levels of bail-inable subordinated debt may make it harder to effect a bail-in resolution on mid-sized banks that run into trouble, Fitch Ratings says.

Minimum subordinated debt requirements may only apply to global systemically important banks (G-SIBs) and “top-tier” banks with assets above EUR100 billion, according to a draft paper to be discussed at a European Council meeting on Friday.

This EUR100 billion threshold to designate a top-tier bank would be at the top of the range previously proposed, and could make it more difficult to apply bail-in to mid-sized banks under the EU’s bail-in framework. This may be because of legal challenges from bondholders that are bailed in if equally ranking creditors (eg junior depositors) are not or because of financial stability risks of bailing in equally ranking retail bondholders and junior depositors alongside institutional bondholders.

The EUR100 billion cut-off is particularly relevant to markets with less concentrated banking systems, for example Italy and Spain, and to smaller EU countries. For banks below the threshold, it could be challenging and costly to issue large amounts of subordinated debt, particularly for smaller banks with a more limited footprint in the debt capital markets. Consequently, mid-sized bank senior creditors may miss out on the protection the subordinated buffers would have provided.

How widely minimum subordination requirements should apply has been a matter of contention. Some northern EU member states want a broader scope covering at least all of the “other systemically important institutions” (O-SIIs), to minimise contagion risk. Others, mainly southern EU member states, want to limit the application to avoid forcing any but the largest banks to build subordinated debt buffers. An amendment originally proposed by Belgian delegates provides resolution authorities with the option to request subordinated minimum required eligible liabilities and own funds (MREL) for banks deemed systemic – but this is not automatic, as it is for the top-tier banks and GSIBs.

The European Council’s draft BRRD paper also proposes capping for most banks the requirement for subordinated MREL at 8% of a bank’s total liabilities and own funds. This would limit the associated costs for banks, but would leave their senior creditors less well protected in the event of outsized losses.

Friday’s discussions will also seek to agree a timescale for banks to meet the new requirements. The draft proposes G-SIBs and top-tier banks will have until January 2022. Other banks subject to the requirements will be given until 1 January 2024, but some EU member states are seeking longer timescales as some banks may struggle to build buffers, particularly if they are deposit-funded and have not issued subordinated debt previously.

UK Lifts Counter Cyclical Buffer

The Bank of England release their Financial Stability Report today, which includes the results of recent stress tests.  Though the stress tests show that UK Banks could handle the potential losses in the extreme scenarios, the FPC is raising the UK counter cyclical buffer rate from 0.5% to 1% with binding effect from 28 November 2018. In addition buffers for individual banks will be reviewed in January 2018, to take account of the probability of a disorderly Brexit, and other risk factors hitting at the same time.

They highlighted risks from higher LTI mortgage and consumer lending, and the potential impact of rising interest rates. They still have their 15% limit on higher LTI income mortgages (above 4.5 times). They are concerned about property investors in particular  – defaults are estimated at 4 times owner occupied borrowers under stressed conditions! Impairment losses are estimated at 1.5% of portfolio.

Beyond this, they discussed the impact of Brexit, and potential impact of a disorderly exit.

Finally, from a longer term strategic perspective, they identified potential pressures on the banks (relevant also we think to banks in other locations). There were three identified , first competitive pressures enabled by FinTech may cause a greater and faster disruption to banks’ business models than they currently expect; next the cost of maintaining and acquiring customers in a more competitive environment could reduce the scope for cost reductions or result in greater loss of market share and third the future costs of equity for banks could be higher than the 8% level that banks expect either because of higher economic uncertainty or greater perceived downside risks.

Here is the speech and press conference.

The FPC’s job is to ensure that UK households and businesses can rely on their financial system through thick and thin. To that end, today’s FSR and accompanying stress tests address a wide range of risks to UK financial stability. And they will catalyse action to keep the system well‐prepared for potential vulnerabilities in the short, medium and long terms.

In particular, this year’s cyclical stress test incorporates risks that could arise from global debt vulnerabilities and elevated asset prices; from the UK’s large current account deficit; and from the rapid build‐up of consumer credit. Despite the severity of the test, for the first time since the Bank  began stress testing in 2014 no bank needs to strengthen its capital position as a result.

Informed by the stress test and our risk analysis, the FPC also judges that the banking system can continue to support the real economy even in the unlikely event of a disorderly Brexit. At the same time, the FPC has identified a series of actions that public authorities and private financial institutions need to take to mitigate some major cross cutting financial risks associated with leaving the EU.

The Bank’s first exploratory scenario assesses major UK banks’ strategic responses to longer term risks to banks from an extended low growth, low interest rate environment and increasing competitive pressures enabled by new financial technologies. The results suggest that banks may need to give more thought to such strategic challenges.

The Annual Cyclical Stress Test

Today’s stress test results show that the banking system would be well placed to provide credit to households and businesses even during simultaneous deep recessions in the UK and global economies, large falls in asset prices, and a very large stressed misconduct costs. The economic scenario in the 2017 stress test is more severe than the deep recession that followed the global financial crisis. Vulnerabilities in the global economy trigger a 2.4% fall in world GDP and a 4.7% fall in UK GDP falls.

In the stress scenario, there is a sudden reduction in investor appetite for UK assets and sterling falls sharply, as vulnerabilities associated with the UK’s large current account deficit crystallise. Bank Rate rises sharply to 4.0% and unemployment more than doubles to 9.5%. UK residential and commercial real estate prices fall by 33% and 40%, respectively. In line with the Bank’s concerns over consumer credit, the stress test incorporated a severe consumer credit impairment rate of 20% over the three years across the banking system as a whole. The resulting sector‐wide loss of £30bn is £10bn higher than implied by the 2016 stress test.

The stress leads to total losses for banks of around £50 billion during the first two years ‐ losses that would have wiped out the entire equity capital base of the banking system ten years ago. Today, such losses can be fully absorbed within the capital buffers that banks must carry on top of their minimum capital requirements. This means that even after a severe stress, major UK banks would still have a Tier 1 capital base of over £275 billion or more than 10% of risk weighted assets to support lending to the real economy.

This resilience reflects the fact that major UK banks have tripled their aggregate Tier 1 capital ratio over the past decade to 16.7%.

Countercyclical Capital Buffer

Informed by the stress test results for losses on UK exposures, the FPC’s judgement that the domestic risk environment—apart from Brexit—is standard; and consistent with the FPC’s guidance in June; the FPC is raising the UK countercyclical buffer rate from 0.5% to 1% with binding effect from 28 November 2018. In addition, as previously announced, capital buffers for individual banks will be reviewed by the PRC in January. These will reflect the firm‐specific results of the stress test, including the judgement made by the FPC and PRC in September. These buffers can be drawn on as necessary during a downturn to allow banks to support the real economy.

Brexit

There are a range of possible outcomes for the future UK‐EU relationship. Consistent with its remit, the FPC is focused on scenarios that, even if the least likely to occur, could have the greatest impact on UK financial stability. These include scenarios in which there is no agreement or transition period in place at exit. The 2017 stress test scenario encompasses the many possible combinations of macroeconomic risks and associated losses to banks that could arise in this event. As a consequence, the FPC judges that, given their current levels of resilience, UK banks could continue to support the real economy even in the event of a disorderly exit from the EU.

That said, in the extreme event in which the UK faced a disorderly Brexit combined with a severe global recession and stressed misconduct costs, losses to the banking system would likely be more severe than in this year’s annual stress test. In this case where a series of highly unfortunate events happen simultaneously, capital buffers would be drawn down substantially more than in the stress test and, as a result, banks would be more likely to restrict lending to the real economy, worsening macroeconomic outcomes. The FPC will therefore reconsider the adequacy of a 1% UK countercyclical capital buffer rate during the first half of 2018, in light of the evolution of the overall risk environment. Of course, Brexit could affect the financial system more broadly. Consistent with the Bank’s statutory responsibilities, the FPC is publishing a checklist of steps that would promote financial stability in the UK in a no deal outcome.

It has four important elements:

– First, ensuring that a UK legal and regulatory framework for financial services is in place at the point of leaving the EU. The Government plans to achieve this through the EU Withdrawal Bill and related secondary legislation.
– Second, recognising that it will be difficult, ahead of March 2019, for all financial institutions to have completed all the necessary steps to avoid disruption in some financial services. Timely agreement on an implementation period would significantly reduce such risks, which could materially disrupt the provision of financial services in Europe and the UK.
– Third, preserving the continuity of existing cross‐border insurance and derivatives contracts. Domestic legislation will be required to achieve this in both cases, and for derivatives, corresponding EU legislation will also be necessary. Otherwise, six million UK insurance policy holders with £20 billion of insurance coverage, and thirty million EU policy holders with £40 billion in insurance coverage, could be left without effective cover; and around £26 trillion of derivatives contracts could be affected. HM Treasury is considering all options for mitigating these risks.
– Fourth, deciding on the authorisations of EEA banks that currently operate in the UK as branches. Conditions for authorisation, particularly for systemic firms, will depend on the degree of cooperation between regulatory authorities. As previously indicated, the PRA plans to set out its approach before the end of the year. Irrespective of the particular form of the United Kingdom’s future relationship with the EU, and consistent with its statutory responsibility, the FPC will remain committed to the implementation of robust prudential standards. This will require maintaining a level of resilience that is at least as great as that currently planned, which itself exceeds that required by international baseline standards.

Biennial Exploratory Scenario

Over the longer term, the resilience of UK banks could also be tested by gradual but significant changes to business fundamentals. For the first time, the FPC and PRC have examined the strategic responses of major UK banks to an extended low growth, low interest rate environment combined with increasing competitive pressures in retail banking from increased use of new financial technologies. FinTech is creating opportunities for consumers and businesses, and has the potential to increase the resilience and competitiveness of the UK financial system as a whole. In the process, however, it could also have profound consequences for the business models of incumbent banks. This exploratory exercise is designed to encourage banks to consider such strategic challenges. It will influence future work by banks and regulators about longer‐term issues rather than informing the FPC and PRC about the immediate capital adequacy of participants.

Major UK banks believe they could, by reducing costs, adapt to such an environment without major changes to strategy change or by taking more risk. The Bank of England has identified clear risks to these projections:
– Competitive pressures enabled by FinTech may cause a greater and faster disruption to banks’ business models than they currently expect.
– The cost of maintaining and acquiring customers in a more competitive environment could reduce the scope for cost reductions or result in greater loss of market share.
– The future costs of equity for banks could be higher than the 8% level that banks expected in this scenario either because of higher economic uncertainty or greater perceived downside risks.

Conclusion

The FPC is taking action to address the major risks to UK financial stability. Given the tripling of their capital base and marked improvement in their funding profiles over the past decade, the UK banking system is resilient to the potential risks associated with a disorderly Brexit.

In addition, the FPC has identified the key actions to mitigate the impact of the other major cross cutting issues associated with a disorderly Brexit that could create risks elsewhere in the financial sector.

And on top of its existing measures to guard against a significant build‐up of debt, the FPC has taken action to ensure banks are capitalised against pockets of risk that have been building elsewhere in the economy, such as in consumer credit.

As a consequence, the people of the United Kingdom can remain confident they can access the financial services they need to seize the opportunities ahead.

Is The Global Banking Network Really De-globalising?

An IMF working paper “The Global Banking Network in the Aftermath of the Crisis: Is There Evidence of De-globalization?” released today, shows that contrary to popular belief, the Global Banking Network has not shrunk since the GFC in the simple way often thought. Using complex and innovative modelling, they conclude that the banking world in some ways is connected more deeply, and with greater complexity than before. This means that players in one location could be impacted more severely by events in other geographies. They conclude that the hidden dynamics of the global banking network after the crisis suggest that the assertion that cross-border lending has shrunk globally seems to miss out significant details. They refrain from assessing the risk impact of this observation.

However, we conclude, like our digital world, global banking is more financially networked than ever, suggesting that risks could be propagated widely and in unexpected directions.

The global financial crisis in 2008-09 underscores the unique role of financial interconnectedness in transmitting and propagating adverse shocks. Previous literature stresses the significance of network structure in generating contagion,  lays out detailed mechanisms of contagion through balance-sheet effects, is followed by a large body of theoretical and empirical research on interbank markets, mostly within a single country or region, that focuses on modeling banks’ behavior in response to shocks in the financial system. Cross-border implications of the banking network, however, are mostly ignored due to scarcity of data and rich country-level heterogeneity that may lower the explanatory power of a unified framework.

The sharp fall in global cross-border banking claims after the crisis has been persistent, either measured in Bank for International Settlements (BIS) Locational Banking Statistics (LBS) or BIS Consolidated Banking Statistics (CBS). This persistent aggregate decline in cross-border banking claims has been considered evidence of financial deglobalization. In this paper, we consider the validity of the financial de-globalization argument by studying the evolution of the global banking network before, during and after the crisis, with a particular focus on the aftermath of the crisis. Instead of trying to establish the role of the network in propagating the crisis at a global level, we take the role of the global banking network as given and seek to investigate the impact of the crisis on the network. In this context, our key contributions to the literature are twofold: (i) we measure and map the global banking network using a model-free and data driven approach; and (ii) we analyze the evolution of the network using network analysis tools, including some novel applications, that are relevant given the  characteristics of the global banking network and the available data.

The foremost challenge in constructing the global banking network is to map and identify an accurate and comprehensive network structure using the available data on cross-border banking flows. Researchers face a tradeoff between data coverage and frequency. High frequency data, such as banks’ daily transactions, often contain a limited number of banks within a country, while datasets with a good coverage of global lending mainly report country-level aggregate statistics, and are updated infrequently. This challenge is further complicated by the difficulty in identifying the composition, sources and destinations of bank flows, primarily due to the use of offshore financial centers as important financial intermediaries. Not only are global banks able to conduct cross-border lending via entities in their headquarters and offshore financial centers, but also they can lend domestically through subsidiaries and/or branches within the border of the borrower countries. BIS International Banking Statistics (IBS), through its two datasets (LBS and CBS), offer the best available data to map the international bank lending activity across countries. This is especially the case of the CBS dataset, which consolidates gross claims of each international banking group on borrowers in a particular country, aggregating those claims following the nationality of the parent banks. This nationality-based nature of CBS is an advantage over LBS, which follows a residency-based principle, and thus obscures the linkages between the borrower country and the parent bank institution, when lending originates in affiliates located in third countries (e.g., off-shores financial centers). A disadvantage of using CBS is that it registers the full claims of the affiliates, independent of how those assets were funded (e.g., a claim of a foreign affiliate that is fully funded with local domestic depositors is still counted as a claim from the country of the parent bank on the borrower country where the affiliate is located). In order to avoid this overstatement of financial linkages, which are large in the case of emerging countries as shown in the next section, we combine BIS CBS data with bank level data, taking into account the claims of foreign affiliates and the local deposit funding used by subsidiaries and branches.

We use the improved measure of cross-border banking linkages to  onstruct a sequence of global banking networks, and apply tools from network theory to analyze the evolution of economic and structural properties of the network. We take a step further to incorporate this important discussion into our choice of metrics to identify important players and trace the structural evolution of the global banking network. We provide an in-depth discussion of network measure choice based on the structural context of a core-periphery, asymmetric and unbalanced network structure and in the economic context of characterizing banking flows at the country level.

We introduce measures of node importance that capture  distinct aspects of global banking linkages. In particular, we use recursively defined Katz-Bonacich centrality and authority/hub measure to characterize country importance based on its connection to and dependence on other important countries, as well as a novel application of modularity in order to capture the regional fragmentation of the network. The flexibility of our network configuration allows us to use a small number of network metrics to reveal distinct aspects of network structure and node importance.

We find that the overall shrinkage of cross-border bank lending after the crisis, which has been the key argument behind the claims on financial de-globalization, is also reflected in the average number of links and their strength in the global banking network.

However, rich details on the evolution of the network suggest that this argument is overly simplified.

While connections within traditional major global lenders (banks in France, Germany, Japan, UK, and US) became sparser, many non-reporting countries located at the periphery of the network are more connected, mainly due to the rise of non-major global lenders out of Europe. Measured in metrics of node importance, these lenders have been steadily climbing up the rank, resulting in a corresponding decline of European lenders in status and borrowers’ decreasing dependence on traditional lending countries. Moreover, we find substantial evidence indicating increasing level of regionalization of the global banking network. Even though post-crisis retrenchment of major global and non-major European banks’ operation in the aggregate was just partially offset by the rest of the BIS reporting countries’ regional expansion, their targeted expansions have increased regional interlinkages through both direct cross-border and affiliates’ lending. More formally, using network modularity as a novel application to assess the quality of network cluster structure based on region divisions, we find that this measure increases after the crisis, thus indicating, from the perspective of network theory, that some form of regionalization characterizes the post-crisis dynamics of the global banking network. Finally, we also confirm this regionalization process through a regression analysis of the evolution of cross-border lending. After controlling by geographical distance and trade relationships as well as lender and borrower characteristics, we find a statistically significant increase in cross-border lending when both borrower and lender belong to the same region, especially in the case of peripheral lenders during the post-crisis period.

We show that without proper adjustment, country-level banking statistics suffer from multiple data issues that distort the actual role of each country in cross-border lending, and increase the difficulty of accurately detecting key players in the network. We find evidence confirming the overall shrinkage in the scale of cross-border bank lending using a variety of network analysis tools. Moreover, these methods capture rich dynamics that occur inside the global banking network and are not captured by traditional aggregate indicators.

Using a set of centrality measures with meaningful economic interpretations, we delve substantially deeper to capture the interconnectedness faced by each country. While the structural stability of the highly concentrated global banking network is mainly due to the stability of major global lenders, we observe decline in importance for non-major global European lenders and a corresponding rise in the ranks for lenders from other region, comprised of mostly emerging market lenders. The hidden dynamics of the global banking network after the crisis suggest that the assertion that cross-border lending has shrunk globally seems to miss out significant details.

NOTE: IMF Working Papers describe research in progress by the authors and are published to elicit comments and to encourage debate. The views expressed in IMF Working Papers are those of the authors and do not necessarily represent the views of the IMF, its Executive Board, or IMF management.

APRA hires head of risk and data analytics

From Investor Daily.

APRA has appointed Westpac’s head of risk analytics to take up a new executive general manager role at the prudential regulator.

APRA has appointed two new executive general managers (EGMs) to its senior executive team, completing the regulator’s transition to a new organisational restructure that was announced in May 2017.

Westpac head of risk analytics and insights Sean Carmody will join APRA in the newly created role of EGM, risk and data analytics.

Separately, in an internal promotion, current APRA chief risk officer Ben Gully has been appointed EGM, specialised institutions division.

APRA chairman Wayne Byres said the appointments will “refresh” the regulator’s senior leadership team.

“Together with the appointments in May of four new senior executives, we have completed our organisational restructure designed to ensure APRA continues to respond to changes in the financial sector and deliver on APRA’s mission to protect the financial well-being of the Australian community,” Mr Byres said.

These suburbs could be underwater in just decades

From The New Daily.

Some of Australia’s most densely populated suburbs, major cities and crucial pieces of infrastructure, such as Sydney airport, could be underwater in just decades, according to an alarming new prediction.

A newly developed map of Australia, based on data from National Oceanic and Atmospheric Association (NOAA) in the US, shows places like Port Melbourne, Sydney’s Double Bay, the Gold Coast, Cairns and Byron Bay, are at risk of becoming uninhabitable in a matter of decades.

Sydney, Brisbane and Hobart airports are also in danger of being swamped, according to the predictions.

In a new report, NOAA projected the global sea level to rise a maximum of two metres by the year 2100, if greenhouse gas emissions continue at “business as usual” levels.

Melbourne’s southern and western suburbs and CBD will be worst affected. Photo: Coastalrisk.com.au

Map creator Nathan Eaton said the fresh information revealed that the estimated worst case scenario, predicted in a 2013 report, is now the most likely outcome.

In that report, the maximum rise was predicted at 74 centimetres.

“We want to give people a chance to prepare and having this information available is the first step to becoming aware of what challenges their community might have to face,” Mr Eaton said.

The map, made available on the website Coastal Risk Australia, shows the estimates from 2013 layered against the new information at a high tide scenario.

The year 2100 might seem too distant to worry about; but Mr Eaton said he wanted to showcase a year that would see a heavy blow.

“The current generation that’s being born will have to deal with this, so it’s actually not that far away if you think about it,” he said.

The prediction for the Gold Coast is dire. Photo: Coastalrisk.com.au

Action is already being taken.

The Gold Coast, for instance, has already begun building a seawall to strengthen the city’s defences against erosive wave action and wild weather.

Australian Coastal Councils Association executive director Alan Stokes said the map reinforced that all levels of government needed to start taking sea level risks seriously.

“Anybody in their right mind would have to be worried about what impact that sort of inundation is likely to have,” Mr Stokes said, adding that he is frustrated that the Federal government neglected to address emissions levels in the latest budget.

Around 85 per cent of Australia’s population live near the coast.

Mr Stokes said those looking to buy in these areas, should proceed with “open eyes” and to take all factors into account.

“It’d be difficult to ignore the potential risk for people buying into these coastal suburbs. You really need to do your research, have a look at the maps and know what the risk is,” he said.

If unmitigated greenhouse gas emissions continue, a two-metre rise in sea levels is not a matter of if, but when, according to University of New South Wales Climate Change Research Centre’s Professor, John Church.

A major reduction in the world’s carbon emissions would “substantially reduce what level we’re likely to get to”, he said.

Newcastle and the NSW Central Coast will be inundated. Photo: Coastalrisk.com.au

‘Map doesn’t go far enough’

The map, however, does not take into account local conditions.

Australian National University ocean and climate change expert, Professor Eelco Rohling, said while the map was a useful tool to communicate the threat of climate change, it is too simplified to be used effectively by city planners.

“The general public wants to be shown, but not told, the details,” Professor Rohling said.

“The danger is that you’re under-informing people. I find that a bit of a shame.”

He adds that two main factors influencing the rate of sea level rise should have been taken into account when putting the map together: glacial isostatic adjustment (when the Earth’s crust bounces back from the weight of a glacier after it has melted) and the different scenarios of melting in Greenland and Antarctica.

Professor Rohling said these two factors could change the local sea level rise by tens of centimetres.

Property crash fears downgrade Australian banks

From The New Daily.

Fears of a property market crash have prompted S&P to downgrade the creditworthiness of almost all of Australia’s finance sector.

The global ratings agency issued a statement on Monday explaining its decision was founded on the “economic imbalances” caused by soaring private-sector debt and property prices.

“Consequently, we believe financial institutions operating in Australia now face an increased risk of a sharp correction in property prices and, if that were to occur, a significant rise in credit losses,” the agency wrote.

“With residential home loans securing about two-thirds of banks’ lending assets, the impact of such a scenario on financial institutions would be amplified by the Australian economy’s external weaknesses, in particular its persistent current account deficits and high level of external debt.”

The rating downgrades applied to 23 financial institutions, including AMP, Bank of Queensland, and the Bendigo and Adelaide Bank.

The notable exceptions were the ‘Big Four’ (AA-) and Macquarie (AA), which kept their ratings, but only because the agency presumed they would be bailed out by the government in the event of any catastrophe.

The downgrades follow a March report by OECD warning that soaring house prices and ever-rising household debt had exposed the Australian economy to “extreme vulnerability”.

The Paris-based organisation — the research arm of the world’s richest nations — said the Australian property market was showing “hints of a slowdown” that could trigger “a rout on prices and demand” that spreads to all other parts of the economy, cutting consumer spending and pushing up mortgage defaults.

House prices have increased in real terms by 250 per cent from the 1990s, the OECD said, with most of that increase occurring over the past few years, particularly hitting first-time buyers in Sydney.

At the same time, the nation’s ratio of household debt to GDP has hit a record high at 123 per cent, the third highest in the world, the OECD report found.

Meanwhile, in S&P’s downgrade, AMP Bank was cut from A+ to A, while Bank of Queensland and Bendigo and Adelaide Bank both went from A- to BBB+. All three went from a negative to stable outlook, meaning the agency does not foresee further cuts in the immediate future.

Credit ratings measure how likely an institution is to be able to repay its bond holders on time and in full. Ratings between AAA and BBB are investment grade, while BB to D are speculative grade.

An institution rated A- is considered to have a “strong capacity” to repay, but is “somewhat susceptible to adverse economic conditions and changes in circumstances”. BBB equates to an “adequate” capacity to repay.

The other affected institutions were:

  • Australian Central Credit Union
  • Auswide Bank
  • Community CPS Australia
  • Credit Union Australia
  • Defence Bank
  • Fisher & Paykel Finance
  • G&C Mutual Bank
  • Greater Bank
  • IMB
  • Liberty Financial
  • mecu
  • Members Equity (ME) Bank
  • MyState Bank
  • Newcastle Permanent
  • Police Bank
  • Qudos Mutual
  • QPCU
  • Rural Bank
  • Teachers Mutual

S&P joined the other two major ratings agencies last week in maintaining the Australian government’s AAA rating, but with a negative outlook.