Building Approvals Fall Again

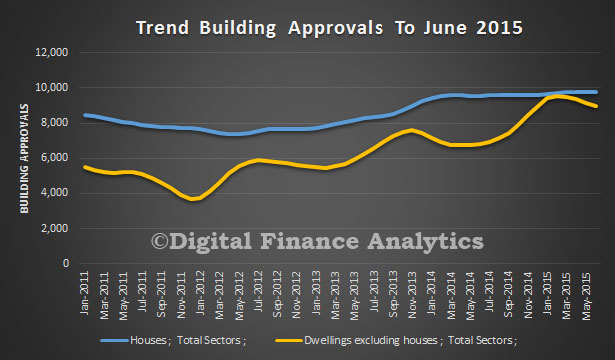
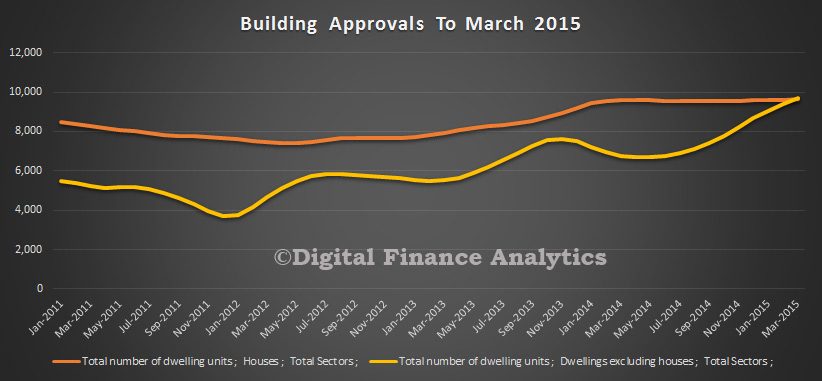
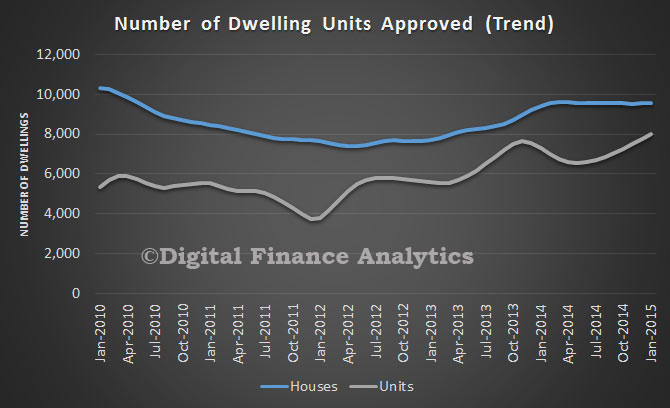
Australian Bureau of Statistics (ABS) Building Approvals data shows that the number of dwellings approved fell 0.7 per cent in August 2015, in trend terms, and has fallen for five months.

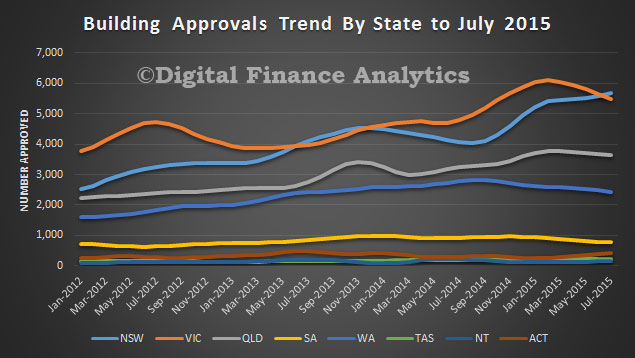
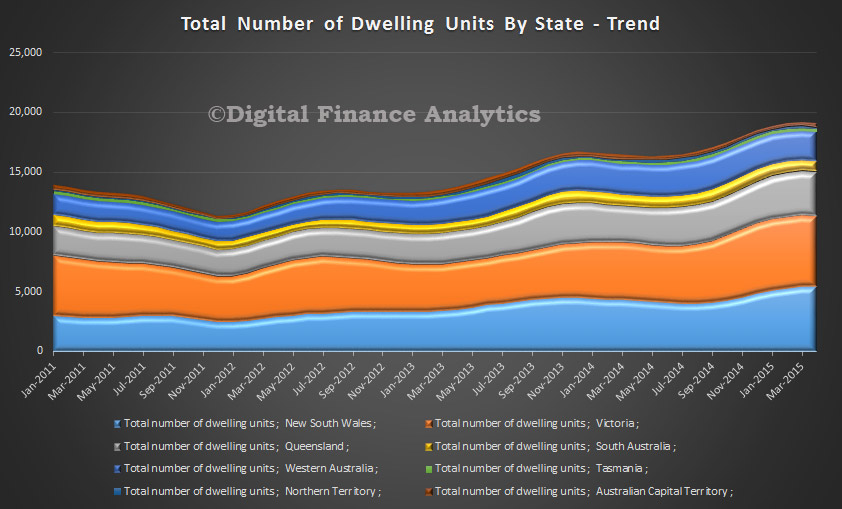
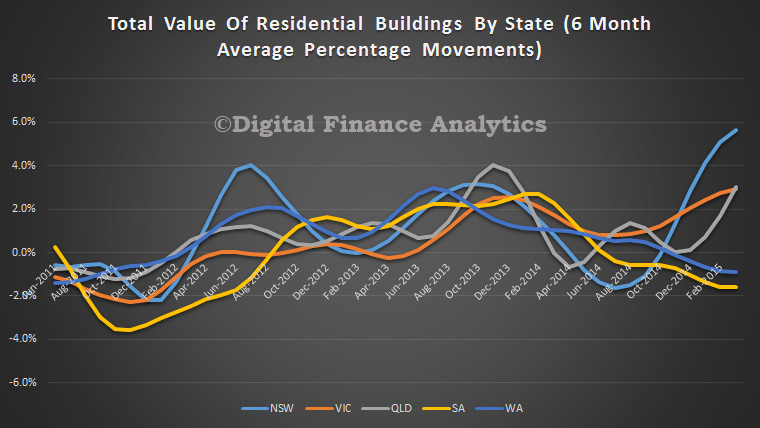
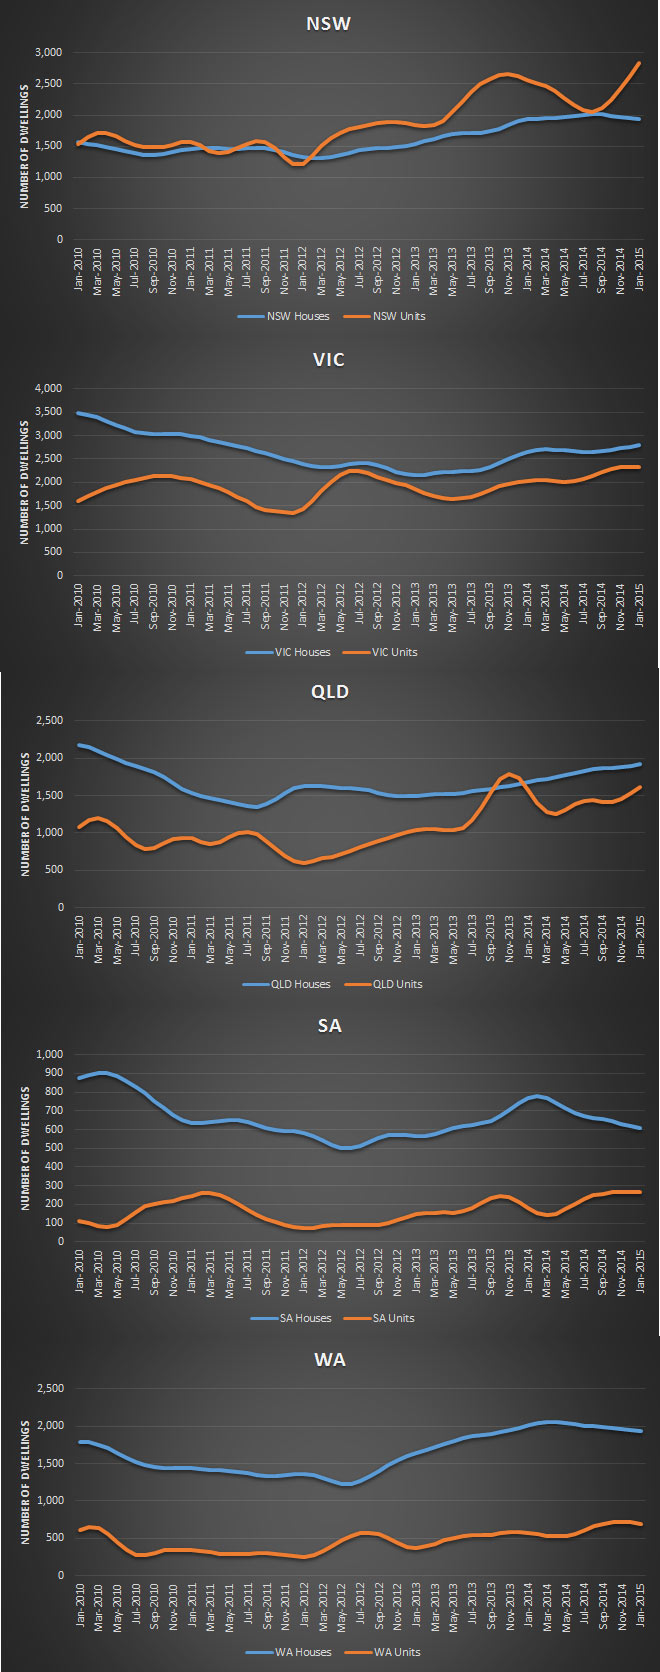
Dwelling approvals decreased in August in Tasmania (6.8 per cent), Victoria (4.2 per cent), Western Australia (1.8 per cent), Northern Territory (0.6 per cent) and Queensland (0.2 per cent) but increased in the Australian Capital Territory (8.1 per cent), South Australia (4.5 per cent) and New South Wales (1.4 per cent) in trend terms.

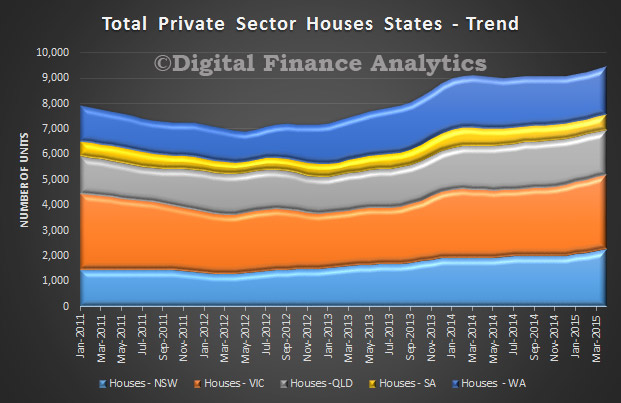
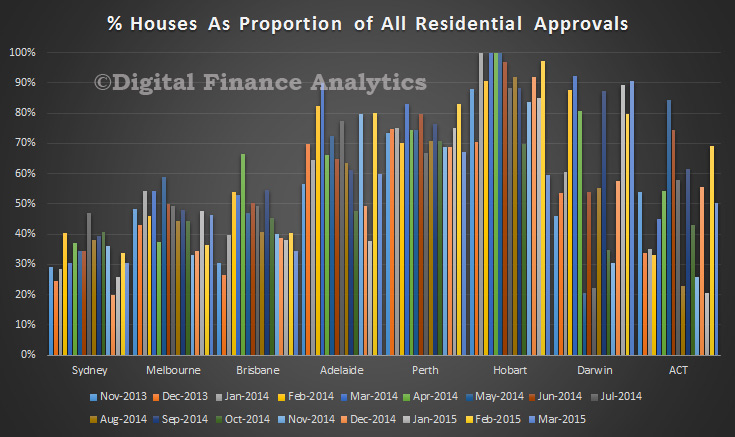
In trend terms, approvals for private sector houses fell 0.1 per cent in August. Private sector house approvals rose in Queensland (2.0 per cent), New South Wales (0.4 per cent) and South Australia (0.2 per cent) but fell in Western Australia (2.8 per cent). Private house approvals were flat in Victoria, in trend terms.

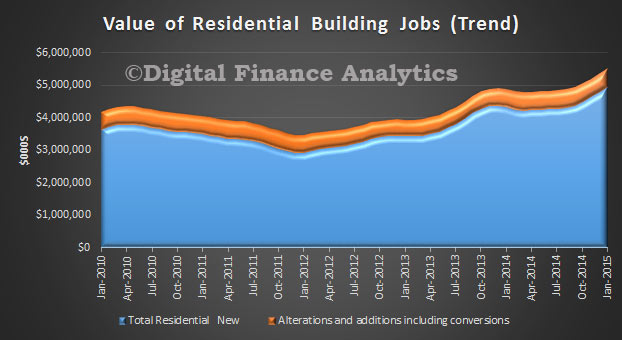
The value of total building approved rose 0.8 per cent in August, in trend terms, and has risen for four months. The value of residential building rose 0.2 per cent while non-residential building rose 2.1 per cent in trend terms.

Building Approvals Fell 0.7% In July

The Australian Bureau of Statistics (ABS) Building Approvals show that the number of dwellings approved fell 0.7 per cent in July 2015, in trend terms, and has fallen for five months.

Dwelling approvals decreased in July in Tasmania (5.6 per cent), Victoria (3.1 per cent), South Australia (2.1 per cent), Western Australia (1.8 per cent) and Queensland (0.8 per cent) but increased in the Northern Territory (7.3 per cent), Australian Capital Territory (4.4 per cent) and New South Wales (1.9 per cent) in trend terms.

BuildingApprovalsJuly2015BySTate
In trend terms, approvals for private sector houses fell 0.5 per cent in July. Private sector house approvals fell in Western Australia (2.3 per cent), Victoria (1.5 per cent) and South Australia (1.4 per cent) but rose in Queensland (1.2 per cent) and New South Wales (0.8 per cent).

The value of total building approved rose 0.6 per cent in July, in trend terms, and has risen for three months. The value of residential building fell 0.4 per cent while non-residential building rose 2.9 per cent in trend terms.

Building Approvals Fell 1.2% In June

Australian Bureau of Statistics (ABS) building approvals show that the number of dwellings approved fell 1.2 per cent in June 2015, in trend terms, and has fallen for four months. The fall in unit approvals was the reason, confirming a continued slow down.

Building-Approvals-June-2015There were some significant state variations.

Dwelling approvals decreased in June in South Australia (4.1 per cent), New South Wales (2.9 per cent), Victoria (1.8 per cent) and Western Australia (0.4 per cent) but increased in the Australian Capital Territory (14.6 per cent), Northern Territory (8.7 per cent), Queensland (0.2 per cent) and Tasmania (0.1 per cent) in trend terms.

In trend terms, approvals for private sector houses were flat in June. Private sector house approvals rose in New South Wales (2.0 per cent), Queensland (0.3 per cent) and South Australia (0.2 per cent) but fell in Victoria (1.3 per cent) and Western Australia (1.0 per cent).

The value of total building approved fell 0.9 per cent in June, in trend terms, and has fallen for four months. The value of residential building fell 1.0 per cent while non-residential building fell 0.6 per cent in trend terms.

Building Approval Trends Flat

The ABS released their data on Building Approvals for May 2015. Using our preferred data view, trend, which irons out some of the variables, the estimate for total dwellings approved fell 0.1% in May after rising for 11 months. The trend estimate for private sector houses approved rose 0.1% in May and has risen for six months. The trend estimate for private sector dwellings excluding houses was flat in May after rising for 11 months. The trend estimate of the value of total building approved fell 0.9% in May and has fallen for three months. The value of residential building rose 0.1% and has risen for 11 months. The value of non-residential building fell 3.4% and has fallen for five months.

Overall levels of approvals are still running higher than anytime this century, thanks to the growth in units, which we this are correlated to the high demand for investment property. High density development is more profitable for builders, and we know demand remains strong in the current low interest rate environment from local and international purchasers. The fall in the AU dollar makes foreign investment even more attractive. However, high volume builds, constructed for profit, will tend to degrade quite quickly, and compliance to building regulations will not necessarily be sufficient to ensure quality long term homes.

Building-Approvals---May-2015Comparing the seasonally adjusted estimate for total dwellings approved rose 2.4% in May following a fall of 5.2% in the previous month. The seasonally adjusted estimate for private sector houses fell 8.4% in May after rising for two months. The seasonally adjusted estimate for private sector dwellings excluding houses rose 16.6% in May following a fall of 16.9% in the previous month. The seasonally adjusted estimate of the value of total building approved rose 2.1% in May following a fall of 3.1% in the previous month. The value of residential building rose 3.3% following a fall of 3.7% in the previous month. The value of non-residential building fell 1.1% and has fallen for two months.

These seasonally adjusted series are too volatile to draw any conclusions, in DFA’s view, though others will I am sure prefer to focus here!


Strong Dwelling Approvals in May – ABS

According to the latest ABS data, released today, during May 2015, total new dwelling approvals rose by 2.4 per cent to 19,414 in seasonally-adjusted terms, compared with 18,964 in April. An uplift in multi-unit approvals saw a 15.1 per cent rise during May although detached house approvals fell by 8.5 per cent. A total of 218,442 approvals were recorded in the year to May, which is a new record for approvals over any twelve-month period since records began in 1983.

There were significant state variations with seasonally-adjusted new dwelling approvals strongest increase in Victoria (+11.0 per cent), followed by New South Wales (+8.8 per cent) and Queensland (+3.6 per cent). A slight increase was also recorded in Western Australia (+0.2 per cent). New dwelling approvals fell significantly in Tasmania (-32.6 per cent) and in South Australia (-9.9 per cent).

Building Approvals Down In April – ABS

Australian Bureau of Statistics (ABS) Building Approvals show that the number of dwellings approved fell 0.4 per cent in April 2015, in trend terms, after rising for ten months. Whilst the number of houses approved rose, we still see a hike in the volume of high-rise developments.

Dwelling approvals decreased in April in the Northern Territory (6.2 per cent), South Australia (2.3 per cent), Victoria (0.8 per cent), Queensland (0.8 per cent) and Western Australia (0.6 per cent) but increased in the Australian Capital Territory (8.4 per cent), Tasmania (4.3 per cent) and New South Wales (0.1 per cent) in trend terms.

ApprovalsApril2015States In trend terms, approvals for private sector houses rose 1.1 per cent in April. Private sector house approvals rose in New South Wales (2.8 per cent), South Australia (2.0 per cent), Victoria (0.8 per cent) and Western Australia (0.8 per cent) but fell in Queensland (0.5 per cent). This was the largest rise since 2010.

ApprovalsApril2015HousesHowever, we continue to see a steady rise in the relative proportion of high-rise dwelling approvals.

ApprovalsApril2015TypePC The value of total building approved fell 1.0 per cent in April, in trend terms, and has fallen for two months. The value of residential building fell 0.1 per cent while non-residential building fell 3.3 per cent in trend terms.

March Building Approvals Up By 1.8%

The ABS released the Building Approvals data to March 2015. In trend terms, the number of approvals was 19,333, up 1.8% on last month, and 18.2% from last year. The count has risen for 10 months. The trend estimate for private sector houses approved rose 0.2% in March and has risen for four months. The trend estimate for private sector dwellings excluding houses rose 3.6% in March and has risen for 10 months.

The value of residential building rose 2.5% and has risen for 12 months. The value of non-residential building fell 2.8% and has fallen for four months.  As the resource sector packs up its building tools, some are being applied to the residential sector.

However, it is the state by state date which really highlights the true “state” of play. In NSW, we see a strong pickup in unit approvals, driven by investment property demand and high residential prices.

NSW-Building-Approvals-March-2015Compare this with WA, where, as the resource boom slides into the dust, approvals are down for both units and houses, though we see the mix is strongly aligned towards houses rather than units.

WABuildingApprovalsMarch2015In SA, approvals are falling, and only a small number of approvals are for units.

SABuildingApprovalsMarch2015In QLD, we see momentum in units, whilst approvals for houses has fallen a little.

QLDBuildingApprovalsMarch2015Finally, in VIC. momentum is positive, and both houses and apartments are up, with slightly more than half being for units.

VIC-Building-Approvals-March-2015


Building Approvals Up Again, Especially Units In NSW

Australian Bureau of Statistics (ABS) Building Approvals show that the number of dwellings approved rose 1.8 per cent in March 2015, in trend terms, and has risen for ten months. This continued strength was driven by increases in new flats, units or apartments in residential buildings.

The value of total building approved rose 0.9 per cent in March, in trend terms, and has risen for nine months. The value of residential building rose 2.5 per cent while non-residential building fell 2.8 per cent in trend terms.

Building-Approvals-March-2015
The number of dwelling approvals increased in March in New South Wales (4.4 per cent), Tasmania (3.3 per cent), Queensland (3.0 per cent) and Victoria (1.2 per cent) but decreased in Northern Territory (14.6 per cent), Australian Capital Territory (3.8 per cent), Western Australia (1.9 per cent) and South Australia (1.7 per cent) in trend terms.

There are significant state variations with regards to the proportion of approvals relating to houses, lowest in the Sydney region.

Houses-By-state-Mar-2015In trend terms, approvals for private sector houses rose 0.2 per cent in March. Private sector houses rose in New South Wales (1.8 per cent) and Victoria (1.1 per cent) but fell in South Australia (1.3 per cent), Western Australia (1.3 per cent) and Queensland (0.9 per cent).

The trend value of residential building rose 2.5% and has risen for 12 months. The value of non-residential building fell 2.8% and has fallen for four months.  The 6 month average value moments highlights the state variations, with NSW hot, and WA coming off.

Building-Value-By-State-March-2015

Building Approvals Up In February, Thanks To NSW

Australian Bureau of Statistics (ABS) Building Approvals show that the number of dwellings approved rose 1.6 per cent in February 2015, in trend terms, and has risen for nine months.

Dwelling approvals increased in February in New South Wales (5.4 per cent), Queensland (2.1 per cent) and Victoria (1.3 per cent) but decreased in Australian Capital Territory (16.2 per cent), Northern Territory (2.7 per cent), Western Australia (2.5 per cent), South Australia (2.4 per cent) and Tasmania (0.7 per cent) in trend terms.

In trend terms, approvals for private sector houses was flat in February. Private sector houses rose in New South Wales (1.8 per cent) and Victoria (0.7 per cent) but fell in South Australia (1.5 per cent), Western Australia (1.4 per cent) and Queensland (0.9 per cent).

The value of total building approved rose 1.0 per cent in February, in trend terms, and has risen for eight months. The value of residential building rose 2.1 per cent while non-residential building fell 1.4 per cent in trend terms.

Building Approvals Continue To Favour Units

The ABS released their building approvals data today for January 2015. We see continued strong growth in unit approvals, though this does vary by state. The trend estimate for total dwellings approved rose 1.3% in January and has risen for eight months.  The trend estimate for private sector houses approved was flat in January, whilst the trend estimate for private sector dwellings excluding houses rose 2.6% and has risen for eight months.

BuildingApprovalsJan2015The value of residential building rose 2.9% and has risen for 10 months.

ValueofBuildingWorksJan2015The state trends show variation, with a peak in units in NSW and some momentum in QLD. On house approvals, NSW, SA and WA all fell, offset by a rise in VIC and QLD.

StateBuildsJan2015