Bank Risk-taking Behaviour Rises As Monetary Policy Eases

A newly released IMF working paper ” Does Prolonged Monetary Policy Easing Increase Financial Vulnerability?” looks at how banks behave in an easing monetary policy environment. They found that the leverage ratio, as well as other measures of firm-level vulnerability, increases for banks and nonbanks as domestic monetary policy easing persists. Cross-border effects are also notable. Results are non-linear, with risk-taking behavior rising most quickly at the onset of monetary policy easing.

We think think this means that in a low interest rate environment, counter-cyclical buffers should be increased.  In Australia, in the current low rate environment, policy settings are still too generous.

While decisive and persistent monetary policy accommodation was necessary to support aggregate demand in advanced economies during and after the financial crisis, there is lingering concern about the side effects of low interest rates and central bank balance sheet expansion on risk-taking behavior in the financial sector. In this paper, we investigate the extent to which financial vulnerabilities build up at the firm level during extended periods of monetary policy easing at home and in the U.S.

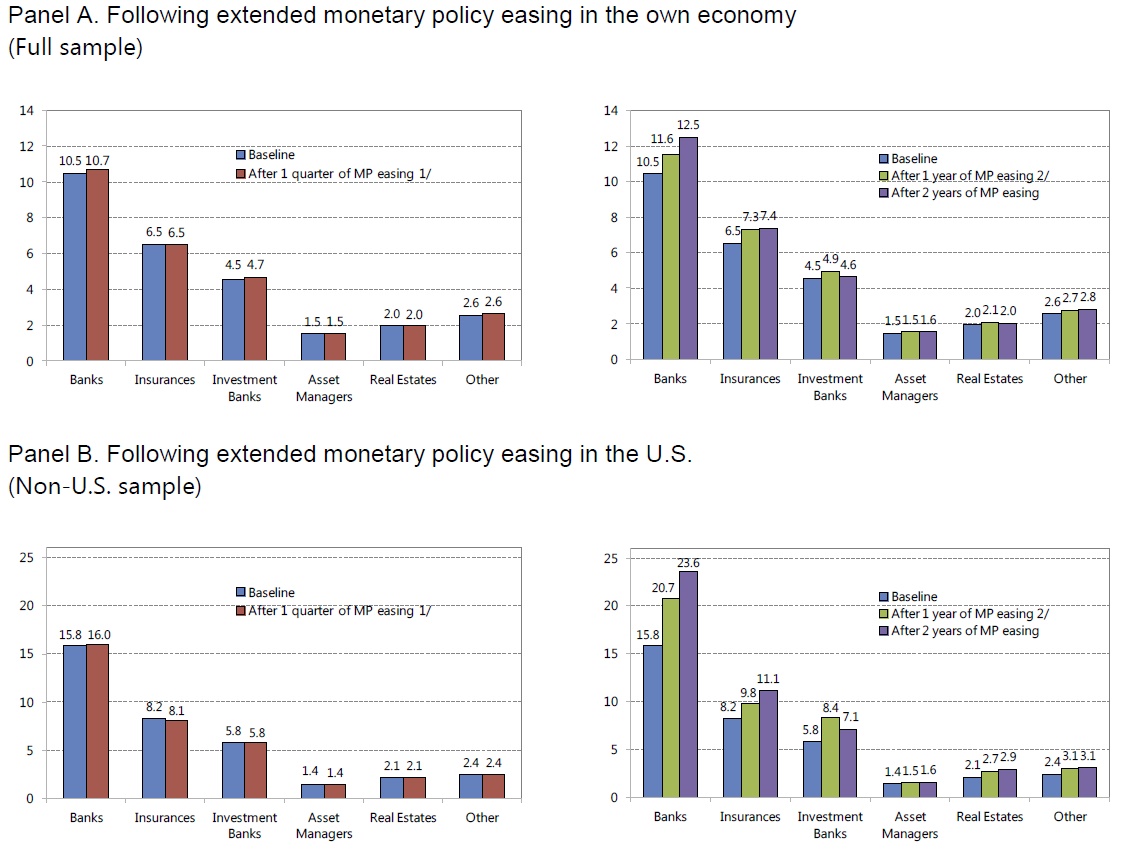
Based on a data for roughly 1,000 bank and nonbank financial institutions—including insurance companies, investment banks and asset managers—in 22 countries over the past 15 years, we find significant evidence of increased risk-taking behavior. Domestic banks and nonbanks alike increase their leverage ratios in response to persistent monetary policy accommodation at home. In addition, prolonged Federal Reserve policy easing leads banks and nonbanks outside the U.S. to take on more risks, with an effect similar to equivalent domestic monetary policies.
These results are robust to alternative measures of financial vulnerability, controls, and specifications. Importantly, the relationship between persistent monetary policy easing and financial firm vulnerability appears to be non-linear, with risk-taking behavior rising most quickly at the onset of policy easing.

Our findings ideally will spur research in two directions. First, further work is needed to develop benchmarks for risk-taking behavior. While we document an increase in risks taken by financial institutions, we are unable to take a position on whether such increases in risk are worrisome or excessive. Some degree of change in risk-taking is an inherent part of the monetary policy transmission mechanisms. To some extent, if prudential policies and regulations inhibit financial institutions from taking more risk in response to monetary policy easing, the expansionary effect of monetary policy on the real economy may be diminished.

Second, our results should inform the ongoing debate on using monetary policy tightening for financial stability purposes (see IMF, 2015, for instance). Costs of doing so would arise from lower employment and output in the short to medium run, feeding back to higher defaults and funding costs, thus reducing financial stability. But benefits need further exploration. The emphasis so far has been on the link between policy rates and credit growth, and in turn between credit growth and financial stability (Svensson, 2015). However, this paper suggests that the link could also go through the leverage of financial sector firms.

But even without further work, our results have several policy implications. Countries should closely monitor financial sector risks during periods of monetary policy accommodation at home, and in the U.S. They should develop solid prudential and regulatory frameworks, so as to preserve room for monetary policy to manoeuver to achieve its inflation and output objectives. Such frameworks should apply to both banks and nonbanks.

Note: IMF Working Papers describe research in progress by the author(s) and are published to elicit comments and to encourage debate. The views expressed in IMF Working Papers are those of the author(s) and do not necessarily represent the views of the IMF, its Executive Board, or IMF management.

Think The Unthinkable – The Property Crash We Have To Have?

In past years we have been highlighting the misaligned policy settings which have allowed home prices to balloon, household debt to soar, interest rates to slide and investors to gain more than a third of the market, higher than UK or USA. As banks have continued to lend and inflate their balance sheets and bolster their profitability, despite some tightening of standards; households are massively exposed.

The high debt means households have less disposable income and banks choosing to lend for housing rather than for productive business investment; both growth killing. The current capital rules have also encouraged more home lending and despite some recent tweaks, are still very generous.

Here is a tracker of home price growth, working back from today’s prices. The problem is not just the Sydney and Melbourne markets.  Its just that Sydney and Melbourne came later to the party.

Wage growth is still slowing whilst debt continues to lift. This is a real problem.

Had the settings been adjusted several years ago, this was then a manageable problem, but I am not sure it is now.

If the RBA cuts the cash rate it will stimulate housing further, whilst if it lifts rates, then mortgage rates will rise (beyond the recent and continuing out of cycle uplifts) and move the ~22% of households in mortgage stress higher.  Some will default.  The international rate cycle is on the way up, not down.

If more homes come on the market they will continue to be snapped up by cashed up investors (often levering the capital in their existing property) and overseas buys, which account for perhaps 10% of transactions.

If first time buyers are offered incentives, be they stamp duty relief, money from parents, cash payments/grants or cannibalising their super, the net effect will be simply to drive prices higher, it being a zero sum game. We know there are more than 1 million households who “Want to Buy”. Plus more arriving thanks to migration.

Investors still want property, thanks to the tax breaks and years of sustained growth, despite crushed rental yields. If lending standards are tightened, and a lower speed limit put on investor lending, we will see more investors going to the smaller lenders and the non-bank sector.  Also, some who already bought will be unable to refinance as they would now fall out of revised tighter requirements – about 9% of buyers fall into this category.

Switching away from stamp duty to a property tax may make more people trade, but that will just change the demand/supply curve, and perhaps drive prices even higher (as an artificial barrier is removed).

In fact, even joined up thinking which collectively attempts to cool the market whilst encouraging first owners into the market, is unlikely to succeed. Given the current political environment, this is even more unlikely.

Beneath all this is the financialisation of property, where it is seen as an investment class, not a source of shelter. This was called out recently in a UN paper, and is a global problem.

So, it looks to me as though we need a circuit breaker to kick-in, and that circuit breaker has to be a property correction, or even a crash.

A correction would scare off many investors, drop home prices to allow new entrants to purchase, and whilst many households would see paper profits falling, it was always funny money anyway.  Banks would take a hit, but then they have the capital buffers in place, and the RBA backstop.

In parallel, we still will need tighter rules of lending – especially for investment purposes, and the removal of the tax breaks which underpin the sector.  I think we need lending growth to track wage growth.

From here if we are careful, we can perhaps manage the settings such that such an explosion in prices wont happen again in the future.

But I wonder if we NEED a property crash. We certainly seem unable to manage under the current conditions.


EU Defends Use of Banks’ Internal Capital Models

The European Central Bank (ECB) review of internal models TRIM, is a project to assess whether the internal models currently used by banks comply with regulatory requirements, and whether they are reliable and comparable. Banks sometimes use internal models to determine their Pillar 1 own funds requirements, i.e. the minimum amount of capital they must hold by law. TRIM was launched in late 2015 and is expected to be finalised in 2019. This underscores the ECB’s desire to safeguard internal model use for retail and SME portfolios from the potential imposition of a capital floor.

ECB Banking Supervision is making a large investment in TRIM in terms of its own staff as well as the cost of external resources. With regards to staff, close to 100 ECB and national supervisors will be involved.

The targeted review of internal models, or TRIM, is a project to assess whether the internal models currently used by banks comply with regulatory requirements, and whether they are reliable and comparable. Banks sometimes use internal models to determine their Pillar 1 own funds requirements, i.e. the minimum amount of capital they must hold by law.

One major objective of TRIM is to reduce inconsistencies and unwarranted variability when banks use internal models to calculate their risk-weighted assets (RWAs). This may occur because the current regulatory framework gives banks a certain freedom when modelling their risks.

TRIM also seeks to harmonise practices in relation to specific topics. As a result, the review should help to ensure that internal models are being used appropriately.

Thus, the objectives for TRIM coincide with two major goals of ECB Banking Supervision: to foster a sound and resilient banking system through proactive and tough supervision and to create a level playing field by harmonising supervisory practices across the euro area.

This signals the EU’s determination to restore market confidence in banks’ use of internal models to calculate capital requirements, Fitch Ratings says. It may indicate a desire by the ECB to safeguard internal model use for retail and SME portfolios from the potential imposition of a capital floor.

For the eurozone, whose lawmakers and regulators mostly support the use of internal models and the risk-weighting framework for banks, TRIM is important to their argument that internal models make sense for certain portfolios. The ECB hopes to iron out unwarranted variability between models and restore credibility to the use of internal models, at least for “high-default” portfolios where there is sufficient default data for good-quality modelling.

The ECB’s large investment in TRIM suggests that internal models will continue to play an important role in how eurozone banks compute their regulatory capital requirements. TRIM’s focus on retail and SME credit risk may reveal where the ECB’s focus is for discussions on international bank regulation. The EU may be prepared to lose the use of internal models for “low-default” portfolios, such as financial institutions and large corporates, where it is more of a challenge to model statistically robust estimates for unexpected losses.

TRIM seeks to reduce inconsistencies and unwarranted variability when banks use internal models to calculate their risk-weighted assets (RWAs), by harmonising bank and national supervisory practices relating to models. The ECB has issued a 150-page guide allowing banks to assess themselves against common standards and prepare for the scrutiny to come. TRIM is the biggest single investment made by the ECB in supervision since it started in November 2014. The ECB will lead more than 100 reviews in 2017, involving more than 600 people, at 68 eurozone banks, covering approved internal models for credit, market and counterparty credit risks.

TRIM will take place in 2017 and 2018 with a possible extension into the following year. The ECB will ask banks to put right any shortcomings based on the final version of the guide. We expect the ECB to take a harsher stance with tighter timelines for shortcomings due to the banks’ own practices, while allowing more time to adjust for changes from national standards applied by supervisors in the past. Banks are likely to start work this year on aligning their models with the ECB’s standards. This may lead to movements in RWAs from model changes in 2017-2018, before TRIM is completed in 2019.

Disclosure of RWA movements due to model changes would provide helpful insight to analysts, creditors and investors. These market participants will need to be convinced of the TRIM process if the ECB is to remove their scepticism of RWA calculations based on internal models, in our view.

RBNZ Announces Banking Capital Review

The New Zealand Reserve Bank has announced a review on Bank Capital.

They plan to release a high level Issues Paper in April, outlining the areas of the capital framework that the Reserve Bank intends to examine, followed by more detailed consultation papers. They will be seeking stakeholders’ views in three broad areas: what sorts of capital instruments should qualify (the numerator); how risk exposures should be measured (the denominator); and the minimum capital ratios and buffers.

The Issues Paper will request stakeholders’ initial views on the areas we intend to cover and issues that might warrant particular attention. Further consultation documents with options for changes to the framework and recommended policy positions will be targeted for the third quarter. They plan to conclude the Review by the first quarter of 2018.

The Purpose of the Review

The aim of the Capital Review is to identify the most appropriate regulatory framework for setting capital requirements for New Zealand banks. Consistent with the Reserve Bank’s legislative purposes, minimum capital requirements should promote the maintenance of a sound and efficient financial system.  In broad terms, higher levels of capital will improve the soundness of the financial system as the likelihood of bank failures is reduced and the potential impact of credit cycles is moderated.

However, the capital regime may reduce the efficiency of financial intermediation if ratios are pushed too high or standards are made overly complex. Capital is a more expensive form of funding for the banks and so higher capital ratios can potentially increase the overall cost of funding the system as well as improving its soundness.

Our aim is to agree a capital regime that ensures a very high level of confidence in the solvency of the banking system, while avoiding unnecessary economic inefficiency.

In pursuing this objective, the Capital Review will look at the three key components of the regulatory capital regime:

  • The definition of eligible capital instruments
  • The measurement of risk, in particular the risk weights attached to credit exposures
  • The minimum capital ratios and buffers

These three factors are interdependent and the links between them must be carefully considered. The calibration of the capital ratios needs to be set in the context of the risk weights applying to exposures as well as the capacity of eligible capital instruments to absorb losses. Also, the role of capital buffers versus hard minimum requirements needs to be considered.

The Capital Review will examine how well the Reserve Bank’s current framework operates and consider potential improvements. The Reserve Bank will consult the banks and the public on its findings and on any proposed changes to the capital framework.

Outcomes of the Review will be heavily influenced by the international regulatory context, the risk characteristics of the New Zealand system and the Reserve Bank’s regulatory approach.

New Zealand domestic context

The Capital Review will assess how our future capital framework might be shaped by domestic considerations. These relate to New Zealand’s risk profile, the shape of our financial system and also our regulatory approach.

New Zealand’s exports are concentrated in a small number of commodity-based sectors which can be subject to considerable price volatility. Bank exposures to commodity export industries are a key risk in the domestic system. Residential mortgage exposures are also a major source of risk given the system’s heavy exposure to housing and the capacity for house prices to become very stretched – as at present.

New Zealand is a net debtor country, having run current account deficits continuously over the past 40 years. About half of the country’s gross external debt is issued by the New Zealand banking system which then on-lends to businesses and households.  This reliance on external funding is an important vulnerability of the New Zealand system, as starkly demonstrated during the GFC. While liquidity buffers must be the first line of defence against funding market disruptions, a strongly capitalised system also helps to mitigate the risk of reduced market access.

New Zealand’s financial system is less diversified relative to peer countries. Financial intermediation is concentrated in a few large institutions and capital markets play a relatively minor role.

Rating agency risk assessments of the large New Zealand banks is heavily influenced by expectations of support from the Australian parent banks. Under the S&P regime, this factor lifts the ratings of the large New Zealand banks by an average of 4 notches from BBB+ on a standalone basis, to AA- , the rating applied to the Australian parents. While the implicit support of the parent banks is valuable for the New Zealand system, it is also a vulnerability. For example, in recent times the Australian parent banks have been on negative outlook and, separately, APRA has placed restrictions on the ability of the parent banks to give credit support to their international subsidiaries. Should implicit parental support be eroded, it is important that our banks be seen as strong on a standalone basis in order to maintain their international standing.

The Capital Review will draw on the emerging international literature on optimal capital and include an assessment of optimal capital that takes account of New Zealand-specific characteristics. The final calibration of capital requirements will also take account of the results and insights from bank stress-testing and other analytical work we are undertaking in support of the Capital Review.

Property price growth putting banks at risk: S&P

From Australian Broker

Most Australian banks are facing a one or two notch rating downgrade over the next two years as rising residential property prices put financial institutions at risk.


In a commentary on Australian banks entitled Rising Economic Risks Could Cut Ratings on Most Australian Financial Institutions by One Notch, S&P Global Ratings has examined the dangers of Australia’s hot housing market.

Rising economic imbalances are increasing the risk of a sharp correction in property prices, analysts at the global ratings agency said.

If such a scenario occurs, S&P highlighted eight financial institutions (including six banks) which would incur large credit losses and a subsequent credit rating downgrade.

S&P makes these ratings adjustments by focusing on the Risk Adjusted Capital (RAC) Framework.

“Our risk weights applicable to a bank’s loans are calibrated to the economic risk we see in the country. Consequently, as economic risks in a country rise in our opinion, we increase the risk weights, and that pushes down the capital ratios,” Sharad Jain, director at S&P Global Ratings, told Australian Broker.

“This in turn, could have an additional downward impact on bank ratings. This is because our risk adjusted capital ratios are a key driver of our capital and earnings assessment – which is an analytical factor in our assessment of a bank’s rating.”

In the event of rising economic risks facing banks in a particular country, this by itself would be enough to place pressure on bank ratings within that country, he said.

S&P expects property price growth to moderate and then remain at relatively low levels during the next 12 to 18 months.

However, analysts warned there is a one-in-three chance of a ‘downside scenario’ occurring in which property prices spiked. The resultant rise in risk would weaken the capital ratios of all banks in Australia.

For most banks, this movement would not be enough to put further pressure on their credit profiles. Thus, most financial institutions would only be downgraded by one notch.

However, S&P Global gave a warning about eight Australian financial institutions, highlighting two banks – Auswide Bank and MyState Bank – as being at greatest risk in this ‘downside scenario’.

“It is important to point out that, if our downside scenario materialises, to review our ratings on these institutions, we would make an assessment of their position and plans in relation to capital, business, and broader financial profile,” Jain said.

“A two-notch downgrade would be only one of the three likely outcomes in that scenario. The other two likely outcomes are a one-notch downgrade with stable outlook or a one-notch downgrade with a negative outlook.”

S&P Global also warned about the risks posed for AMP Bank, HSBC Bank Australia, ME Bank and P&N Bank in these circumstances although the agency admitted that parent support from these institutions is highly likely to prevent a two notch downgrade.

Proposed UK Bank Capital Changes Are Credit Negative

From Moody’s.

Last Friday, the UK’s Prudential Regulation Authority (PRA) proposed a more flexible approach to determining Pillar 2A capital requirements for banks calculating risk-weighted assets (RWAs) according to the standardised approach. The PRA’s proposal aims to use Pillar 2A to reduce some of the variation between standardised risk weights and internal models outputs for similar risks, remove future duplication between IFRS 9 provisions for expected loss and the standardised approach, create incentives for smaller lenders to move away from higher risk mortgage lending and facilitate greater competition among UK banks.

We expect that the proposed changes will reduce the capital requirements for small banks and building societies, freeing up capital for further growth. However, in an already competitive market, with many smaller firms growing faster than the market, increased competition will negatively pressure margins and reduce profitability for all banks, a credit negative.

The proposal more closely aligns the RWAs calculated with the standardised approach and the internal ratings-based approach by allowing lenders the PRA deems adequately governed and well managed to benefit from lower Pillar 2A capital requirements if their loan portfolio is considered low risk. Disincentives would be created for higher-risk lending for which standardised risk weights are often equal to or lower than the upper band of the PRA’s internal ratings-based benchmarks. The PRA’s proposal follows the Competition Market Authority’s report recommending greater competition in the UK retail banking.

The proposal also seeks to address the potential for an effective double counting of expected loss that these firms may incur with the adoption of IFRS 9 on 1 January 2018, which would not have applied to lenders using the internal ratings-based approach.

We expect that the UK banks and building societies that we rate and which use the standardised approach will largely receive reduced Pillar 2A requirements under this proposal because of their focus on residential mortgages with limited high loan-to-value (LTV) exposures. These banks’ low-LTV and residential mortgage focus, as shown in Exhibit 1, means that they are likely to benefit from capital relief without significant incentives to change lending practices. However, all of these institutions have achieved material growth in their mortgage books over the past few years, targeting increases in volume to offset increasing margin pressure. We view negatively further incentives to foster growth for these firms through a relaxation of Pillar 2A capital requirements because doing so will weaken the affected banks’ stress capital resilience. Exhibit 2 shows banks’ reported common equity Tier1 capital ratios. We note that most of the affected banks we rate are already expanding their lending faster than the market, with annual growth of around 10% (excluding Yorkshire Building Society) in 2016, compared with 4% market growth.

We expect the PRA’s proposal to contribute to already-strong competition in the UK mortgage market, adding negative pressure to net interest margins, and negatively affecting the profitability of the banks we rate.

Affected firms are also likely to benefit from a lower minimum requirement for own funds and eligible liabilities (MREL) as a result of these proposals because of a reduction in the combined Pillar 1 and Pillar 2A capital requirements, reducing the loss-absorption capacity for creditors in the event of their failure. A subset of these firms, which have total assets in excess of £15-£25 billion, are likely to see the greatest MREL relief because they are subject to the strictest form of the requirements.

Latest Basel III monitoring results

The Basel Committee has published the results of its latest Basel III monitoring exercise based on data as of 30 June 2016 in a 65 page report. Virtually all participating banks meet Basel III minimum and target CET1 capital requirements as agreed up to end-2015. The report does not reflect any standards agreed since the beginning of 2016, such as the revisions to the market risk framework.

It also highlights that the capital build processes will continue as the higher targets come into force. Higher capital costs, and this will translate into higher loan rates as banks seek to preserve shareholder returns.

The report provides summary data for a total of 210 banks, comprising 100 large internationally active banks. These “Group 1 banks” are defined as internationally active banks that have Tier 1 capital of more than €3 billion, and include all 30 banks that have been designated as global systemically important banks (G-SIBs). The Basel Committee’s sample also includes 110 “Group 2 banks” (ie banks that have Tier 1 capital of less than €3 billion or are not internationally active). It includes Australia’s “big four” banks and one other using data from APRA.

On a fully phased-in basis, data as of 30 June 2016 show that virtually all participating banks meet both the Basel III risk-based capital minimum Common Equity Tier 1 (CET1) requirement of 4.5% and the target level CET1 requirement of 7.0% (plus the surcharges on G-SIBs, as applicable).

Between 31 December 2015 and 30 June 2016, Group 1 banks continued to reduce their capital shortfalls relative to the higher Tier 1 and total capital target levels; in particular, the Tier 2 capital shortfall has decreased from €5.5 billion to €3.4 billion. As a point of reference, the sum of after-tax profits prior to distributions across the same sample of Group 1 banks for the six-month period ending 30 June 2016 was €263 billion. In addition, applying the 2022 minimum requirements for Total Loss-Absorbing Capacity (TLAC), 18 of the G-SIBs in the sample have a combined incremental TLAC shortfall of €318 billion as at the end of June 2016, compared with €416 billion at the end of 2015.

The monitoring reports also collect bank data on Basel III’s liquidity requirements. Basel III’s Liquidity Coverage Ratio (LCR) was set at 60% in 2015, increased to 70% in 2016 and will continue to rise in equal annual steps to reach 100% in 2019. The weighted average LCR for the Group 1 bank sample was 126% on 30 June 2016, slightly up from 125% six months earlier. For Group 2 banks, the weighted average LCR was 155%, up from 148% six months earlier. Of the banks in the LCR sample, 88% of the Group 1 banks and 94% of the Group 2 banks reported an LCR that met or exceeded 100%, while all Group 1 and Group 2 banks reported an LCR at or above the 70% minimum requirement that was in place for 2016.
Basel III also includes a longer-term structural liquidity standard – the Net Stable Funding Ratio (NSFR). The weighted average NSFR for the Group 1 bank sample was 114%, while for Group 2 banks the average NSFR was 115%. As of June 2016, 84% of the Group 1 banks and 86% of the Group 2 banks in the NSFR sample reported a ratio that met or exceeded 100%, while 98% of the Group 1 banks and 96% of the Group 2 banks reported an NSFR at or above 90%.

The results of the monitoring exercise assume that the positions as of 30 June 2016 were subject to the fully phased-in Basel III standards as agreed up to end-2015. That is, they do not take account of the transitional arrangements set out in the Basel III framework, such as the gradual phase-in of deductions from regulatory capital. Furthermore, the report does not reflect any standards agreed since the beginning of 2016, such as the revisions to the market risk framework (analysed separately in a special feature). No assumptions were made about bank profitability or behavioural responses, such as changes in bank capital or balance sheet composition. For that reason, the results of the study may not be comparable with industry estimates.


Trump could ‘sow the seeds’ of next GFC

From InvestorDaily.

US President Donald Trump’s plans to ease banking regulation poses a risk to global financial stability, according to a UNSW professor.

University of Sydney associate professor Eliza Wu said the relaxation of the Dodd-Frank Act, introduced by former President Barack Obama to protect bank consumers after the global financial crisis of 2008, increases the sectors exposure to “risky financial products”.

“While investors may be happy about the proposed deregulation, the future prospects for global financial stability are not great as President Trump sows the seeds of the next global financial crisis,” she said.

Ms Wu said the Basel Committee on Banking Supervision’s decision to delay the finalisation of the new Basel 3 rules had also contributed to “uncertainty regarding banking regulatory reforms” currently facing the global banking sector.

“This is increasingly putting pressure on national prudential regulators to maintain and impose their own regulatory standards – this is worrying as a level playing field for banks operating around the world is critical for achieving global financial stability,” she said.

“When the playing field is not level, banks will respond by ‘rushing to the bottom’ and shift their operations to places where the regulation is less stringent.”

Under these circumstances, Australia would “inevitably lose out” as the country’s high regulatory standards would result in less competition within the domestic banking sector, Ms Wu said.

APRA On The Countercyclical Capital Buffer

APRA released a brief update to support their zero Countercylical Capital Buffer setting. As they say “the countercyclical capital buffer is designed to be used to raise banking sector capital requirements in periods where excess credit growth is judged to be associated with the build-up of systemic risk. This additional buffer can then be reduced or removed during subsequent periods of stress, to reduce the risk of the supply of credit being impacted by regulatory capital requirements”.

APRA may set a countercyclical capital buffer within a range of 0 to 2.5 per cent of risk weighted assets. On 17 December 2015, APRA announced that the countercyclical capital buffer applying to the Australian exposures of authorised deposit-taking institutions (ADIs) from 1 January 2016 would be set at zero per cent. An announcement to increase the buffer may have up to 12 months’ notice before the new buffer comes into effect; a decision to reduce the buffer will generally be effective immediately.

APRA reviews the level of the countercyclical capital buffer on a quarterly basis, based on forward looking judgements around credit growth, asset price growth, and lending conditions, as well as evidence of financial stress. APRA takes into consideration the levels of a set of core financial indicators, prudential measures in place, and a range of other supplementary metrics and information, including findings from its supervisory activities. APRA also seeks input on the level of the buffer from other agencies on the Council of Financial Regulators.

A range of core indicators are used to justify their position. Here are their main data-points.

Credit growth

Credit-to-GDP ratio (level, trend and gap)

The credit-to-GDP gap is defined as the difference between the credit-to-GDP ratio and its long-run trend. The long-run trend is calculated using a one sided Hodrick-Prescott filter, a tool used in macroeconomics to establish the trend of a variable over time. The credit-to-GDP gap for Australia is currently negative at -3.9. The Basel Committee suggests that a gap level between 2 and 10 percentage points could equate to a countercyclical capital buffer of between 0 and 2.5 percent of risk-weighted assets.

Housing credit growth

The pace of housing credit growth has slowed this year, growing at 6.4 per cent year on year as at September 2016, down from 7.5 per cent at the time the buffer was initially set. Investor housing credit growth fell from 10 per cent to 4.9 per cent over the same period, however the pace of growth has been increasing again more recently. APRA has identified strong growth in lending to property investors (portfolio growth above a threshold of 10 per cent) as an important risk indicator for APRA supervisors.

Business credit growth

Business credit growth increased marginally in the first half of 2016. However, business credit growth has fallen over recent quarters; annual growth in business credit was 4.8 per cent over the year to end September 2016, down from 6.3 per cent as at September 2015. Notwithstanding the lower overall rate of growth, commercial property lending growth (not shown) has remained strong, growing 10.5 per cent year on year as at September 2016.

Asset Prices

National housing price growth remains strong, but has slowed relative to 2015 peaks, growing nationally at around 3.5 per cent over the 12 months to September 2016. However, over a shorter horizon, prices have been reaccelerating recently with six month-ended annualised price growth of 7.2 per cent nationally as at September 2016 (albeit still a slower pace than 2015 peaks). Conversely, rental growth and household income growth have been relatively weak. Looking beyond the national averages, conditions vary significantly across individual cities and regions. In particular, housing price growth has strengthened in Sydney and Melbourne over recent months with six month-ended annualised growth rates of 11.4 per cent and 9.0 per cent respectively.

Non-residential commercial property has also been exhibiting strong price growth, though this has moderated somewhat in recent months (not shown).

Lending indicators

APRA monitors a range of data and qualitative information on lending standards. For residential mortgages, the proportion of higher-risk lending is a key metric. Over the past few years, APRA has heightened its regulatory focus on the mortgage lending practices of ADIs in order to reinforce sound lending practices. This has included, but not been limited to, the introduction of benchmarks on loan serviceability and investor lending growth, and the issuance of a prudential practice guide on sound risk management practices for residential mortgage lending.

In general, higher-risk mortgage lending has been falling recently with the share of new lending at loan-to-valuation ratios greater than 90 per cent falling from 9.5 per cent to 8.1 per cent over the year to September 2016. Other forms of higher-risk mortgage lending including high loan-to-income and interest-only lending (not shown) have also moderated from 2015 peaks, although there has been some pick-up in the share of interest-only lending recently.

In business lending, banks have showed some evidence of tightening lending standards more recently, in particular for commercial property lending, with the lowering of loan-to-valuation and loan-to-cost ratios on certain development transactions (not shown).

Lending rates had been steadily falling for both housing and business lending to historical lows. More recently however, lending rates have fallen by less than the cash rate, with banks passing on around half of the August cash rate reduction. Lending rates have also risen in recent weeks in response to higher costs in wholesale funding markets. In particular, a number of ADIs have recently announced increases to their mortgage lending rates with some ADIs specifically targeting investor and interest-only loans.

APRA’s confidential quarterly survey of credit conditions and lending standards provides qualitative information on whether conditions are tightening or loosening in the industry.

Financial Stress

Indicators of financial stress are used in informing decisions to release any countercyclical capital buffer. While a wide range of indicators could signify a deterioration in conditions, APRA has identified non-performing loans as its core indicator of financial stress.

The share of non-performing loans remains low, though it has increased moderately over 2016, to 0.93 per cent as at September 2016, largely driven by increases in regions and sectors with exposures to mining.

So, everything is looking rosy, in their view. However, the high household debt to income ratio and the fact that debt servicing is supported by ultra low interest rates is not included adequately in their assessment – seems myopic in my view, but then this continues the regulatory group-think.  In addition the use of “confidential quarterly survey data” highlights the lack of industry disclosure.

Analysis of Mortgage Risk Under Basel

The Bank of England just published a staff working paper “Specialisation in mortgage risk under Basel II“.  Lenders using the less sophisticated risk models (generally smaller banks) are found to have a higher concentration of higher-risk mortgages than those using the advanced models.

They looked at the two models which were introduced under Basel II, lenders’ internal models (IRB) and the less risk-sensitive standardised approach (SA) by using a dataset covering 7 million UK mortgages from 2005-15. The switch to Basel II gave lenders using IRB models a comparative advantage in capital requirements (compared to lenders using the SA approach), particularly at low loan-to-value (LTV) ratios, and this was reflected in prices and quantities. They concluded:

First, mortgage risk is concentrated in lenders using the SA approach, which is typically used by smaller lenders, suggesting a potential higher failure rate than among IRB banks.

Second, macroprudential tools may affect the strength of the specialisation mechanism. This should be accounted for in calibrating such tools.

Third, they validate the view from competition authorities who have identified the cost of adopting IRB as a potential barrier to entry and expansion. IRB provides a competitive advantage in low LTV ratio mortgages.

Finally, the effect, is not specific to the mortgage market and this needs  further research.

IRB risk weights increase with the LTV ratio, the main indicator for credit risk used by UK mortgage lenders. In contrast, SA risk weights are fixed at 35% for LTV ratios up to 80%, and are then 75% on incremental balances above the 80%

LTV threshold. IRB risk weights tend to be lower than SA risk weights across most LTV ratios, but the gap is larger for lower LTV ratios. In 2015, the gap between the average IRB risk weight and the SA risk weight was about 30 percentage points for LTV ratios below 50%, compared to less than 15 percentage points for LTV ratios above 80%. The scale of variation in risk weights between IRB lenders is smaller than the gap between the IRB average and SA risk weights, at least at lower LTV ratios.

IRB lenders gain a comparative advantage in capital requirements compared to SA lenders, particularly at low loan-to-value (LTV) ratios. This comparative advantage is reflected in prices and quantities.

We expect all lenders to price lower for lower LTV mortgages. But under Basel II versus I, IRB lenders did so by 31 basis points (bp) more, and increased the relative share of low-LTV lending in their portfolios by 11 percentage points (pp) more, than SA lenders. Such specialisation leads to systemic concentration of high risk (high LTV) mortgages in lenders who tend to have less sophisticated risk management.

With an average 30 percentage point gap between IRB and SA risk weights for LTV ratios below 50%, this corresponds to an economically significant price advantage of 30bp. From the perspective of a typical borrower at this LTV level, with a 50% LTV mortgage against a $200,000 property, repayable over a remaining 15 year term, 30bp translates to around $170 per year or 0.7% of median household disposable income. From the lender’s perspective, a 30bp disadvantage translates to several places in `best buy’ tables, and thus likely material loss of market share.

If instead of risk weights we consider directly the variation in capital requirements, which is driven by both risk weights and lender-specific capital ratio requirements, a 1pp reduction in capital requirements causes a 6bp decrease in interest rates. These latter results can also be interpreted as `pass-through’ rates from lender-specific changes in risk weights or capital requirements to prices, subject to limits on external validity due to the Lucas critique.

Finally, we find that the pass-through from capital requirements to prices is significant only when lenders have low capital buffers (the surplus of capital resources over all regulatory requirements). Lenders with a buffer below 6pp of risk-weighted assets increase prices by 1.7bp basis point for a 1pp increase in risk weights.

Note: Staff Working Papers describe research in progress by the author(s) and are published to elicit comments and to further debate. Any views expressed are solely those of the author(s) and so cannot be taken to represent those of the Bank of England or to state Bank of England policy. This paper should therefore not be reported as representing the views of the Bank of England or members of the Monetary Policy Committee, Financial Policy Committee or Prudential Regulation Authority Board.