McDonalds replacing minimum-wage workers with “Big Mac ATMs“; Coffee stores replacing low-paid barristas with robots, and now Bank of America opening branches with no workers at all.
According to Reuters, the latest trend when it comes to retail banking is to do what every other industry is doing, and eliminate paid labor entirely. In that vein, Bank of America, has opened three completely automated branches over the past month, “where customers can use ATMs and have video conferences with employees at other branches.”
Like many U.S. banks in recent years, Bank of America has been reducing its overall branch count to cut costs even as it opens new branches in select markets. New branches are typically smaller, employ more technology, and are aimed at selling mortgages, credit cards and auto loans rather than simple transactions such as cashing checks. The move is similar to a parallel shift away from active, and highly paid, management, to robotic, algo, and other generally passive, and much cheaper, forms of asset management. Only here we are talking about near-minimum wage jobs quietly going extinct.
It was not immediately clear if the robots have learned the sneakier “cross-selling” techniques from Wells Fargo, or how to churn one’s account with excess fees as per JPMorgan.
Bank of America spokeswoman Anne Pace said there is one completely automated branch in Minneapolis and one in Denver, both of which are relatively new markets for the bank’s consumer business. They are about a quarter of the size of a typical branch. The new branches were mentioned briefly Tuesday by Dean Athanasia, co-head of Bank of America’s consumer banking unit, during a question and answer session at an investor conference, but he did not provide details.
In keeping with the unstated zero net new hires policy, Athanasia said Bank of America will open 50 to 60 new branches over the next year, though Pace said the bank will also be closing branches in certain markets, so the 50 to 60 branches do not represent a net increase. Assuming all of the new branches amount to zero new jobs, then they will also represent no increase in employment either.
Bank of America opened 31 new branches in 2016.
And since this trend of anti-retrofitting of existing branchs, those with workers, for new branches without, is just starting, Bank of America – which had 4,579 financial centers at the end of 2016, compared to 4,726 in 2015 and 5,900 at the end of 2010 – is about to make American robots and ATM machines great again. It is not clear just what angry Tweet trump can shoot out to make BofA changes its mind.
Tag: Channel Preferences
SME’s Are More Connected Than Ever
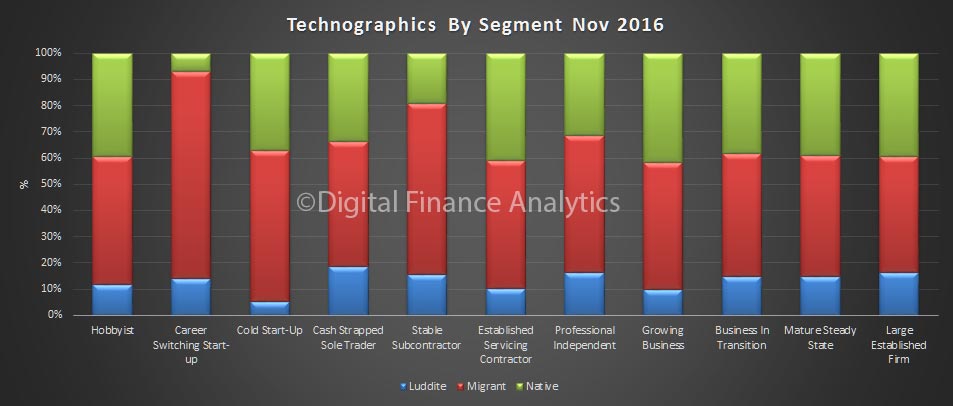
We continue our series on the results from our latest SME surveys. Today we look at the digital trends of SME’s. On average, around 13% of firms are digital luddites – meaning they hardly use digital at all, but the rest are digitally aligned. This means they prefer using a mobile device, are likely to be using social media, and to use cloud based services.
We separate these digitally aligned firms into those who are natives – meaning they have grown up digital, and those who have migrated to digital. Natives have a much higher propensity to adopt new technology, and are much more interested in Fintech offerings.
Things get interesting when we look at the segments.
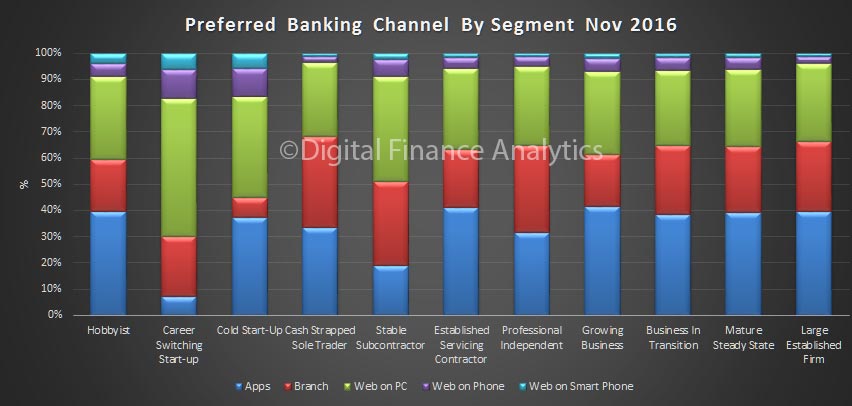
 This is reflected in their preferred channel for banking. More than ever are now wanting their banking delivered via apps, or smart phone. Bank branches are important, for a minority, mainly because of the need to handle cash. The channel mix does vary by segment.
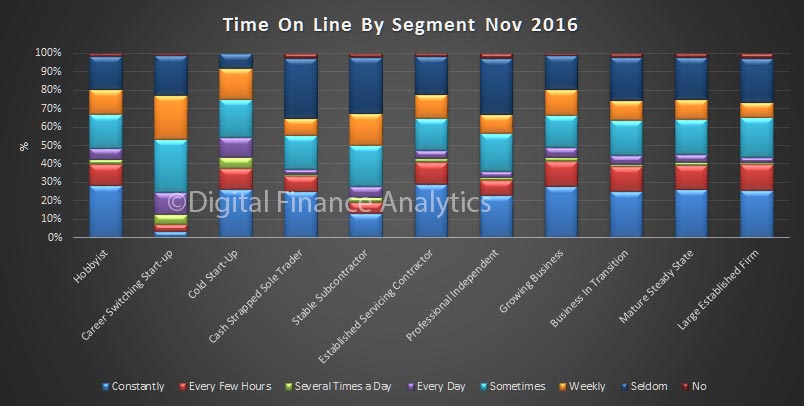
 Many firms are now connected 24×7, but this does vary by segment. Around 20% are hardly online at all. This highlights the need to bankers to have an appropriate set of channel strategies for their SME customers. Many do not.
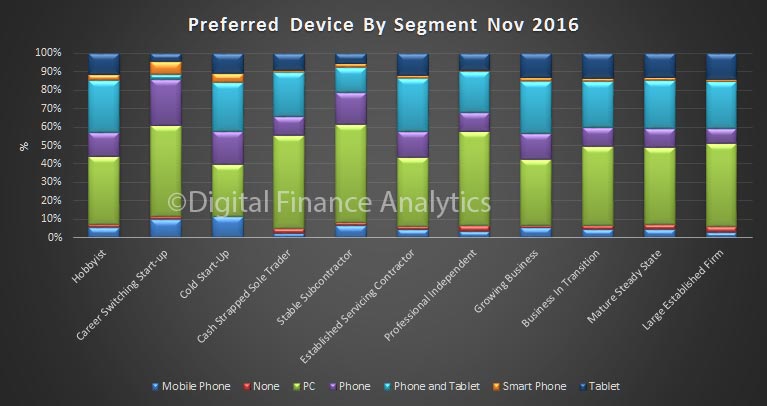
 More are using smart devices as their main device. Some still use personal computers.
 Awareness of cloud delivered services is increasing, and once again we see some interesting variations across the segments. Digital natives are most comfortable.
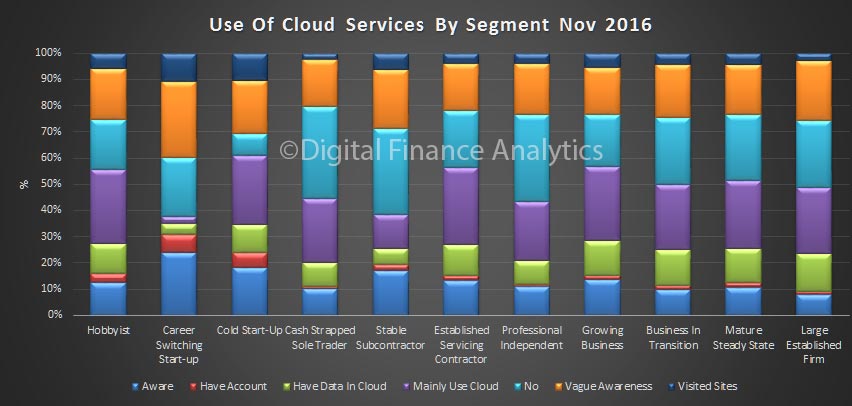 Finally, awareness of Fintech alternatives to the banks continues to grow. Again, digital natives are most comfortable and most likely to consider applying for funds from non-conventional lenders.
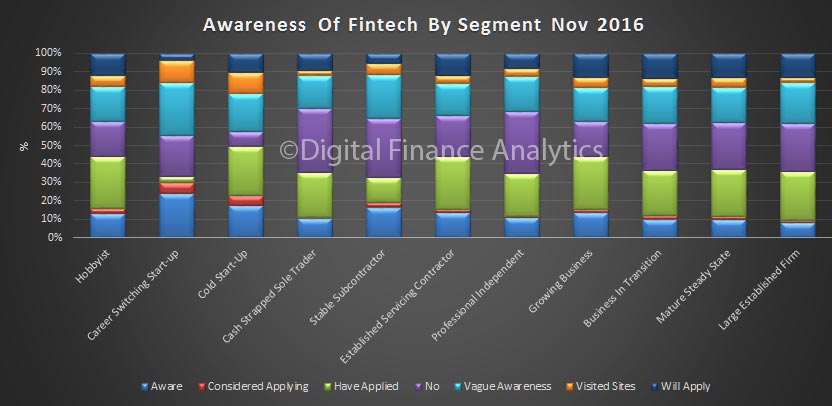 Next time we will look at business confidence, which varies across the segments, and across states.
The Top Digital Suburbs Around Perth
As we continue our series on Australia’s top digital suburbs, today we look at WA, and the region around Perth. The top postcode is 6210, which includes Coodanup, Dudley Park, Erskine, Falcon, Greenfields, Halls Head, Madora Bay, Mandurah, Meadow Springs, San Remo, Silver Sands, and Wannanup around 65 kms from Perth.
The location of digitally active households is becoming an increasingly important question, as mobile penetration and use climbs. It fundamentally changes the optimal marketing approach and channel strategy.
Using data from our household surveys we track the proportion of households with a preference for using digital devices – especially smartphones – for their banking interactions and other online activities. The latest data, which will flow in due course to our next edition of the Quiet Revolution – our channel analysis report – shows that there are large numbers of digitally savvy consumers and small businesses who want more digital, and less branch. They want a “mobile first” offering.
To illustrate this we map the current branch representation around Brisbane, based on the latest APRA points of Presence report.
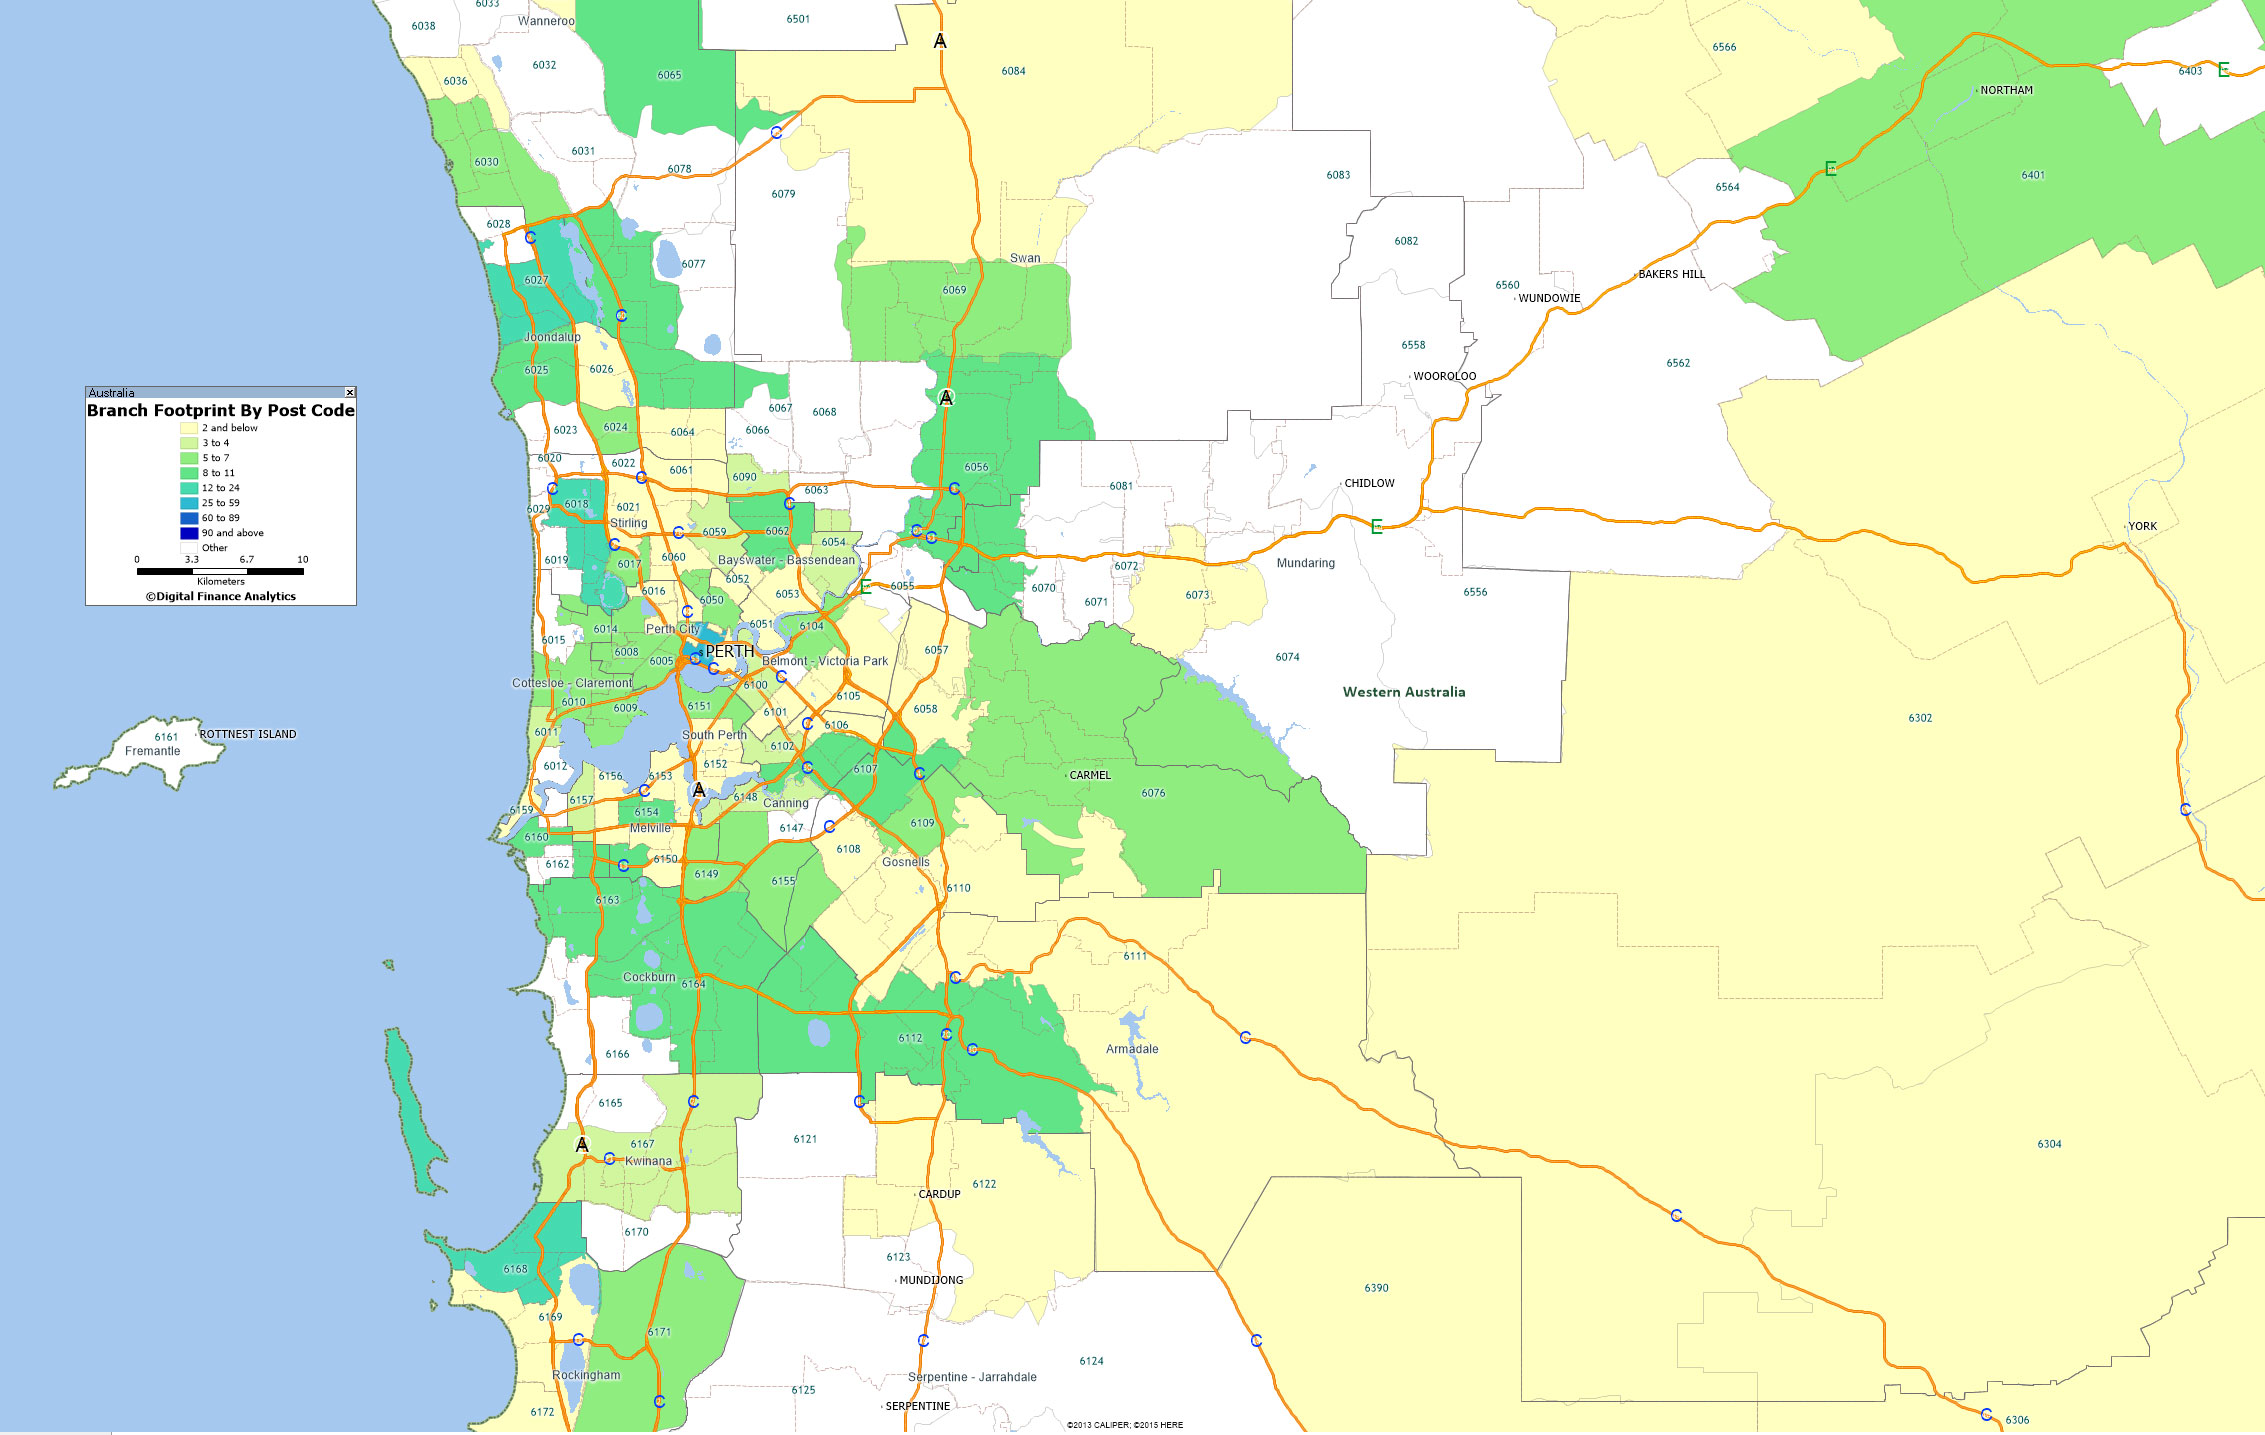 Then we mapped the number of households by digital segments – identifying those seeking a mobile first solution – to postcodes. There is a striking mismatch between the two.
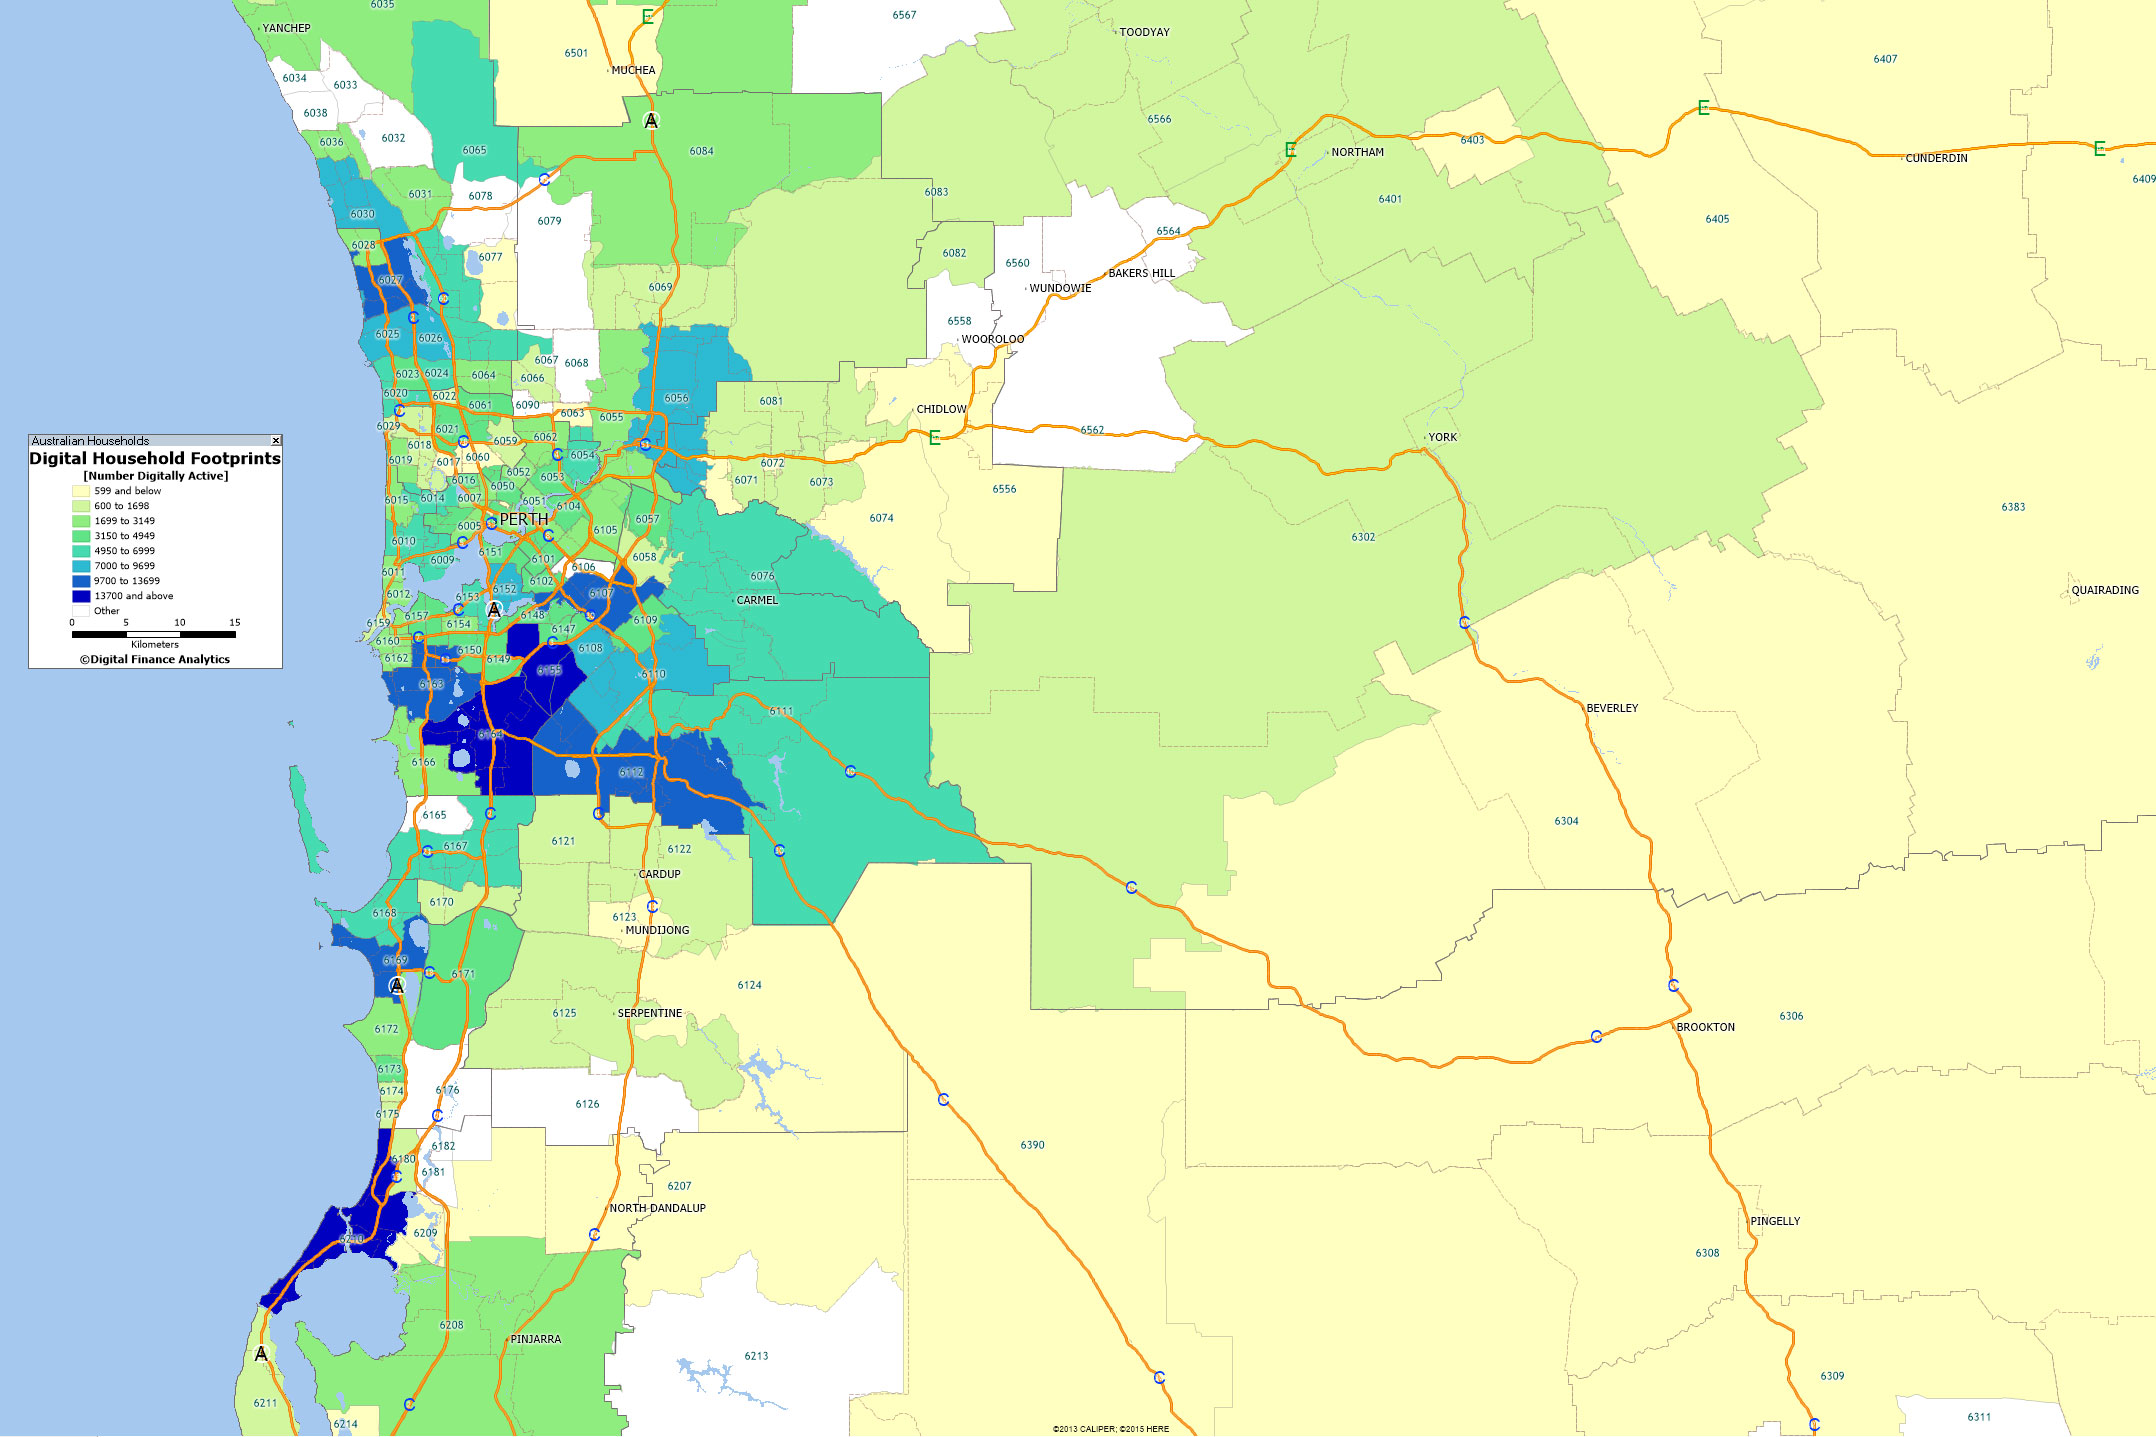 Here is the top 10 listing by number of digitally aligned – mobile first – households across SA. They vary by segment, age, zone and region.
 This information is useful to anyone wishing to engage with these households because it highlights where the centre of gravity for online initiatives should be focussed. The point is that although households are in the digital world, they still have a geographic centre. Digital still has a geographic sense.
Looking at the banks, it seems that they are not heeding the geographic concentration of mobile first households, and nor are they fully comprehending the changes afoot. We think it likely there will be significant stranded costs in the branch network, and insufficient focus on “mobile first”banking offerings.
Households are leading the way.
Next time we will reveal the top ten digital suburbs across Australia.
The Top Digital Suburbs Around Adelaide
As we continue our series on Australia’s top digital suburbs, today we look at SA, and the region around Adelaide. The top postcode is 5159, which includes Aberfoyle Park, Chandlers Hill, Flagstaff Hill and Happy Valley in South Australia. The area is about 17 kms from Adelaide.
The location of digitally active households is becoming an increasingly important question, as mobile penetration and use climbs. It fundamentally changes the optimal marketing approach and channel strategy.
Using data from our household surveys we track the proportion of households with a preference for using digital devices – especially smartphones – for their banking interactions and other online activities. The latest data, which will flow in due course to our next edition of the Quiet Revolution – our channel analysis report – shows that there are large numbers of digitally savvy consumers and small businesses who want more digital, and less branch. They want a “mobile first” offering.
To illustrate this we map the current branch representation around Brisbane, based on the latest APRA points of Presence report.
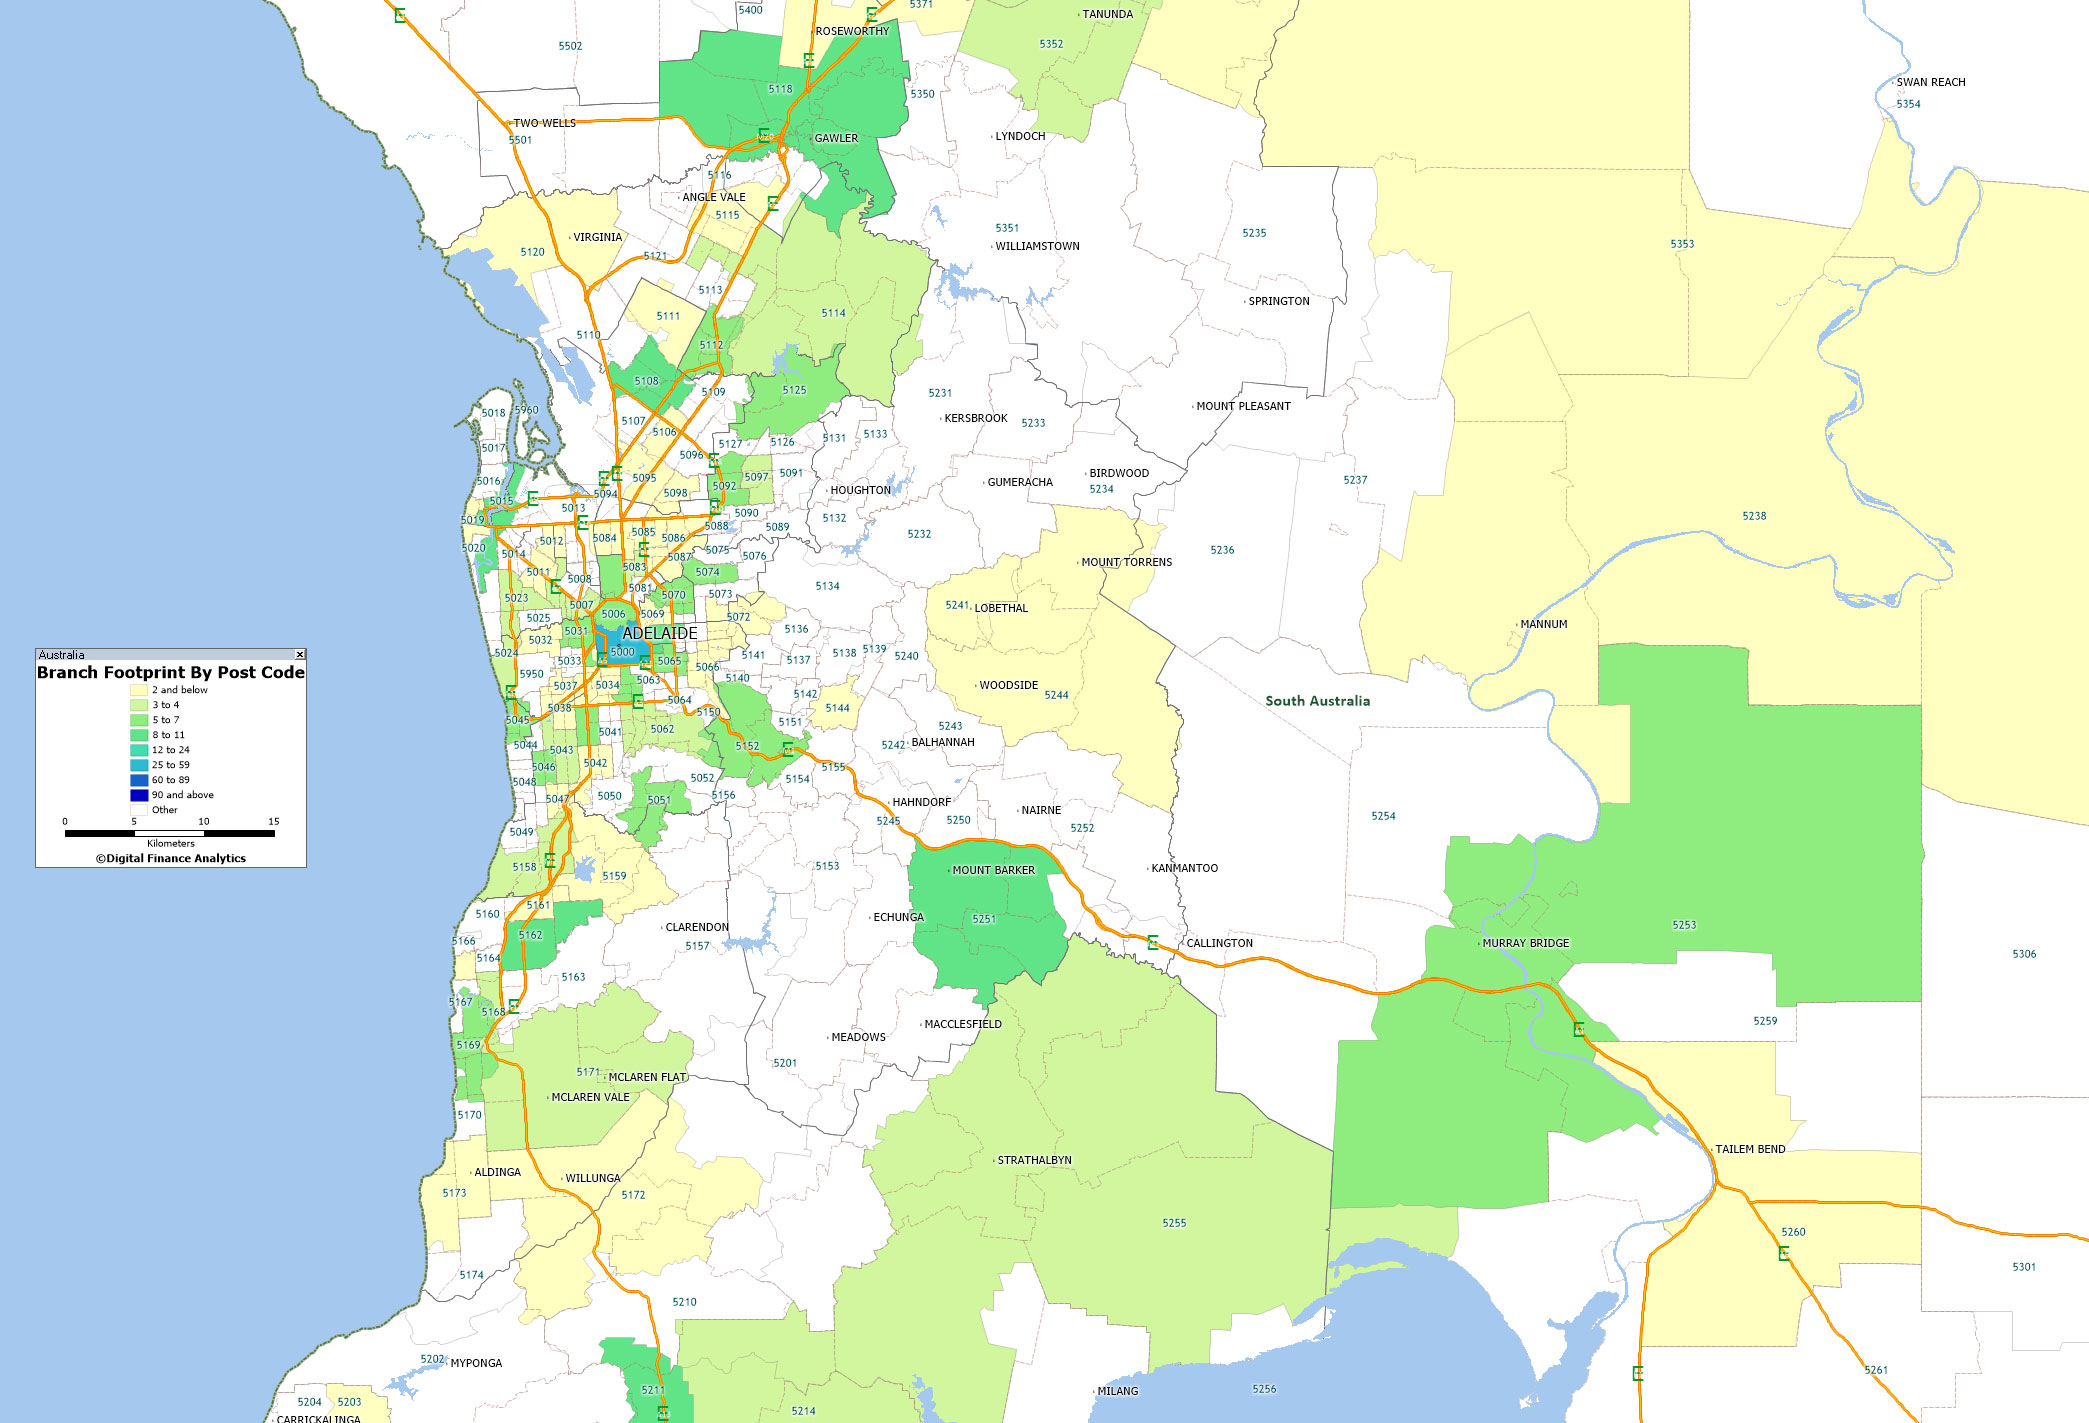 Then we mapped the number of households by digital segments – identifying those seeking a mobile first solution – to postcodes. There is a striking mismatch between the two.
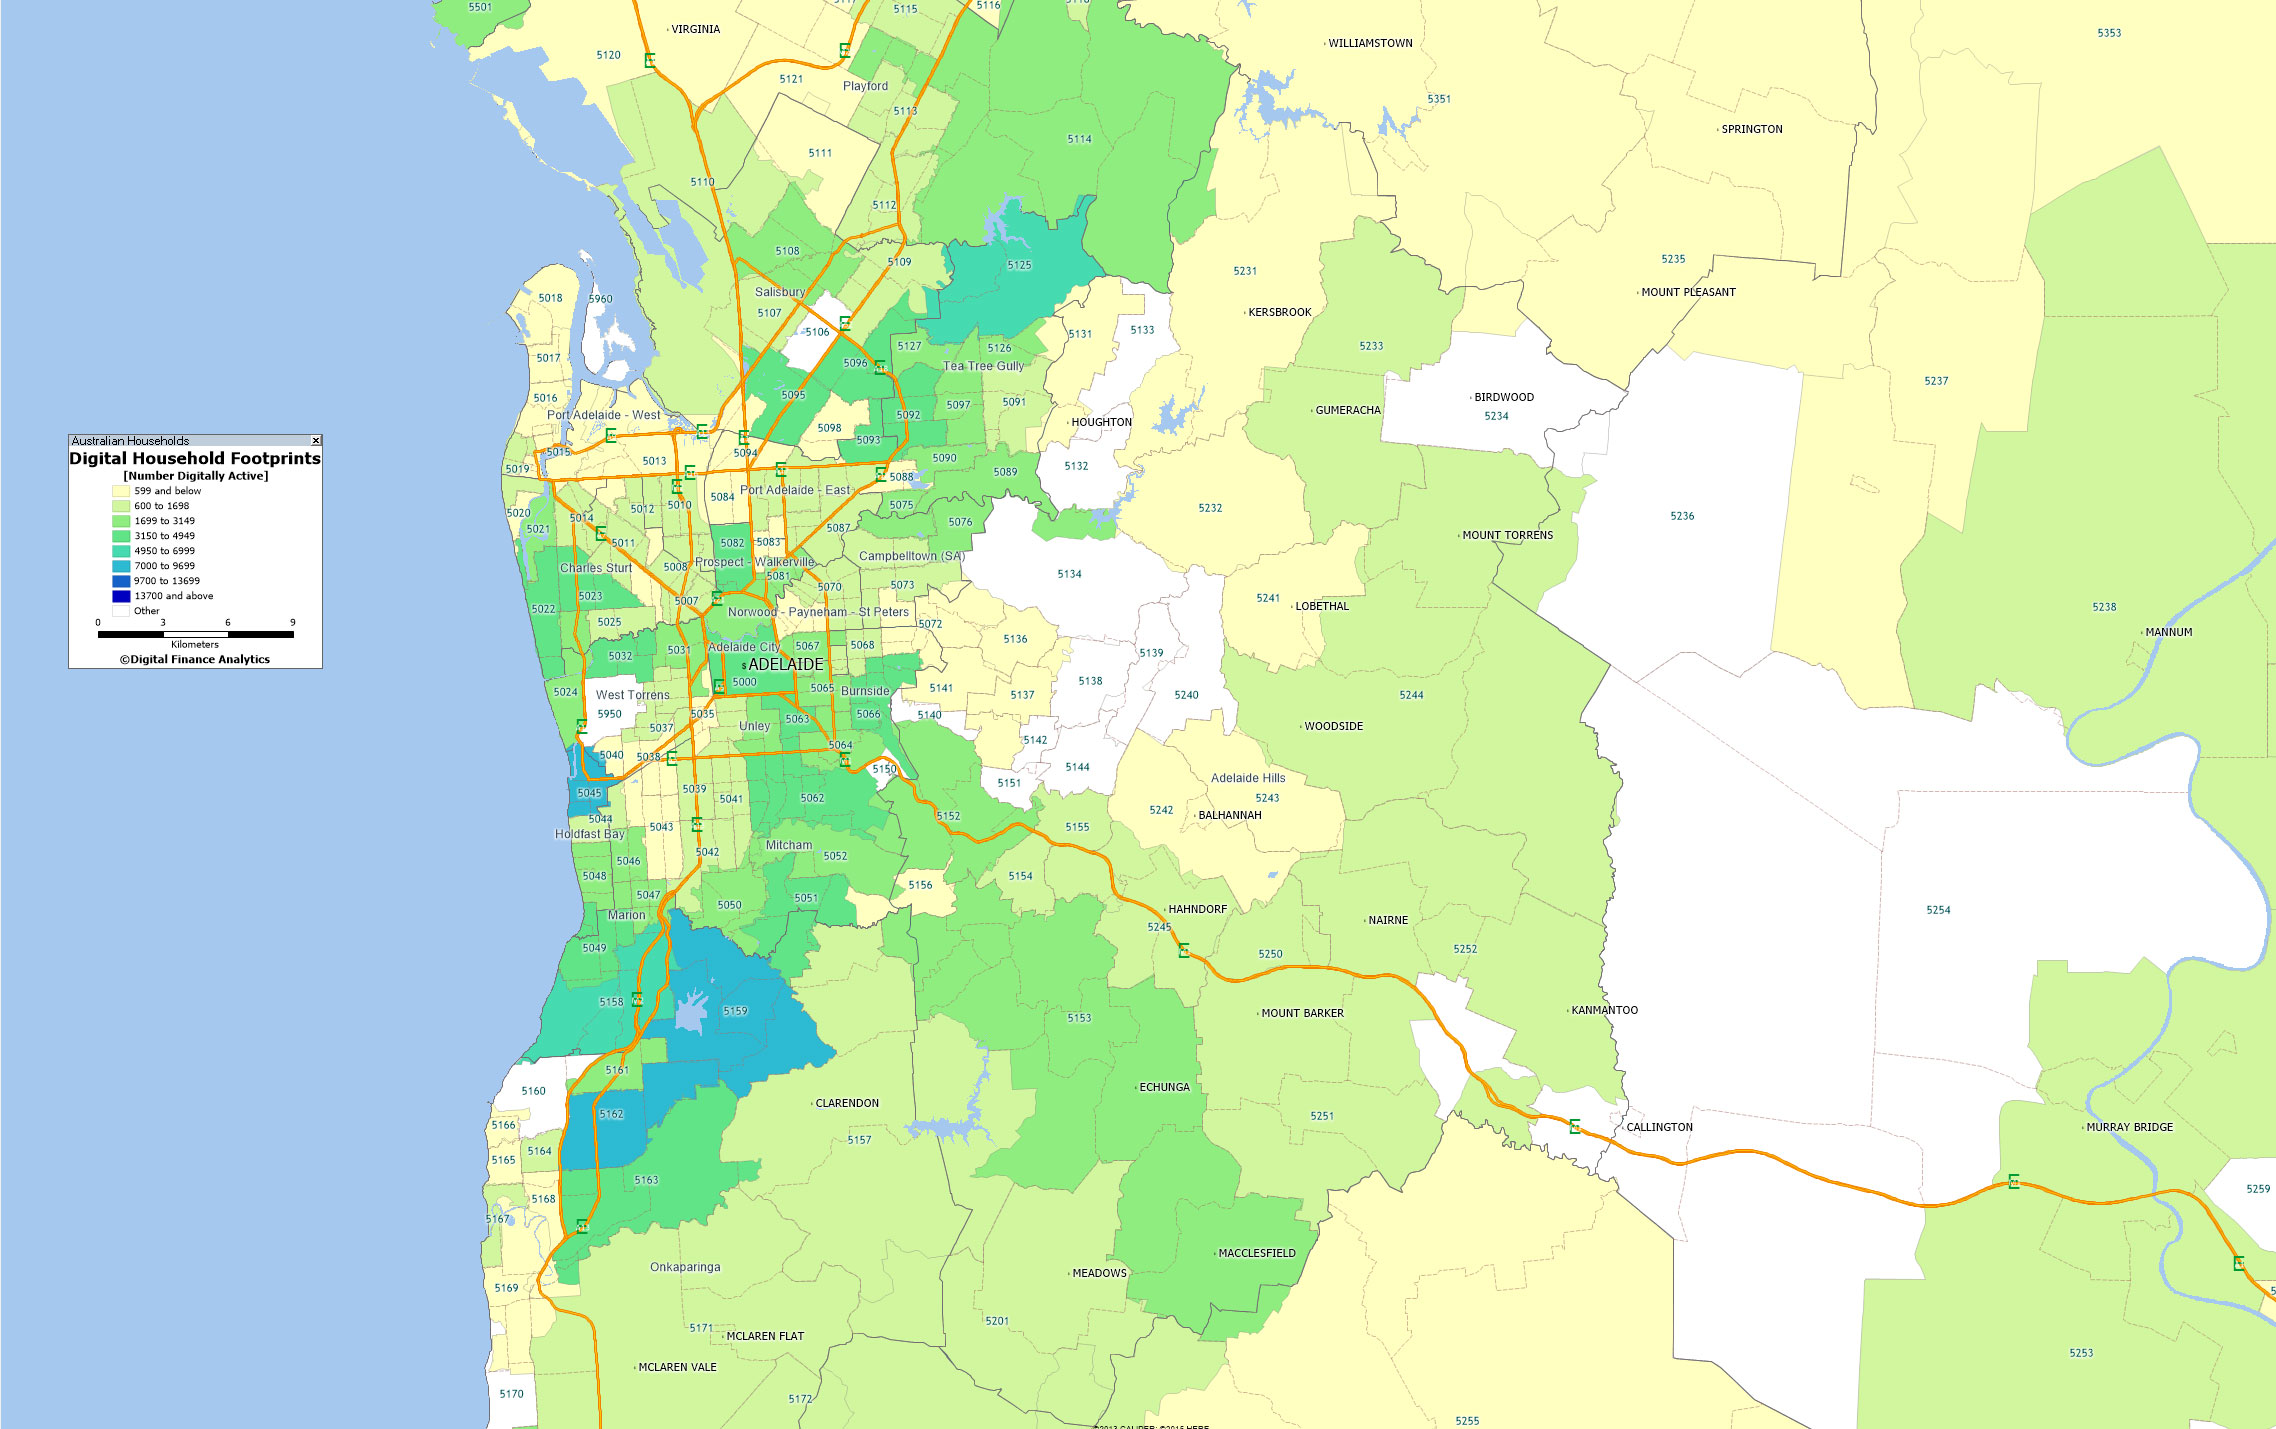 Here is the top 10 listing by number of digitally aligned – mobile first – households across SA. They vary by segment, age, zone and region.
 This information is useful to anyone wishing to engage with these households because it highlights where the centre of gravity for online initiatives should be focussed. The point is that although households are in the digital world, they still have a geographic centre. Digital still has a geographic sense.
Looking at the banks, it seems that they are not heeding the geographic concentration of mobile first households, and nor are they fully comprehending the changes afoot. We think it likely there will be significant stranded costs in the branch network, and insufficient focus on “mobile first”banking offerings.
Households are leading the way.
Next time we will look at the state of play in Perth and then reveal the top ten digital suburbs across Australia.
Social Media Now The Centre Of Influence
The latest Deloitte’s Media Consumer survey, based on 2,000 consumers, highlights Social media is playing a central role in how we search for, discover, consume, and interact. Indeed social media networks have become entertainment destinations in their own right. Facebook takes centre stage.
We are seeing new content formats, streamed video and advertising seamlessly integrated in a social context, providing an immersive and frictionless media experience. This manifests in many ways including the broadcast of live sports on Twitter, integrated news feeds through Facebook instant articles, music streaming embedded into Twitter or the use of bots to deliver a ‘conversational’ two-way news experience. Social media is increasingly powerful in shaping our media consumption experiences. This year, we are seeing the popularity of more immersive forms of content and media. Going to the movies saw an increase of 20% since last year, and although nascent, the arrival of virtual reality (VR) is upon us with the majority of respondents (58%) believing it will enhance their viewing experience. Video advertising or live streaming integrated into social platforms is the new norm.
At the same time, we seem to be becoming more engaged with the content that we consume – this year sees multi-tasking while watching TV remain at almost ubiquitous levels, but we are doing fewer additional activities at the same time. More of us are paying for the video content that we want – 22% of respondents pay for a subscription video on demand (SVOD) service and we pay more attention to content that we have paid for (70% of respondents agree they tend to pay closer attention to content that they have paid to watch). We would rather pay for TV shows than be distracted by ads (43% of respondents agree) and in news, where we are willing to pay for news online, it is because we value the in-depth analysis.
This year we have focused on the Millennial effect – the extent to which Millennials are shaping the future of media consumption.
There are many behaviours which are subsequently adopted by Xers, Boomers and even Matures. But there are key differences within the ‘Millennials’ demographic. Trailing Millennials (14-26 year-olds) are the true digital natives, observable in distinct behaviours such as higher adoption of streaming as a means for accessing TV content (used more than live programming), increased willingness to pay for all forms of digital content and more pronounced digital habits such as bingeing and multi-tasking.
Highlights include, the number of connected devices we maintain continues to increase – 56% of survey respondents are digital omnivores (owning a smartphone, laptop and tablet), up from 50% last year. Device selection is all about convenience with 69% of respondents agreeing that being able to watch content when they want is more important than the device on which they watch it. Managing all these devices can be difficult, with 39% of respondents believing that managing all the connected technology in their house is so complex that they require help to operate it.
Sixty-one percent of Australian survey respondents engage with social media on a daily basis – up slightly since last year (59%) and representing 31% growth (CAGR) since 2013. This increase is observed across all age groups, although the fastest rates of growth over the past four years have been among Boomers (38% CAGR) and Matures (40% CAGR).
Uptake is greatest within Millennials with only 4% of Leading Millennials not actively using social media. Of those who do use social media, 77% of Trailing and 84% of Leading Millennials engage with these networks on a daily basis. Among Matures, there are two camps – as many Mature respondents are checking their social networks daily (36%) as there are not using social media at all (37%). For Boomers, nearly half are daily users (47%), whilst only a quarter (25%) aren’t on any form of social network.
Twenty-seven percent of social media users check or update their status four or more times a day (up from 23% in 2015). These heavy users are predominately Millennials, although this year they are also joined by some more socially active Boomers and Matures. And as the mix of generations actively engaging with social media changes, it helps to know who is using what and why. Friends, followers, or connections? Facebook is the big winner among social networks. It is by far the most commonly used – 92% of survey respondents who use social media are actively using Facebook and this is reflected across generations. Facebook has become the centre of our social (media) lives, used to ‘keep up’ (in all senses) with our near and dear, whether they are near or far.
Seventy-eight percent of users rank ‘keeping up with friends and family’ in their top three reasons for using Facebook. Being connected with others is more important to them than other reasons for use, such as entertainment (43%) or simply distraction (42%). But what this connection really means is more nuanced. Facebook has shifted our definition of what it means to be a ‘friend’ or to be ‘connected’. It is a platform focused on growing user interactions and now boasts a plethora of services to achieve this outcome (e.g. posts, photos, videos, live video, messenger, games and news sharing). Using Facebook can perhaps now best be seen as something of a habit, less about real connections and more about keeping up with the facade that people curate (intentionally or not) on their profile pages.
As a consequence, for some it might be starting to lose its appeal. Younger generations are not the most represented on Facebook, it’s their parents and grandparents. Ninety-six percent of Boomers who are using social media are actively using Facebook, surpassing the 92% of Leading Millennials who are. And of all generational groups, Trailing Millennial social networkers are using Facebook the least, with 88% identifying as active users.
The youngest generation – the most prolific users of social media – are looking further for their social media needs and newer (post-2010) social networks are catching on. The second and third most actively used social networks are Instagram (owned by Facebook) and Twitter – though they significantly lag the scale of Facebook (28% and 24% of survey respondents who use social media are on these two platforms). Instagram’s appeal is in the visual moment captured; 66% of survey respondents rank ‘sharing photos and videos’ in their top three reasons for use. In contrast, survey respondents value Twitter for both entertainment (56%) and keeping up to date on breaking news (52%).
Brokers key to success for new market in 2016
Mortgage refinancing will drive the market in 2016, according to a new report, and brokers are in the prime position to capitalise.
According to the J.P. Morgan Australian Mortgage Industry Report (Vol 22), produced in collaboration with Digital Finance Analytics, there has been a noticeable change in who has been transacting, with a clear switch from investors to refinancers.
Investor demand has been reducing driven by lower expectations of house price appreciation and a tougher regulatory outlook. Investors have seen the sharpest reduction in intention to transact, reducing from around 50% to 40% for solo investors and around 75% to 60% for portfolio investors in 2015.
However, with interest rates still at record lows, the number of borrowers intending to refinance has been continuously increasing. Those looking to refinance has risen from 10% in early 2015 to 35%, according to the report, as they look to establish better terms on their mortgage or release equity for other investments as house prices have risen.
J.P. Morgan banking analyst Scott Manning says brokers will be key to success in capturing the surge of refinancing activity this year, with around 75% of refinancers expecting to use brokers versus other channels.
According to Manning, we are already starting to see the major banks adapt. For example, ANZ has been increasing its broker usage while simultaneously decreasing its branch footprint – a trend which he says will continue across the banking landscape over the next five years.
“Certainly brokers are not only a high proportion of flow but they are a significantly higher proportion of that of new bank business. They are very important for banks to try and grow their book basically. So I think [brokers] are here to stay and I think that proportion will continue to improve over time,” Manning told Australian Broker at the release of the report.
“If you look at what the banks of doing, they are reducing the size of the footprint in terms of square metres by moving banks. They are using smart ATMs where you can bank cash and bank deposits without going into a branch. They have kiosks with after-hours access where you can get coin change for SMEs.
“They are migrating their footprint off branches already. I think ANZ has just been a bit more aggressive on that path… We can see that in Westpac as well. Their branches were down last year in particular and they have renegotiated the new deal with Australia Post to do more of the day-to-day banking in remote areas through the post office.”
What Consumers Expect from Mobile Retail Sites
From eMarketer. Though US data, here is an interesting snapshot, which highlights the importance of mobile devices in the context of online retail. Our research shows that in Australia, more and more users now have a smart phone or tablet, and this device has become their preferred access device for online services including retail and banking services.
Mobile makes up sizeable share of US retail ecommerce traffic. When it comes to a retailer’s mobile site, user reviews are the top feature that consumers expect to see, according to a September 2015 survey. Customer support is also key.
EPiServer, a global software provider, polled 1,060 US internet users ages 18 and older about their top mobile retail site features. More than half of respondents said they expect to see user reviews on a retailer’s mobile site. Additionally, 38% of internet users said they expected easy and direct customer support. That same percentage also counted on a mobile retail site having an automatic adaptation of screen size.
Location-based functions or maps, as well as wish list functions, rounded out the top five list.
Retailers understand the importance of mobile. Indeed, research from Demandware found that mobile devices made up a significantly higher share of US retail ecommerce site traffic in Q2 2015 than they did a year before. But while a majority of time spent engaging with digital retail content is via mobile devices, the channel only accounted for 13% of US digital retail sales in Q4 2014, per data from comScore.
Aussies using only their Mobile or Tablet to bank triples in 3 years
According to Roy Morgan, an estimated 1.1 million (5.8% of) Australians use only their mobile phone or tablet to conduct banking activities in an average 4 week period. In three years, the number of Australians doing “mobile-only banking” has tripled. This means they do not use any other banking channel, such as website, branches, adviser/banker or the telephone, to deal with their bank. This chimes with earlier DFA research on channel preferences, where we showed that specific segments lead the way into digital usage.
By June 2015, 33% of Australians conducted internet banking using a mobile phone or tablet (app) in an average four week period. This has resulted in a group of people that only deal with their banks via a mobile or tablet. As assumed, younger generations take up digital channels at higher rates than older ones, with close to one out of ten people under 34 years old doing ”mobile-only banking”.
% who only conduct banking via a mobile phone or tablet in 4 week period
As cash becomes quaint, are ATMs on path to obsolescence?
From The Conversation. Before the advent of the internet, the greatest gain in customer convenience within retail banking came from the creation of automated teller machines (ATMs).

ATMs led to significant advances in how customers access financial services because – coupled with the direct deposit – they freed workers from so many routine tasks. No more depositing a paycheck in person, inquiring about balances or paying utilities solely during banking hours. ATMs enabled impromptu dinners and last-minute shopping over the weekend.
But now that we have so many other alternatives to fulfill our banking needs – we can deposit a check with a snap from our smartphones – do we really need ATMs? Why do we require physical cashpoints given that mobile payments and e-commerce continue to grow, heralding the “death of cash”?
Claims that the ATM is a passing technology are almost as old as the idea of a cashless society, and for a variety of reasons it’s probably premature to predict its demise.
The rapid embrace of the digital and resistance to the traditional by today’s youth may eventually bring about the ATM’s end, but for a long time to come, the ATM will likely remain central to our relationship with money.
Slow pace of change
First off, banknotes and ATMs are two of the most ubiquitous products in the world. Whereas banknotes have social meaning, cashpoints recede to the background of everyday life. Most urbanites typically stick to the same three to five cash machines for most transactions.
Banknotes and coins still represent 9% of the eurozone’s economy and 7% in the US, according to the Bank for International Settlements. Even in almost cashless Sweden, cash still makes up 3% of the economy.
Secondly, people like the freedom to choose between alternative payment options. So even as we use smartphones more often to make purchases at the grocery store, credit cards are still how we buy most things online, and we keep cash in our wallets for smaller items.
Thirdly, changes in retail payments have proven to be very slow rather than disruptive, and their path differs from country to country, suggesting it’ll be a while before the ATM is displaced.
To illustrate this long-winded process of innovation, consider that the first cash machine emerged in 1967, yet the device became mainstream only in the 1980s.
Today, most of the 2.6 billion bank ATMs currently in operation still run on Windows XP – an operating system Microsoft stopped supporting last year. The industry plans to upgrade and even make the switch to non-Microsoft systems, but that change may not take place until around 2020. That’s largely because the average life of an ATM hovers around six years.
Another example is the contactless ATM, which is beginning to slowly take hold with the rise of smartphones. It could make the transaction more secure and reliable by reducing possibilities for card skimming as well as offering the advantage of “client present.” Yet my own research came across references to ATM manufacturers considering devices that would interact wirelessly with customers as early as the 1990s. So it’s an open question why it took so long for this functionality to emerge.
Industry growth
In the meantime, the global market for ATMs continues to expand, but this growth is increasingly skewed and uneven. Global shipments of new ATMs reached a record 466,000 in 2014, up 5% from the previous year, according to London-based Retail Banking Research.
On a regional level, the picture is much more varied. Double-digit gains in the Asia-Pacific market contrast with double-digit declines in North America and Central and Eastern Europe.
Allied Market Research expects that growth to accelerate in the coming years. The US-based group forecasts the number of ATMs to surge 11% a year through 2020.
A fragile future?
Despite that optimistic forecast, the future of the ATM may be fragile as its once cutting-edge functionality becomes ubiquitous through other devices.
Back in 1975, technology companies IBM and NCR promised customers that ATMs would, in the not too distant future, be a one-stop shop for all their banking needs, from making deposits and dealing with account inquiries to making account transfers. Today all of that can be done online, while the functionality of most ATMs in developed countries has been cut down to the bone.
Despite this, the ATM still appears to have a home within banks’ self-service strategy, which is based on greater complementarity rather than cannibalization among delivery channels and means of payment.
The “omnichannel” is the buzzword that will dominate the industry over the next five to seven years. It envisions enabling customers to do their banking and interact with their financial institutions however they like — at the branch or ATM or via the internet or a mobile device.
And even as banks strive to make customer interactions more seamless, they’re also slow to push full automation too quickly because it reduces opportunities to engage in high-margin sales – think mortgages and other loans and services.
The process of balancing convenience through automation with maximizing sales opportunities involves reorganizing the ATM fleet to ensure high availability and an enhanced customer experience to retain, and even increase, customer loyalty while not losing customer trust.
Millennials and the future of banking
Perhaps the biggest issue shaping ATMs in the near future will concern the choices of millennials, those for whom the internet, mobile phones and plastic cards are a fact of life, checks are unknown and cash is quaint.
They challenge financial institutions and their business models to do more faster because they have easier and faster access to better technology than offered by the banks’ legacy systems through the multitude of apps on their smartphones, wearables, tablets and elsewhere.
Left to their own devices, millennials could spell the end of the ATM by 2035 or thereafter.
But that’s still a long way off, and cash – the raison d’etre for the ATM – is still king. Even for most advanced economies, cash represents about half of transactions below US$50.
So it will be a while before we see the end of the crisp paper bill and the coins that fill jars across the globe. In other words, “Long live the ATM!” – so long as there remains a need for after-hours and quickly dispensed cash.
Author – Bernardo Batiz-Lazo, Professor of Business History and Bank Management at Bangor University
Digital ad spend will pass $5 billion to account for 43.3%
Digital is where Australian advertisers are heading. According to eMarketer, total media advertising spend in Australia will reach $11.59 billion in 2015. Digital ad spend will pass $5 billion to account for 43.3% of total media ad spending, and mobile ad expenditure will total $1.46 billion—29.0% of digital and 12.6% of total media ad spending.


