Beijing Restrictions Will Cause Chinese Buyers To Retreat From Global Property Market

According to the South China Morning Post, cash-rich Chinese firms – the big spenders in the global property market in the past four years – are getting cold feet as Beijing tightens controls on outbound investment.

“Requests for overseas acquisitions are already drying up,” said Paul Guan, a partner with global law firm Paul Hastings who advises Chinese institutional investors on overseas real estate.

“Business owners all know the Chinese government has sent a clear signal this time that they want to curb overseas investment in the property sector,” Guan said.

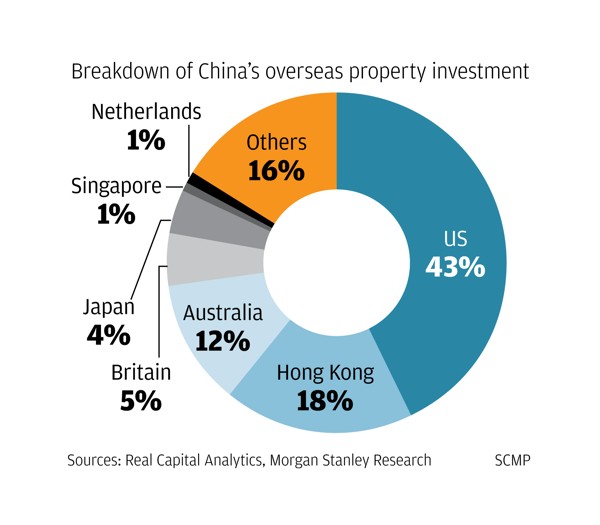
The move will put pressure on prices in key property markets from New York to London. The top three overseas destinations for Chinese property investors in 2016 were the United States, Hong Kong and Australia, while pending deals have accumulated mainly in Britain and the US over the past six months, according to Real Capital Analytics.

Chinese were the biggest foreign investors in US and Australian real estate last year, accounting for 25 per cent of deals in the US and 26 per cent in Australia.

They also accounted for 25 per cent of all central London commercial property acquisitions in 2016, while some 80 per cent of residential land sold in Hong Kong so far this year was bought by Chinese firms, according to data from Morgan Stanley. Chinese investment in the city has quadrupled since 2012, the financial services firm said.

“Transaction volumes will definitely go down in the hot destinations, and property prices could also be affected,” said Hans Kang, chief investment officer of InfraRed NF Investment Advisers.

On Friday, the State Council said it would restrict overseas investment in a number of areas including property, hotels, the film industry and other forms of entertainment, and sports clubs. Investors would have to seek special approval from the regulators for such ventures.

Dalian Wanda Group on Tuesday backed away from a £470 million (US$605.63 million) acquisition of the Nine Elms Square site in London, after the government’s new capital controls were announced.

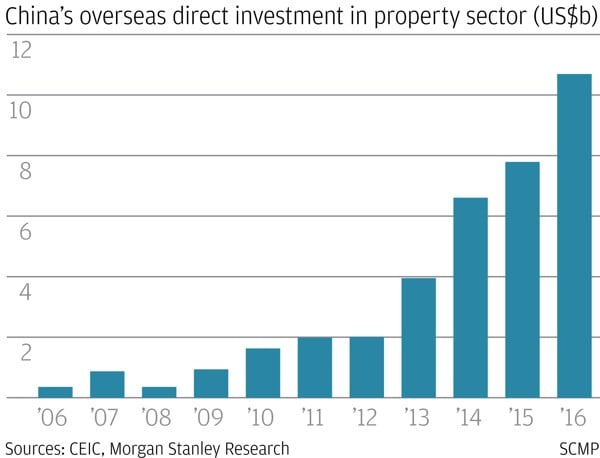
Outbound investment by Chinese companies has surged since 2013, with Beijing pushing for more of them to go global and as foreign exchange reserves continued to pile up.

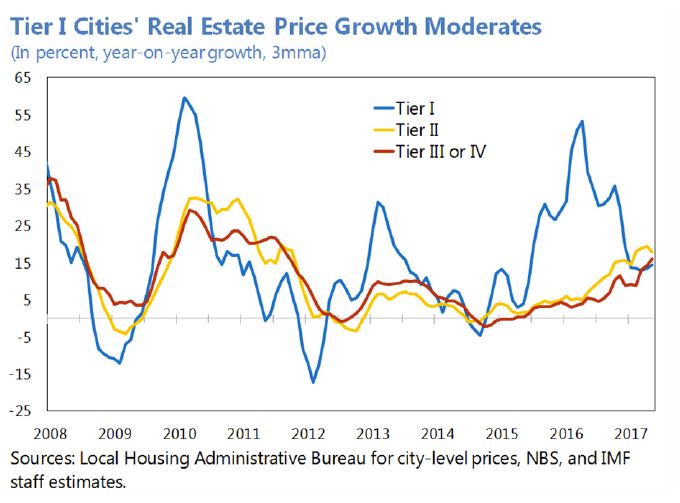
But the government has since 2015 become worried about the scale of capital outflows, particularly in property, at a time when the yuan has sharply depreciated and there are fears of a domestic property bubble, creating problems for the country’s balance of payments.

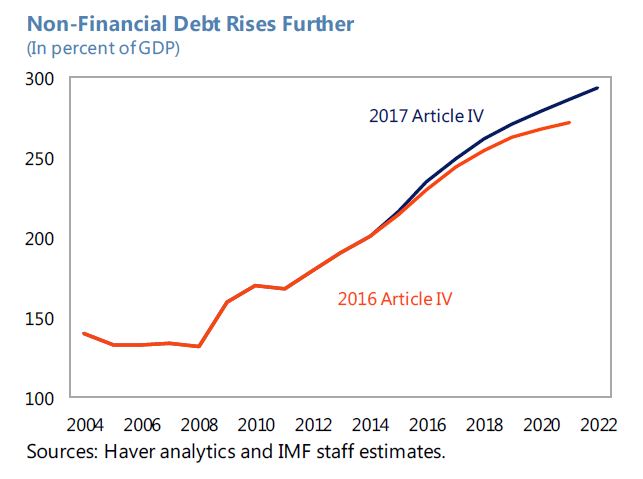
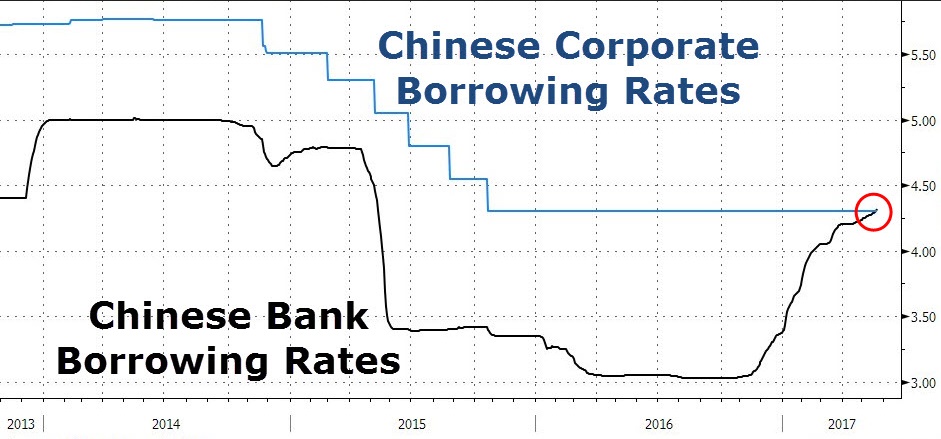
Added to those fears are companies that borrow money on mainland China to buy overpriced overseas assets, which runs counter to President Xi Jinping’s deleveraging efforts.
“That could hit the financial stability of China’s banking system if there are any fluctuations in outside markets,” Kang said.
“Chinese buyers accounted for 25 per cent of all central London commercial property acquisitions in 2016, according to Morgan Stanley.

In past months, policymakers have tightened regulations on “irrational overseas investment” and ordered banks to check the credit exposure of a number of aggressive dealmakers including Wanda, Fosun International, HNA Group and Anbang Insurance Group.

All of those companies had been on a shopping spree in overseas property markets in recent years.

Anbang, for example, made headlines in 2014 with its US$2 billion purchase of New York’s Waldorf Astoria hotel.

HNA Group, which owns Hainan Airlines, meanwhile bought a 25 per cent stake in Hilton Worldwide Holdings for US$6.5 billion last year. It has also paid a record HK$27.2 billion for four residential sites in Hong Kong since November.

And Wang Jianlin, who runs one of China’s biggest property developers, Wanda, has invested some A$2 billion (US$1.58 billion) in two mega mixed-use projects in Australia since 2014.

Wang Jianlin, who runs Wanda, has invested US$1.58 billion in two mega mixed-use projects in Australia since 2014.

But now those dealmakers find themselves under intense government scrutiny, their ambitious global plans have come to a screeching halt and their focus is shifting back to the domestic market.

Wang told financial media outlet Caixin last month that his company would “actively respond to the state’s call and divert its main investments to China” after it sold off US$9.3 billion of assets to rivals in order to repay debts.

The retreat is already being felt in global markets. Outbound property investment by mainland Chinese firms was down 82 per cent in the first half from a year ago – and it’s expected to plummet 84 per cent for the whole year to US$1.7 billion, according to Morgan Stanley. The total investment in 2016 was US$10.6 billion.

That trend will create headwinds for prices in Hong Kong, the US, Britain and Australia over the medium term – especially for office assets in Manhattan, central London and Hong Kong, which is the most exposed, it said.

Guan from the law firm said prices in the high-end residential market in New York were also likely to be hit by the loss of Chinese buyers.

For the first time since October 2012, no contracts worth over US$10 million were signed in the city last week, according to data from Olshan Realty.

Others were more positive, and believed the impact of the restrictions would be limited to related markets, which would continue to be shaped by broader macroeconomic trends and fundamentals.

“Fortunately, the United States’ key markets are still desirable enough that without one particular flow of capital from a region, the impact should be nominal if all economic and market conditions are normal and healthy,” said Andrew Feldman of New York-based real estate agency Triplemint.

Added to that, many Chinese companies had already moved currency overseas and could continue to issue debt or equity through offshore platforms if they wanted to invest in property, according to Ben Briggs, executive vice-president of Briggs Freeman Sotheby’s International Realty based in Xiamen.

“They will just do the investments in a more quiet and sophisticated way,” Briggs said.

Thomas Lam, senior director of Knight Frank, agreed that the restrictions would not stop Chinese companies from investing abroad.

“In the longer term, going global will continue and it will remain an essential means for Chinese companies to diversify risks and secure sustainable returns,” Lam said.

China’s Growth Sustainable Says IMF

The results from the 2017 Article IV consultation with China have been published. The IMF acknowledged that China’s continued strong growth has provided critical support to global demand and they commended the authorities’ ongoing progress in re-balancing the Chinese economy toward services and consumption.

They noted that economic activity had recently firmed and saw this as an opportunity for the authorities to accelerate needed reforms and focus more on the quality and sustainability of growth. They supported the importance of reducing national savings to help prevent domestic and external imbalances and emphasized the need for greater social spending and making the tax system more progressive. Stronger domestic demand helped further reduce China’s external imbalance, though it remains moderately stronger compared to the level consistent with medium-term fundamentals

Amid strong growth, the authorities have pivoted toward tightening measures, reflecting a greater focus on containing financial sector risks.

Debt is now expected to continue to grow as the IMF now assumes that the authorities will broadly maintain current levels of public investment over the medium term and not substantially consolidate the “augmented” deficit, reaching 92 percent of GDP in 2022 on a rising path. Private sector credit is projected to continue increasing over the medium term. Thus, total non-financial sector debt reached about 235 percent of GDP in 2016 and is projected to rise further to over 290 percent of GDP by 2022.

They say downside risks around the baseline have increased. A key consequence of the new baseline is that it envisions China using up valuable fiscal space to support a growth path with slower rebalancing and a higher probability of a sharp adjustment. Thus, if a sharp adjustment were to materialize, China would have lower buffers with which to respond. Such a potential adjustment could be triggered by several risks, including:

  • Funding. A funding shock could come from at least two (related) pressure points. The first is the mostly short-term, “interbank” wholesale market (which includes banks’ claims on each other and on NBFIs). The second is a loss of confidence in short-term asset management products issued by NBFIs, or a run on the WMPs which fund them.
  • Retreat from Cross-Border Integration. Should higher trade barriers be imposed by trading partners, the impact would depend on their coverage and magnitude, how exchange rates respond, and whether China retaliates. For example, an illustrative simulation in the IMF’s Global Integrated Monetary and Fiscal Model suggests that if the U.S. puts a 10-percent tariff on Chinese exports and China allowed its real exchange rate to adjust, real GDP in China would fall by about 1 percentage point in the first year. If China retaliated with similar tariffs on U.S. imports, its GDP would contract further. However, given the complexity of global trade relationships and uncertainty regarding how  exchange rates would adjust, the effect could be larger and more disruptive.
  • Capital Outflows. Pressure on the exchange rate could resume because of a faster-than-expected normalization of U.S. interest rates, much weaker growth in China, or some other shock to confidence. In an extreme scenario, the pressure could lead to renewed large reserve loss and eventually a potential disruptive exchange rate depreciation. However, this risk is likely small in the short run due to the stronger enforcement of CFMs, the prominence of state-owned banks in the foreign exchange market, and ample foreign exchange reserves.

While agreeing on the growth outlook, the authorities disagreed about the associated risks. The authorities agreed that 2017 growth was likely to exceed marginally the 6.5 percent full year target. This implied some deceleration during the course of the year and would result in inflationary pressure remaining contained and a broadly unchanged current account. For the medium term, though the authorities shared the view that their 2020 target of doubling 2010 real GDP would likely be reached, they viewed the debt build-up thus far as manageable and likely to slow further as their reforms take effect. They also explained that their “projected growth targets” were anticipatory and not binding. They underscored that reaching the desired quality of growth was a greater priority than the quantity of growth. The authorities viewed domestic concerns, such as high financial sector leverage, as manageable considering ongoing reforms and Chinese-specific strengths, such as high domestic savings. They saw the external environment as facing many uncertainties, such as an unexpected fall in global demand or a retreat from globalization.

The IMF conclude that:

China continues to transition to a more sustainable growth path and reforms have advanced across a wide domain. Growth slowed to 6.7 percent in 2016 and is projected to remain robust at 6.7 percent this year owing to the momentum from last year’s policy support, strengthening external demand, and progress in domestic reforms. Inflation rose to 2 percent in 2016 and is expected to remain stable at 2 percent in 2017. Important supervisory and regulatory action is being taken against financial sector risks, and corporate debt is growing more slowly, reflecting restructuring initiatives and overcapacity reduction.

Fiscal policy remained expansionary and credit growth remained strong in 2016. Growth momentum will likely decline over the course of the year reflecting recent regulatory measures which have tightened financial conditions and contributed to a declining credit impulse.

The current account surplus fell to 1.7 percent of GDP in 2016, driven by a sharp recovery in goods imports and continued strength in tourism outflows. It is projected to further narrow to 1.4 percent of GDP this year, due primarily to robust domestic demand and a deterioration in terms of trade. Capital outflows have moderated amid tighter enforcement of capital flow management measures and more stable exchange rate expectations. After depreciating 5 percent in real effective terms in 2016, the renminbi has depreciated some 2¾ percent since then and remains broadly in line with fundamentals.

Home Prices In Hong Kong Climb To Record Highs Even As Chinese Buyers Pull Back

From Zero Hedge.

Chinese banking regulators’ efforts to force the country’s largest conglomerates to deleverage after an unprecedented binge on foreign assets has already spurred a pullback in foreign real-estate investment, part of a broader decline in foreign investment more generally.

But with wealthy Chinese buyers suddenly out of the real-estate market, housing analysts are anticipating a wave of sharp declines in housing prices in some of the world’s most expensive markets like New York City, London and Hong Kong.

But during the first half of the year, real-estate prices in these markets have continued to climb. Even in Hong Kong, one of the most expensive markets, and also one of the first places one might expect the impact of a mainland pullback to be felt, prices have instead climbed to all-time highs, according to Bloomberg.

The Centaline Property’s Centa-City Leading Index of existing home prices surged to a record high 160.3 as of July 30. The index has climbed 11 percent this year, and more than 50% in the past five years.

Over the past five years, the rapid runup in home prices has caused densely populated Hong Kong to become the world’s most expensive housing market.

“Hong Kong’s housing affordability ratio, which measures the proportion of income spent on mortgages, worsened to about 67 percent for the quarter, the government said Friday, up from 56 percent in the year-earlier period.”

Reining in housing prices in the former British colony is a top priority of the HKMA – the city’s de facto central bank – and its incoming Chief Executive Carrie Lam. Home prices have been a major driver of inequality; for example, now takes a household earning the median income 18 years to afford a home, according to data from Demographia. Every housing auction is hopelessly oversubscribed.

Back in May, HKMA’s current Chief Executive Norman Chan warned about the bubble-like behavior in the city’s housing market, saying levels of demand were reminiscent of 20 years ago, just before Hong Kong suffered a property bust. Chan cautioned people with limited financial resources to stop speculating in property based on the expectation that prices would rise indefinitely.

With wealthy foreign buyers stepping away, there’s probably enough repressed demand in the local market to keep prices buoyant for now. The number of residential transactions surged 43 percent to 18,892 in the second quarter, helping to push prices higher.

Unfortunately for investors, without a supply of wealthy mainland buyers willing to pay the “Chinese premium,” prices will soon slide back to Earth.

China’s Cooling Housing Market Set to Weigh on Economy

China’s housing market is likely to continue to cool in response to stronger restrictions on home purchases across many cities and tighter credit conditions, say Fitch Ratings. Housing is the key cyclical sector in the Chinese economy, and will weigh on growth in the second half of the year and into 2018.

There is already evidence that the housing market is slowing. Growth in new residential property sales decelerated to 24.0% yoy (on a trailing 12-month basis) in May 2017, down for the fifth straight month from the 36.2% peak in December 2016. Price gains have also moderated. Secondary home prices in Tier 1 cities rose by 28.7% in 2016, but increased by just 3.6% in the first five months of 2017, and fell for the first time since September 2014 in May.

The downturn has been policy driven, with the authorities stepping in to prevent excessive froth in the market. Tightened rules on home purchases and mortgages are curbing buying by speculators and upgraders. Some first-time buyers might also be postponing purchases in the expectation that prices may fall. Meanwhile, the increased focus of the authorities on controlling leverage and limiting financial risks has led to a significant rise in money-market interest rates since last December, and some banks have recently increased mortgage rates.

The near-term outlook for China’s housing market is closely linked to the domestic credit cycle. As the chart below shows, housing sales move broadly in line with the “credit impulse” – or the change in the flow of new credit (including local government bonds) as a share of GDP. A weaker credit impulse, along with the tightening of home purchase restrictions, is likely to drag down home sales growth further in 2H17.

That said, the government will want to avoid causing significant volatility in the market. Home sales dropped by 9% yoy in early 2015, following the last tightening of restrictions, which contributed to a strong release of pent-up demand when policies were subsequently relaxed. We expect a more cautious approach this time, which is likely to result in home sales stalling, but not falling, in 2H17.

House prices are likely to decline slightly in 2H17, as demand weakens. We expect prices in Tier 1 cities to hold up better than in lower-tier cities. Prices in Tier 1 cities have risen by almost 90% in the last four years, compared with increases of 10%-25% in lower-tier cities. However, demand in Tier 1 cities remains strong and land supply is tight, which gives the authorities more scope to support the market if the downturn is sharper than expected. In lower-tier cites, demand is weaker and developers’ housing inventories are higher.

A likely weakening in the housing market is one of the main reasons behind our forecast that GDP growth will slow in 2H17. Investment in housing alone accounts for around 10% of GDP, and most estimates place its contribution to GDP much higher once supporting industries are included. There tends to be a six- to eight-month lag from sales to housing investment growth, which means that the economic impact of the housing market slowdown will continue well into 2018, when we expect GDP growth to slip slightly below 6%.

How much has China grown?

From the FRED Blog.

There’s some debate on how reliable the GDP growth rates from China are. In part, this worry comes from the pre-reform era in which all levels of production had to reach targets and may not have been entirely truthful. Also, the string of very high growth rates over the past two decades is unprecedented. Can FRED shed some light?

Well, it has seven different series that measure GDP in different ways. One is from the World Bank, one is from the OECD, and five are from the Penn World Tables. Differences pertain to how currency conversions are treated. For example, there’s the issue that exchange rates may drift away from so-called purchasing power parity (PPP) and which side of the GDP equation is used. Indeed, technically, there are three ways to measure GDP: add up all output, all expenditures, or all incomes. All three should get to the same number, but in practice there are some residual errors. So what does this graph show? These different measures essentially come to the same conclusions, the differences being relatively small and not systemically biased in one direction. However, these statistics are based on information that is coming out of China.

Tighter Property Regulations to Weigh on Hong Kong Banks

Fitch Ratings expects tighter regulations on property-related lending to have a material but manageable capital impact on Hong Kong banks.

The Hong Kong Monetary Authority has further tightened regulations on mortgages and bank lending to property developers that in turn extend mortgages outside the supervisory framework in an effort to cool the property market and strengthen the banks’ credit risk management.

We expect the growth in domestic residential mortgages, which accounted for 5.6% of system-wide assets at end-March 2017, to slow while direct lending to property developers (6.3%) may shrink.

Fitch estimates that increasing the risk weight on loans to property developers to 50% or 100% from an assumed 30%, coupled with an increase in the risk weight floor for residential mortgages to 25% from the current 15%, could reduce Fitch Core Capital ratios by at least 50 bp and up to 420 bp for banks that use the internal ratings-based approach.

The impact will be manageable as the new rules will be phased in and banks have maintained above-average capitalisation, supported by internal capital generation and one-off disposals.

Notwithstanding the above, Fitch revised the banking system outlook over the next 12 months to stable from negative on 11 May 2017 while the medium-term outlook for Hong Kong banks’ operating environment remains negative as the financial systems of Hong Kong and China continue their integration.

We expect short-term cyclical pressure on the banks’ financial performance to ease, based on positive signs in the domestic economy. Fitch expects annual GDP growth of around 2% in 2017 and 2018 for Hong Kong.

Are Banks In China In Trouble?

From Zero Hedge.

That’s not supposed to happen…

With the crackdown on financial system leverage underway, Chinese banks (and securities firms) are in big trouble. As we noted previously, China’s bond curve is inverted, yields are surging, and Chinese regulatory decisions shutting down various shadow-banking pipelines has crushed securities firms’ stocks. However, as Bloomberg points out, as China’s deleveraging efforts cut into banks’ profit margins, rising base funding costs and interbank credit risk concerns have pushed banks’ cost of borrowing beyond the rate they charge customers for loans for the first time in history.

As the chart above shows, the one-year Shanghai Interbank Offered Rate has exceeded the Loan Prime Rate, the first time this has happened since the latter was introduced in 2013.

“This is probably just the beginning” and interbank funding costs will rise further amid the drive to reduce leverage, said Xu Hanfei, chief fixed-income analyst at China Merchants Securities Co. in Shanghai.

How Tourism Affects China’s Current Account Surplus

From The St. Louis Fed Economic Synopsis.

China has been running a current account surplus since 2000, which has been a policy issue regarding exchange rates and currency manipulation. A current account surplus means that China has been a net lender to the rest of the world. China’s current account surplus reached 10 percent of gross domestic product (GDP) in 2007 and then started to decline until 2011, when it fell to 1.8 percent of GDP. The current account surplus has been stable since then, with a slight tendency to increase in more recent years. In particular, in 2015, the current account was around 3 percent of China’s GDP, but it has not returned to the high levels reached in 2007. What are the main factors behind the decline?

The current account is composed of three main categories: (i) the trade balance (net earnings on exports of goods and services minus payments on imports of goods and services); (ii) the net income to foreign factors (compensation of employees, investment income); (iii) and transfers.

In China’s case, the main component behind the current account trend is a decline in its trade surplus. A trade surplus indicates that China has been earning more on its exported goods and services than it has been paying for its imports (i.e., it has had positive net exports). As Figure 1 shows, net exports in China, as a percentage of GDP, closely track the current account and have been declining since 2007. Indeed, the trade surplus was around 9 percent of GDP in 2007 and fell to 3.5 percent of GDP in 2015. This decline has been driven by both a decline in the surplus of traded goods and an increase in the deficit of traded services (Figure 2). However, the goods surplus has picked up again since 2011, while the services deficit has become more pronounced. Interestingly, trade in services was roughly balanced between 2000 and 2007 and later became a deficit, reaching around –1.7 percent of GDP by 2015. Thus, even though the value of China’s exported goods has exceeded the costs of its imports, China has been importing more services than it has been exporting. Even more interesting is the fact that the increase in China’s services deficit has prevented its current account surplus from rising despite the increased trade surplus in goods.

Figure 3 shows the main categories of China’s international trade in services. One category stands out: travel services, which includes mainly tourism. China’s increasing services deficit has been driven mainly by overseas tourism- related consumption. According to a recent report, two population groups in China have been driving tourism: Millennials (young people 15 to 35 years of age) and a growing middle class. The report indicates two primary reasons for increased tourism by these two groups. On the one hand, young people travel for exposure to overseas experiences. On the other hand, Chinese travel for shopping, which accounted for 30 percent of overseas Chinese spending in 2015. The prime shopping destination currently is Hong Kong, but new destinations such as Japan, Korea, and Europe are expected to become increasingly popular.

Overall, the increasing trade deficit in services, spurred mainly by the rise in tourism, seems to be an important factor in the recent trend in China’s current account. As a result, the current account surplus is increasing only slightly despite a larger increase in net exported goods in recent years. What factors could change this trend? Fluctuations in exchange rates in the main destinations for Chinese tourists could affect tourism. For instance, a depreciation of the yuan could slow the increase in the travel services deficit while concurrently increasing the earnings in exports of goods—all of which could generate a larger current account surplus.

The Trump effect on bond markets and trade

From Investor Daily.

The Australian bond market is likely to feel the effects of US President Donald Trump’s protectionist trade stance both directly and indirectly, writes Nikko Asset Management’s James Alexander.

The emergence of China is clearly of great importance to the economic fortunes of Australia, and as a result it may be tempting to downplay, or even overlook, President Trump’s agenda and its impact on Australia.

While our largest import and export partner is now China, Australia will still be impacted by US trade policy both directly and, perhaps more importantly, indirectly.

The difficulty for investors, however, is the general uncertainty around future US trade policy, and the impact the Trump administration will have on financial markets.

Uncertainty around trade

While most of President Trump’s comments so far have been directed at China and Mexico, we do know that he is not a fan of trade deals negotiated by others.

Trade deals he has criticised in which Australia has been involved include the Trans-Pacific Partnership (TPP), from which the US has just withdrawn, and the North American Free Trade Agreement (NAFTA).

The essential message here is that these are bad deals for the US, as opposed to future Trump-negotiated deals, which will of course be good for the US.

It is likely to be some time before we can reasonably assess the impact of changes to US trade policy with Australia directly, given their larger trade relationships are most certainly ahead of us in the queue.

This brings us to the indirect but significant impact of the US’ future trade relations with our biggest trading partner, China.

A tit-for-tat trade war is likely to be harmful to both the US and China, with Australia most certainly suffering some collateral damage.

It is too early to tell how this relationship will unfold but the early signs are not great, with President Trump taking every opportunity to criticise China.

These two economic heavyweights have plenty of tools to ‘penalise’ each other on trade, which could potentially hurt Australian trade in the process.

Rising bond yields

The other broad area where the impact of a Trump presidency is likely to be felt is in financial markets – more specifically, bond yields and foreign exchange rates.

Australia’s bond yields have historically been strongly correlated with US Treasury yields and this is likely to continue.

If the Trump agenda of lower taxes, increased infrastructure spending and more protectionist trade policy prove to be inflationary as we expect, US interest rates and bond yields are likely to be headed higher.

Australian bond yields will surely follow, as Commonwealth bond yields must remain globally competitive to ensure international investors continue to support our borrowing needs.

Another widely discussed by-product of Trump’s agenda is a stronger US dollar.

While the Australian dollar has fallen by around 2.5 per cent against the American currency, it has actually risen slightly on a trade-weighted basis since the presidential election in November.

This divergence, should it continue, will be one to watch carefully.

While a weaker Australian dollar would indeed help to counter any negative impact from higher bond yields, weakness that is mainly isolated to the US dollar is not nearly as helpful as weakness on a trade-weighted basis.

James Alexander is the co-head of global fixed income and head of Australian fixed income at Nikko Asset Management.

China injects $1 billion of “suspicious” funds into Australian property

From Australian Broker.

The Australian Transaction Reports and Analysis Centre (AUSTRAC) has reported that in 2015-16, around $1 billion in funds related to property and real estate were transferred between China and Australia.

Typically, AUSTRAC is notified of these matters via suspicious matter reports (SMRs) which are submitted by banks, money remitters and other financial institutions.

Suspicion may be warranted – and a report sent to AUSTRAC – in a number of circumstances including if a bank or institution thinks a person is not who they claim to be, the information given relates to evading tax law or aiding criminal activity, or there is a chance of money laundering or terrorist funding.

John Moss, AUSTRAC’s national manager of intelligence, told Australian Broker that these SMRs indicate a total of $3.36 billion of funds was sent between China and Australia in the stated time period.

“AUSTRAC data shows that the overall total amount of fund flows between Australia and China during 2015-16 was $76.7 billion,” Moss said.

The agency was constantly vigilant to identify increases in the number of suspicious transactions from a number of countries, including China, he added.

“We’re confident that the agency’s approach with our Chinese counterparts through a recently signed Memorandum of Understanding, as well as close collaboration with Australian law enforcement and other partner agencies – such as the ATO, ACIC and FIRB – is providing an effective response to protect the Australian community from such financial crime.”