Auction Clearance Rates Still Holding Up – CoreLogic RP Data

The latest from Corelogic RP Data indicates that auction clearance rates are still holding up pretty well. So far this week, 2,127 capital city auction results have been reported to CoreLogic RP Data, resulting in a preliminary auction clearance rate of 72.1 per cent across the combined capital cities. There were a total of 2,615 capital city auctions held this week. This week’s result indicates that clearance rates are no longer tracking higher than they were one year ago, when the final auction clearance rate over the
week was 72.3 per cent across 2,080 auctions. Over the previous week there were 2,297 auctions with a clearance rate of 73.2 per cent. Whilst Sydney and Melbourne were well above 70%, Adelaide, Perth and Canberra were lower.

RP-Auctions-Sep15-2015
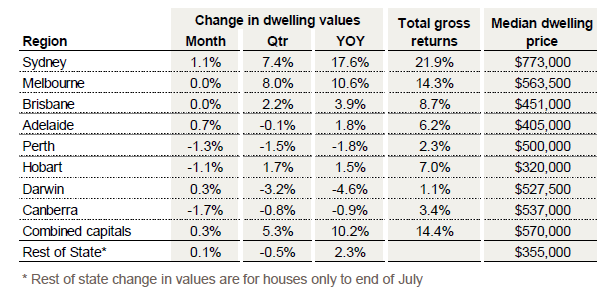
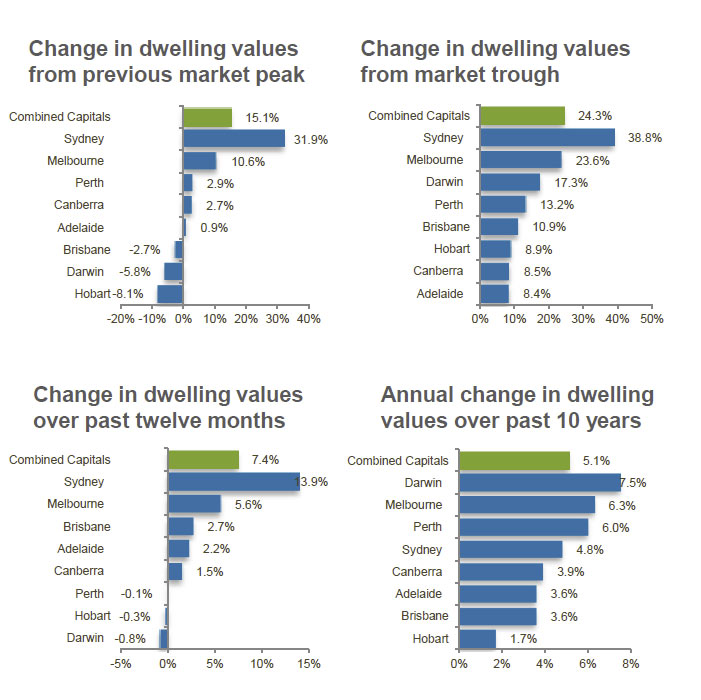
Whilst the combined average house price was up 10.9% in the past 12 months, mortgage application activity appears to be a little lower now.

Capital Gains Up, But Rental Yields Down – CoreLogic RP Data

According to the CoreLogic RP Data August 2015 Home Value Index, capital city dwelling values continued to rise over the month whilst growth in weekly rental rates shifted to a new record low for annual growth over the month of August.

2015-09-01-indices-tableThe headline results show that dwelling values were 0.3 per cent higher over the month across the eight capital city index. The highest month-on-month movement was in Sydney, where dwelling values were 1.1 per cent higher, while dwelling values also moved higher across Adelaide (0.7 per cent) and Darwin (0.3 per cent), and were flat over the month in Melbourne and Brisbane. The remaining capital cities recorded a month-on month fall in dwelling values.

While the August results indicate a slowdown in the rate of appreciation in dwelling values, the quarterly figures highlight just how strong the housing market has been over the past three months; combined capital city dwelling values are 5.3 per cent higher over the three months to the end of August this year.

Sydney dwelling values are 17.6 per cent higher over the past year, and since the beginning of 2009, Australia’s largest capital city housing market has recorded a cumulative capital gain of 76 per cent. Using the median house price from January 2009 as a base, the typical Sydney home owner has seen the value of their home increase by approximately $309,000 since the beginning of 2009.

The only cities where dwelling values declined over the past twelve months have been Darwin (-4.6 per cent), Perth (-1.8 per cent) and Canberra (-0.9%).

Growth in weekly rental rates shifted to a new record low for annual growth over the month of August. Across the combined capital cities, the median weekly rental rate rose
by just 0.7 per cent over the past twelve months, with house rents up 0.5 per cent and unit rents up a higher 1.6 per cent.

Since May 2013, dwelling values have risen at a faster pace than weekly rents. “The result of the disparity between dwelling values and dwelling rents has been a consistent downwards trend in gross rental yields.

Gross yields are at record lows in both Sydney and Melbourne. A typical dwelling is attracting a gross yield of just 3.3 per cent and 3.1 per cent respectively across Australia’s two largest cities. Mr Lawless said that the low yield scenario has largely been overlooked by investors who appear to be more focused on chasing future anticipated capital gains rather than aiming for cash flow.

Land Supply Shortages are Shutting Out Home Buyers – HIA

The HIA-CoreLogic RP Data Residential Land Report to the March 2015 quarter shows price growth accelerating as turnover falls sharply. The residential land price in Australia increased by 4.1 per cent compared with the previous quarter whilst residential land transactions fell by 5.2 per cent compared with the previous quarter. Higher land prices translate to more expensive housing, and is pricing new home buyers out of the housing market as well as capping the construction cycle.

“This is not a good combination – escalating residential land values and a related decline in sales volumes,” said HIA Chief Economist, Harley Dale. “The upcycle in detached and low density housing construction has been strong, without being stellar. The combination of significantly reduced turnover and strong price growth suggests that supply bottlenecks in residential land are intensifying. That is pricing new home buyers out of the housing market and capping the construction cycle at a lower level than would otherwise be the case.”

“The provision of adequate, affordable, shovel-ready land is a crucial element to addressing housing affordability pressures across the residential property market,” said Harley Dale. “More needs to be done to expedite supply in 2015/16. Removing the obstacles to affordable land supply is a core requirement of a successful taxation and federalism white paper reform process.”

During the March 2015 quarter, the residential land price in Australia increased by 4.1 per cent compared with the previous quarter. This represented an increase of 8.2 per cent compared to the same quarter of last year.  to be 17.6 per cent lower than the same period 12 months earlier. The March 2015 quarter represents the third consecutive decline in land transactions in Australia.

According to CoreLogic RP Data research director, Tim Lawless, the trend towards fewer land sales has been evident since mid-2013 and is visible across each of the capital city vacant land markets. “The number of vacant land sales peaked over the June 2013 quarter and have since reduced by almost 30 per cent. To see the price of land consistently rising over the same time frame suggests low supply is the main driver of this price growth rather than a slowdown in demand.”

“Higher land prices translate to more expensive housing which is an unfortunate circumstance for those looking to purchase a detached house. Sydney stands out as the most expensive land market with a rate per square metre of $678, followed closely by Perth with a rate per square metre of $664.”

A Typical Capital City Home Increased in Value by About $50,000 Last Financial Year – CoreLogic RP Data

CoreLogic RP Data data for June confirms the housing market remained strong.  In addition, Based on the current median dwelling price of $565,000, the 9.8% increase means the typical capital city home has increased in value by about $50,000 over the year. At 9.8% the rate of growth across the 2014-15 financial year, was virtually on par with the previous year where dwelling values were 10.1% higher. In June:

Home values increased across most capital cities and the combined capital cities in June 2015

  • Home values increased by 2.1% across the combined capital cities in June 2015 and rose across all cities except for Perth and Darwin.
  • Home values have increased by 2.0% over the three months to June 2015 with values lower in Perth and Darwin.
  • On an annual basis, combined capital city home values have increased by 9.8% which is their fastest annual rate of growth since August 2014.
  • The value growth performance has been extremely varied over the past year. Sydney (16.2%) has been much stronger than other capital cities while Melbourne (10.2%) has recorded moderate growth while increases have been minimal in Brisbane (3.4%), Adelaide (4.5%), Hobart (0.9%) and Canberra (2.4%). Home values have fallen over the past year in Perth (-0.9%) and Darwin (-2.9%).
  • The annual home value growth in Sydney and Melbourne is now at its fastest pace since August of last year.

Sales activity across the country is slightly lower than at the same time last year

  • Over the 12 months to March 2015 there were 357,972 houses and 140,246 units sold across the country.
  • House sales are 2.1% higher over the year compared to a -8.0% fall in unit sales.
  • It should be noted that off-the-plan sales aren’t counted until they settle so we would expect the unit figure to be revised much higher over the coming months and years.

 Vendor metrics indicate strong housing market conditions

  • Auction volumes have surged since the RBA cut interest rate in February and again in May clearance rates have also recorded a sharp rise but have eased slightly from their recent record high levels.
  • Discounting levels remain low while time on market is also at a near record low, in fact Sydney’s time on market is equal to its record low and in Melbourne homes are selling at their fastest rate on record.

 The amount of homes for sale is much lower than at the same time last year

  • New listings are 11.3% higher than a year ago nationally and 5.5% higher across the capital cities.
  • Nationally, total listings are -3.9% lower than a year ago and total listings are -6.5% lower.
  • Sydney has less stock listed for sale (16,614) than each of Melbourne (26,225), Brisbane (18,260) and Perth (20,198).
  • The total number of listings in Sydney is -19.1% lower than at the same time last year.

 Mortgage demand has rebounded strongly following the Christmas / New Year period

  • The RP Data Mortgage Index (RMI) shows that mortgage demand eased a little in June 2015.
  • ABS housing finance data to April shows the market growth continues to be driven by investors and owner occupier refinances.
  • Housing credit data shows that over the past year investor housing credit has increased by 10.4% which is in excess of the cap targeted by APRA.

Capital city dwelling values 9.8% higher over the financial year – CoreLogic RP Data

Based on the CoreLogic RP Data June home value results capital city dwelling values finished the 2014/15 financial year on a strong footing, with dwelling values rising 2.0 per cent over the June quarter and 9.8 per cent higher over the year. The rate of capital gain was slightly higher over the second half of the year (5.1 per cent) compared with the first half (4.5 per cent) highlighting that the housing market has gathered some momentum during 2015. The previous 2013/14 financial year recorded a slightly higher rate of growth at 10.1 per cent.

Since dwelling values started rising in May 2012, Sydney dwellings have seen a 43.1 per cent surge in values and Melbourne values are up by 25.9 per cent. Despite softer market conditions in Perth, dwelling values are currently up 12.8 per cent over the cycle which represents the third highest growth rate across the capitals. Simultaneously, Brisbane’s property market has shown the fourth highest rate of growth at 12.4 per cent, followed by Adelaide (10.4 per cent), Hobart (9.6 per cent), Darwin (8.9 per cent) and Canberra (8.8 per cent).

Looking at the performance of detached housing versus apartments over the financial year, houses are clearly outperforming units in the capital gains stakes. Over the financial year, house values were 10.4 per cent higher across the combined capitals index while unit values increased by a much lower 5.6 per cent. The same trend where houses are showing a higher capital gain than units is evident across each of the capital cities except Hobart and Darwin.

Today’s results confirm a scenario where detached housing outperforming apartments is most evident in Melbourne. Based on the results, Melbourne house values have shown a very strong 11.2 per cent capital gain over the financial year while apartment values are up by only 2.4 per cent.

Gross rental yields drifted another notch lower in June due to dwelling values rising at a faster pace than weekly rents. Currently, the typical gross yield for a capital city house is recorded at 3.5 per cent, which is equivalent to the record low last recorded in 2007. The average gross yield on a capital city unit also fell over the month to reach 4.4 per cent; the lowest gross apartment yield since 2010 and not far off the all-time low of 4.3 per cent recorded in 2007.

Rental Yields Fall – CoreLogic RP Data

According to analysis from CoreLogic RP Data, rental rates across the combined capital cities increased by 0.1% in April and continue to rise at their slowest annual pace in more than a decade. While rental rates tell part of the story, it is also important to consider rental yields. Rental yields for houses and units are sitting at their lowest level since late 2010. There is a reason for the disconnect between rising house prices and rents. That is simply because rents are more directly linked to average incomes than home values. As we reported recently, income growth is slowing.

Across the combined capital cities, gross rental yields are recorded at 3.6% for houses and 4.5% for units. At the same time in 2014, gross rental yields were recorded at 3.8% for houses and 4.6% for units. Across the individual capital cities, house rental yields are lowest in Melbourne (3.2%) and Sydney (3.4%) and highest in Darwin (5.7%) and Hobart (5.2%). RPDataRentalsApril2015Across most cities house rental yields are lower now than they were at the same time last year, the exceptions are Brisbane, Adelaide and Hobart where they are unchanged. At 3.4%, rental yields in Sydney are the lowest they’ve been since May 2005 and at 3.2 per cent Melbourne yields are at their lowest level since November 2010. The unit market shows different trends to the detached housing market with yields higher or unchanged over the year across most cities. Unit yields are lowest in Melbourne (4.2%) and Sydney (4.3%) and highest in Darwin (5.9%) and Brisbane (5.4%). Unit yields in Sydney are at their lowest level since August 2005 while yields in Melbourne have edged higher over the past month.

RPDataYieldsApril2015Across the combined capital cities, rental rates are recorded at $487 per week and they have risen by 0.1% over the month, 0.7% over the past three months and by 1.7% over the past 12 months. Although rental rates are still increasing, they are doing so at a moderate rate. In fact, the annual rate of growth has been recorded at 1.7% for four consecutive months and hasn’t previously been this low since June 2003. The slow pace of rental appreciation can likely be attributed to the booming level of dwelling construction coupled with high levels of buying activity from the investment segment which is adding additional rental stock to the market and curtailing rental increases. Looking across the capital cities, over the past year Sydney and Hobart have recorded the greatest increases in weekly rents. Rents have fallen over the past three months in Perth and Darwin; along with Canberra these cities have recorded rental falls over the year, down -4.2%, -4.7% and -2.6% respectively.

Looking at the performance of houses as opposed to units there isn’t a great deal of difference in the rates of rental appreciation. House rents were recorded at $492 per week across the combined capital cities in April 2015 compared to $461 per week for units. House rents have recorded stronger growth over the month (0.1%) compared to unit rents which fell by -0.1%. Over the quarter unit rental growth (0.6%) has been lower than houses (0.7%) however, over the past year units have recorded slightly stronger rental growth (1.9%) than houses (1.6%).
Comparing the current rate of rental growth with the 10 year average annual rate of rental appreciation highlights that rental growth is currently sluggish across all cities. In fact, the ten year average annual rate of rental growth is higher than the current growth rate in each capital city. The slower pace of rental growth may be attributed to a number of factors including: a ramp-up in investment purchases resulting in an increase in rental stock, an increase in housing supply which has also added to rental stock and a reduction in net overseas migration decreasing demand for rental stock.

Rental rates are already increasing at their slowest annual rate in more than a decade and the outlook is that a low rate of growth will continue. In fact, with residential construction activity continuing to increase, particularly for inner city units, we would expect that the additional housing supply may result in an even lower rate of rental growth over the coming months. This is likely to be most evident in the markets where new unit supply is surging, being Melbourne and Brisbane and to a lesser extent Sydney.

Australian Mortgage Holders Sensitive to Interest Rate Movements – CoreLogic RP Data

An article by Cameron Kusher, CoreLogic RP Data senior research analyst highlights that according to data from the Reserve Bank the ratio of household debt to disposable income is 153.8% and the ratio of housing deb to disposable income is 140.3% both of which are record highs.

Each quarter the Reserve Bank (RBA) publishes selected household finance ratios which show some key statistics about the level of debt held by Australian households. Although Australia has relatively low levels of public debt, private debt is extremely high and unlike many other countries there hasn’t been a decline in that debt in the aftermath of the financial crisis.

The latest household finances data from the RBA shows that in December 2014, the ratio of household debt to disposable income was 153.8%, its highest level on record. Housing debt accounts for 91% of total household debt and is recorded at a record high ratio of 140.3%. The chart shows that the level of debt has been relatively unchanged since 2005 but is now heading higher.

Focussing on the housing component of this debt, of the 140.3% ratio, 92.2% of that figure was owner occupier housing and 48.0% was investor housing. Once again, both are currently at record high levels. As with total housing debt, both had been relatively unchanged over recent years but have lifted over the past couple of years. It is important to note that the gap between owner occupier debt and investor debt is at near record high levels too.

Although household debt is high, the value of household assets is much higher than the debt. According to the data from the RBA the ratio of household assets to disposable income is 813.8%, much higher than the ratio of household debt at 153.8%. From the housing perspective, the ratio of housing assets to disposable income is recorded at 444.0% compared to a ratio of 140.3% for housing debt to household income. The chart shows that the ratio for both household and housing assets had been higher before the financial crisis however, both are now clearly trending higher again.

The data also shows that the ratio of household debt to household assets is 16.7% while the ratio of housing debt to housing assets is 28%. This highlights that although household and housing debts are high, the value of those assets is substantially higher than the level of debt. While this may be true at a national level it doesn’t mean that everyone is immune from the effects of an economic and/or housing market downturn.

Although these figures would provide some comfort that most households have the ability to sell assets to repay debt if they hit trouble, it is important to remember that it is a national view. There are areas of the country where households are much more susceptible to housing and economic downturns. Some specific areas and household types are recent first home purchasers, areas where there has been very little home value growth in recent years, single industry townships and areas where households have re-drawn a large proportion of their home’s equity.

With regards to the recent increases in household and housing debt, obviously very low interest rates (which have just got lower) are encouraging increased borrowing, particularly for housing. On the other hand, saving is not attractive because there is virtually no returns available. While most households can comfortably meet their mortgage requirements with mortgage rates at these levels, it is important to remember that a mortgage is usually a 25 to 30 year commitment and mortgage rates can fluctuate significantly over that time. The fact that household debt levels merely flat-lined rather than reduced following the financial crisis creates some concerns about what will happen once mortgage rates start to normalise (whenever that may be). Furthermore, the rate cut delivered this week may encourage even further leveraging into the housing market.

These are of course average figures across all household. However, as we have shown already, if you segment the household base, you discover that household debt is concentrated in different segments. Some are well able to cover the debts they owe, even if rates were to rise, but others are, even in the current low rate environment close to the edge, and with incomes static, vulnerable even to small rises in interest rate.

Home Prices Higher In April – CoreLogic RP Data

CoreLogic RP Data April Home Value Index results confirmed that values across Australia’s combined capital cities increased by 0.8 per cent in April 2015, down from a 1.4 per cent month on month increase in March. Overall dwelling values shifted higher over the past month across every capital city except Canberra where values showed a 1.5 per cent drop over the month.

According to the April Home Value results, capital city dwelling values have been trending higher over the past 35 months, recording a cumulative increase of 25.3 per cent between the end of May 2012 and April 2015. While the combined capitals trend of dwelling value growth has been substantial, the rate of growth across the Sydney housing market stands head and shoulders above the other capital cities over the cycle to date. Sydney dwelling values are now 40.2 per cent higher relative to the May 2012 trough. If you factor in the previous 2009/10 phase of growth, Sydney values are now up 65.4 per cent post GFC. Melbourne is the only other capital city that comes close to this measure where dwelling values are 52.3 per cent higher post GFC. The next highest rate of growth is Darwin where values have moved 26.5 per cent higher, followed by Canberra (19.8%), Perth (15.2%), Adelaide (12.2%), Brisbane (8.0%) and Hobart (1.2%). The rate of growth in Perth and Darwin has slowed substantially in line with the wind down of major infrastructure projects associated with the resources sector and the housing market in Canberra has also softened post federal election.

RPDataIndexMay2015The performance of houses versus apartments has shown some interesting trends of late. Detached homes are continuing to outperform the multi-unit sector, with capital city house values up 8.3 per cent over the past year while unit values have risen by a lower 5.6 per cent. This trend is more noticeable in the key growth markets of Sydney and Melbourne. Sydney house values are up 15.5 per cent over the past year while unit values have risen by 9.7 per cent. The over-performance of houses compared with units is more apparent in Melbourne where house values are 7.6 per cent higher over the year compared with a growth rate of just 1.9 per cent across the unit market. A similar trend is evident across most of the capital cities and can likely be attributed to the higher supply levels in the apartment markets which are keeping a lid on the rate of capital gain.

Most other housing market indicators remain strong. Auction clearance rates have surged to new record highs after the February rate cut and have trended slightly higher over the final two weeks of April. Additionally, the number of homes being advertised for sale has been trending lower, particularly in Sydney where listing numbers are now lower than the number of properties being advertised for sale in Melbourne, Brisbane and Perth. The short supply of advertised homes in Sydney is likely to be one of the key factors driving local dwelling values higher, with buyers pressured to make a purchase decision quickly with minimal negotiation on asking prices due to few alternative housing options available for sale.

The performance of the housing market is increasingly varied across the capital cities. Sydney is continuing to dominate the headlines with such a high rate of capital gain, while Melbourne is also showing a solid performance. At the other end of the spectrum, Perth, Darwin, Hobart and Canberra are showing weaker results while Brisbane and Adelaide and are roughly keeping pace with inflation. In fact, outside of Sydney and Melbourne, the next highest rate of annual capital gain can be found in Brisbane where dwelling values are up a comparatively paltry 2.2 per cent.

Land Prices Driven Higher – HIA-CoreLogic RP Data

The latest HIA-CoreLogic RP Data Residential Land Report provided by the Housing Industry Association, and CoreLogic RP Data, signals disequilibrium between demand and available supply in vacant residential land.

Whilst the number of residential land sales fell by 11.8 per cent over the year to the December 2014 quarter, the weighted median residential land value increased by 2.8 per cent in the December 2014 quarter to be up by 6.3 per cent over the year. The increase in the weighted median value was driven primarily by Sydney, with significant growth also evident for Perth and Melbourne.

As with all aspects of this housing cycle, there are wide divergences in land market conditions around the country – this is clearly evident across the six capital cities and 41 regional areas covered in the Residential Land Report. Construction of detached houses looks to be peaking for the cycle, but there is unrealised demand out there because of that lack of readily available and affordable land.

The price of residential land per square metre increased in Sydney, Melbourne and Perth in the December 2014 quarter, with Sydney remaining the country’s most expensive land market by some margin. Across regional Australia, the most expensive residential land markets are the Gold Coast and the Sunshine Coast in Queensland, and the Richmond-Tweed region in New South Wales. The least expensive markets can be found in the South East region of South Australia, and the Mersey-Lyell and Southern regions of Tasmania.

LandSupplyApr2015

Sydney Dwelling Values Surged 3% Higher in March – CoreLogic RP Data

Home values across the combined capital cities increased by 1.4 per cent in March 2015 according to the CoreLogic RP Data Home Value Index, driven by an exceptionally strong Sydney result where dwelling values were 3.0 per cent higher over the month. The latest indices reading shows capital city dwelling values moved 3.0 per cent higher over the first quarter of the year. CoreLogic RP Data head of research Tim Lawless said, “although value growth has started 2015 on a strong note, the annual rate of growth has moderated back to 7.4 per cent, which is
the slowest annual growth rate since September 2013.”

Sydney remains the standout capital growth performer, with values rising by 3.0 per cent over the month, 5.8 per cent over the quarter and 13.9 per cent over the year. With stronger housing market conditions over the first three months of the year, annual home value growth across the Sydney market has rebounded after slowing to 12.4 per cent in December 2014. Sydney is the only housing market where dwelling value growth remains in double digits, with the next strongest performer, Melbourne, showing a much lower rate of annual capital gain at just 5.6 per cent.

RPDataFeb2015Each of the remaining capital cities have recorded an annual rate of growth which is less than three per cent, with values having declined across Perth, Darwin and Hobart over the year. Since home values began their current growth phase in June 2012, dwelling values across the combined capital cities have increased by 24.3 per cent. “Most of this growth is emanating from Sydney,” Mr Lawless said. “Over the current growth phase, Sydney dwelling values have increased by 38.8 per cent with Melbourne second strongest at 23.6 per cent. On the other hand, total dwelling value growth over the current cycle has been less than 10 per cent in Adelaide, Hobart and Canberra. “Combined capital city home values have increased by 3.0 per cent over the first quarter of 2015. While that rate of growth is strong it is important to note that it is lower than the 3.5 per cent increase in home values over the first quarter of 2014,” he said.

Based on the March results, Sydney’s growth trend appears to have disengaged from the rest of the capital city housing markets in terms of demand and subsequently in terms of value growth. The 5.8 per cent growth in Sydney dwelling values over the first quarter is the strongest quarterly growth rate since home values increased by 6.2 per cent over the three months to April 2009. The strength of the Sydney housing market currently is further highlighted by the fact that since the Reserve Bank cut official interest rates to 2.25 per cent at the beginning of February, auction clearance rates have been above 80 per cent each week.