Capital City Home Prices Higher In Sept Quarter

The latest CoreLogic Hedonic Home Value Index reveals further gains across most capital city housing markets last month, taking the current growth phase into its 52nd month. Read here for discussion about the accuracy of the data, as RBA expressed concerns.

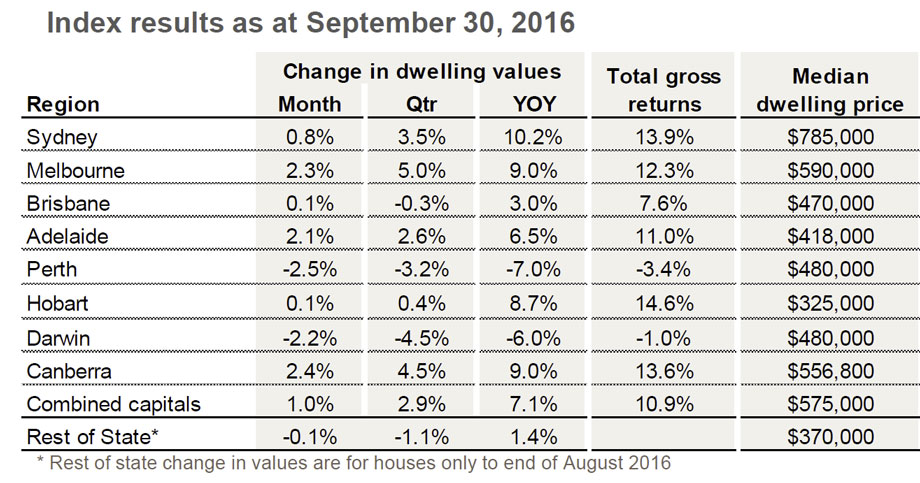
Capital city dwelling values continued to show a strong headline rate of growth over the September quarter, with the CoreLogic Hedonic Home Value Index rising 2.9% over the past three months. The combined capital city index, which is heavily weighted towards the Sydney and Melbourne markets, recorded a 1.0% month-on-month gain, taking capital city dwelling values 41.3% higher since the growth cycle commenced in June 2012.

corelogic-oct-3rd

Growth conditions were substantially different from region-to-region. The top performing market was Melbourne where dwelling values pushed 5.0% higher over the third calendar quarter, due largely to a strong rise in house values (+5.2%) which balanced a softer result for the unit market (+2.9%). Canberra showed the second highest rate of growth over the quarter with values up 4.5%, followed by Sydney at 3.5%.

In contrast, the weakest housing market over the quarter was Darwin where dwelling values declined by 4.5%, to be 11.1% lower than the most recent 2014 peak in property values and 13.9% lower than the previous 2010 peak in dwelling values. Perth dwelling values also slipped 3.2% lower over the quarter to take the cumulative decline in values to 10.4% since their December 2014 peak, and 5.2% below the previous peak in 2010. Brisbane dwelling values also slipped lower over the quarter falling by a marginal 0.3%, attributable mostly to larger declines across the unit sector.

The Patchwork Quilt Of Property Losses and Gains

The latest pain and gain report from CoreLogic, highlights the diversity in property outcomes across the country.

sept-pain-and-gainThe Pain and Gain Report is a quarterly analysis of residential properties which were resold over the quarter. It compares the most recent sale price to the previous sale price in order to determine whether the property sold at a gross profit or gross loss. It provides a proxy for the performance of each housing market and highlights the magnitude of profit or loss the typical seller of a home makes across those regions analysed.

Over the June 2016 quarter, 9.5% of all dwellings resold recorded a gross loss when compared to their previous purchase price. This figure was higher than the 9.3% at the end of the first quarter this year and the highest proportion recorded since March 2014. Across those dwellings which resold at a loss over the quarter, the total value of loss was $459 million with an average loss of $73,009.

Given less than 10% of homes resold at a loss over the quarter, more than 9 out of every 10 homes resold for more than their previous purchase price. Across these sales, the total profit was recorded at $15.7 billion and an average profit of $262,550 per resale. Also important to note is that over the quarter, 29.4% of resold homes transacted for more than double their previous purchase price.

The data also highlights the fact that ownership of property, whether for investment or owner occupier purposes, should be seen as a long-term investment. Across the country, those homes that resold at a loss had an average length of ownership of 6.3 years. Across all sales recording a gross profit the average length of ownership was recorded at 10.3 years, while homes which sold for more than double their previous purchase price were owned for an average of 17.7 years.

The capital city housing markets continue to record a lower proportion of loss-making resales than regional areas of the country. The trends in regional areas are shifting with the proportion of loss-making resales trending lower in most areas linked to tourism and lifestyle. On the other hand, housing markets linked to the resources sector are generally seeing an elevated level of loss-making resales after housing market conditions in many of these locations have posted a sharp correction.

Another Strong Auction Result

From CoreLogic.

Confirming the APM result we reported on Saturday, the preliminary clearance rate remains above 70 per cent for the ninth consecutive week, edging close to 80 per cent.

It has been another strong week for auction activity, there were 2,445 auctions held across the combined capital cities with a preliminary auction clearance rate of 78.3 per cent this week.  Last week, the final auction clearance rate was recorded at 76.2 per cent with 2,149 residential properties taken to auction. At the same time last year, auction volumes were higher (2,835) with a clearance rate of 69.7 per cent. Over the first four weeks of Spring, auction clearance rates have consistently been recorded at a higher rate than over the corresponding weeks last year, while auction volumes remain around 20 per cent lower.

20160926-capital-city

How Best To Measure House Prices

Recently the RBA has been talking about house price metrics, and in their recent outings have been downplaying data from CoreLogic preferring metrics from other sources. Was this a case of selecting the data which best fits with your world view? As we said at the time:

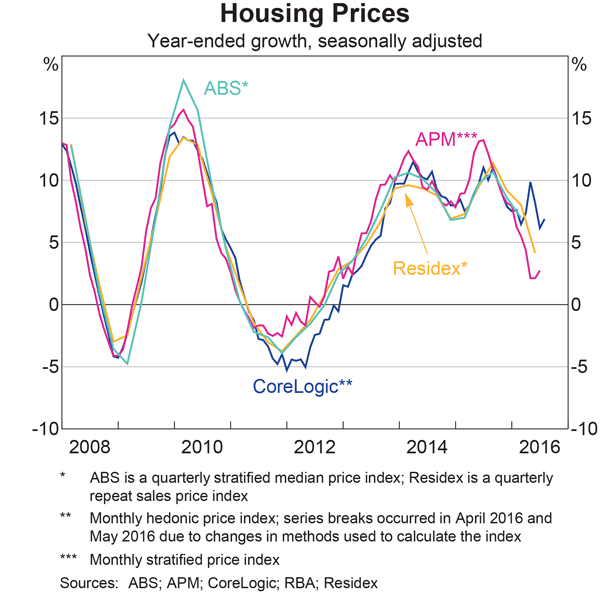
The statistical “fog of war” appears to have descended on Australian home prices, partly fueled by the RBA’s recent statements, and the latest chart pack data. Because of perceived issues with the CoreLogic data series, we see plots from a number of data providers.

housing-pricesToday Tim Lawless from CoreLogic has discussed the issue of metrics in “A refresher on housing market measurements“.  Naturally he defends CoreLogic’s work, but it is also worth reading to see how complex the question actually is. We think the trend is the important perspective. But of course the picture is complicated when metrics are rebaselined without full disclosure.

Housing is Australia’s largest asset class, worth an estimated $6.7 trillion, so it’s important to measure the performance of this very important asset class in an accurate and timely manner. Recently there has been a lot more focus on the measurements of housing market performance, so it’s timely to provide a summary of the primary methods used for measuring housing market performance from a value/pricing perspective.

The complexities of property data

Before we go into the different measures, it’s worthwhile providing a brief refresher on property data which provides some background about why measuring housing market performance is a complex undertaking.

Firstly, compared with the equites markets, housing is an illiquid asset class. Individual properties are transacted, on average, every 8-10 years. The infrequency of transactions implies that the vast majority of residential properties are excluded from most housing market measurements which are reliant on transactional activity.

Secondly, housing is fundamentally nonhomogeneous; dwellings are unique in their characteristics based on their location and attributes, which makes the measurement of price and value shifts more challenging.

Additionally, the quality and timeliness of property data varies remarkably from state to state and between the private sector data providers. State governments collect a base level set of data which needs to be cleaned and augmented with more timely data and additional data sets such as attribute information to ensure a more complete and timely measure of housing markets is derived.

Regardless of the methodology used to measure dwelling price or value shifts, having housing data that is of the highest quality possible is the first and most important step in producing a reliable and accurate measure of the housing market.

CoreLogic collects and maintains the most comprehensive and current property and mortgage database, with more than 4.2 billion decision points across Australia and New Zealand that is growing in size every day. More than 60% of housing market transactions are collected directly from the industry, which provides a much more timely view of the housing market than relying solely on government provided transaction data.

What indicators are available to measure housing market conditions?

Housing market indices range in complexity from a simple median price indicators, which is subject to large amounts of bias and revision, through to a stratified median, repeat sales index and hedonic regression models. Each of these methods will provide different results for measuring price or value shifts across the housing markets.

Outside of these methodological differences, there will be further differences in results based on the data held by each of the private and public sector index providers as well as the way the data is cleaned, the sampling method, what geographic regions are being reported and what time frames the measures are reported across.

Simple median price

The median is simply the middle sales observation across a series of transactions. The median sale price is subject to a range of biases which can skew the middle observation up or down. Bias in median price can be caused by buyer types who are more active or less active in the market (for example, if first home buyers become more active there is likely to be a downwards bias in the median observation due to more transactions occurring at the affordable end of the pricing spectrum). Bias can also be found if there are changes in the types or quality of stock transacting and the median can be very volatile in markets with low turnover or where there are dramatic differences in the quality of housing. The advantage of median price is that it is very simple to compute and is easy to understand and interpret.

Simple median price measures are generally utilised by some of the real estate institutes and are still a common way of reporting price movements at the suburb or postcode level. Simple medians are useful for understanding what the middle observation for pricing is across a particular region over a specified point in time, however they aren’t all that useful for measuring capital gains over time due to the volatility and bias associated with this measure.

Stratified median

The stratified median measure, although still a measure of the middle observation, attempts to overcome the compositional bias of median price measures by dividing the market into separate strata’s, or segments, that are more alike. The Australian Bureau of Statistics, who use a stratified median measure, bases their stratification across dwelling types, the long term median price and socio economic indicators as specified here: . The ABS index is released quarterly after a significant lag and is non-revising.

Domain also use a stratified median approach, however no documentation appears to be publically available on their method or stratification approach. The Domain index is revisionary, however there is no transparency around the level of revision between quarters. Also, Domain do not appear to release their index results in a freely available format online.

The stratified median approach is a substantial improvement over the simple median for measuring price change across the housing market. As outlined in the simple median method, despite attempts to control for bias, the stratified median approach can be affected by changes in buyer activity or inactivity and by changes in the types or quality of dwellings that are transacting in the market.

It is important to note that non revising stratified median indices will not include off the plan sales data if the sale date has occurred more than three months prior to the reporting date. The reason for this is that such data tend to be quite lagged and reported by the Valuer General after settlement, which can occur several years after the sale date.

Repeat sales

A repeat sales index relies on identifying sales pairs and measuring the capital gain across these individual resales. The repeat sales method is very useful for measuring the demonstrated capital gain across individual properties that have resold, however the method excludes all transactions that don’t have a previous sale associated with the property. Inherently, the repeat sales method excludes new properties, which is a significant weakness at a time when a record amount of new housing stock is entering the market place. Additionally, the repeat sales index can be biased by property resales that have been affected by capital works (eg renovations and subdivisions) and can also be biased by properties that are transacted more frequently such as units and investment owned properties which generally have a higher turnover rate.

Residex (which is a CoreLogic owned company) publish a repeat sales index which is revisionary and released quarterly.

Off the plan sales are not accounted for in repeat sales indices as this methodology requires at least two sales for a property to make it eligible for inclusion.

Hedonic regression

The hedonic method of measuring housing market performance aims to track the true value shifts across the overall portfolio of housing, rather than price based movements based on observations of only those properties that have transacted. The hedonic imputation technique, which is used exclusively in Australia by CoreLogic, imputes the value of every Australian dwelling each day, taking into consideration every single data point we knew about the housing market at the point in time of calculation. Factors such as lot size, the number of bedrooms and bathrooms, car spaces and whether the home has a swimming pool or view are some of the hedonic attributes factored into the analysis. Based on a flow of around 1,400 new transactions received each day as well as a constant flow of new attribute data, our most accurate view of the imputed value of the property market is updated each day.

The benefits of a hedonic regression index include the sheer timeliness of the reading (virtually a real time indicator), the lack of any bias that can push the index higher or lower, as well as the fact that the index tracks true value shifts across the entire housing asset class rather than only across those properties that have recently transacted.

CoreLogic provides free public access to a full 12 month back series of the daily hedonic index, as well as a monthly summary of the end of month index results across each capital city by dwelling type. The index is published on the first working day of each month and has been independently peer reviewed and audited, the results of which are published on the CoreLogic web site, along with full documentation of the hedonic method used to build the index.

In summary, there are a variety of measures available to track dwelling prices and values across Australia. Each method presents its own pros and cons and there will always be differences in the results based on the different methods being uitlised, but also based on the differences in data quality, cleaning and sampling techniques, data timeliness, geographic context and time frames of the calculation. Other technical differences will also play out in the data based on specific ways each method treat the underlying data sets. For example, using a settlement date rather than a contact date in the analysis will show a difference in results, particularly at a time when a great deal of off the plan unit sales are flowing into the market where the difference between the contact date and settlement date could be several years.

While there will be divergence in these measurements of price and value changes from period to period, over a longer period, each of the methods used will tend to show broadly similar results. One notable exception is the presence of off the plan transactions, which will cause the hedonic index to diverge from repeat sales and non-revising median indices from time to time. Repeat sales indices and non-revising median indices (in particular based on sales data over the prior quarter) are more likely to broadly track one another because they both exclude off the plan sales.

CoreLogic privately calculates all of the indices described above, however our primary reference for measuring the change in house and unit values is the hedonic regression index thanks to the timeliness of the measure, the absence of any bias in the measurement and the fact that the index measures value growth across the entire housing portfolio rather than only those properties that have transacted.

In order to get a complete understanding of the housing market there is a vast array of other housing market measures that need to be viewed in context with indices that measure price and value movements.  CoreLogic also provides weekly updates on auction markets and clearance rates, private treaty metrics such as average selling time and vendor discounting rates, transaction numbers, listing counts and rental information as some examples.

Additionally the performance of the housing market will vary substantially across the different product types and geographically, so it’s important to analyse the housing market at more granular levels than just capital city dwelling performance.

At CoreLogic, we place the utmost importance on our data and analytics assets.  We dedicate more than $20 million each year in acquiring and maintaining our data sets.  Our collection, analysis and research methods are audited regularly, and we are independent of any real estate, media or banking interests.  CoreLogic continues to grow with over 480 people employed in ten locations in Australia and New Zealand. Over 20,000 customers and 150,000 end users in property, finance and government use CoreLogic services and platform more than 30,000 times a day.

Higher Auction Clearances Confirmed

According to CoreLogic, based on preliminary results, the combined capital city clearance rate rose this week, from 75.4 per cent last week to 77.9 per cent.

This week, the clearance rate across the capitals is higher than one year ago, when 69.9 per cent of reported capital city auctions cleared. There were 2,093 capital city auctions held over the week, similar to the 2,062 last week, but lower than one year ago, when, despite lower clearance rates, the spring market was in full force, with over 2,500 auctions held across the combined capitals. This week last year represented the 7th consecutive week of capital city auction volumes being over the 2,000 mark, while over the past seven weeks, only three weeks have seen more than 2,000 auctions across the capitals.


20160919-capital-cityThis aligns with the APM data already posted, though there are some variations.

Preliminary auction clearance rates ease slightly to 76.4 per cent

CoreLogic says so far this week, 1,683 capital city auction results have been reported to CoreLogic, resulting in a preliminary auction clearance rate of 76.4 per cent across the combined capital cities.

This week, 2,026 total auctions were held across the capital cities, higher than last week, when 1,899 auctions were held, but remaining lower than one year ago when 2,654 capital city properties went under the hammer.  Clearance rates are still tracking above 70 per cent, which they have done since the last week in July.  This week’s preliminary clearance rate is down slightly from last week’s clearance rate of 77.1 per cent, which was the highest clearance rate recorded for the year to date.  At the same time last year the clearance rate was 71.2 per cent.

20160912-capital-city

So Just How Much Are Home Prices Rising?

The statistical “fog of war” appears to have descended on Australian home prices, partly fueled by the RBA’s recent statements, and the latest chart pack data. Because of perceived issues with the CoreLogic data series, we see plots from a number of data providers, including the ABS (whose June 2016 data should be out later on – they are disgracefully slow on releasing their quarterly price data).

housing-pricesNow, we see there are some significant variations between the series, and of course in turn mask the significant differences between locations. CoreLogic has been tweaking their series, and the RBA specifically mentioned this in their recent report. These differences are driven by different methodologies, as well as some series breaks.

So, what is the truth about home price momentum? Of course the RBA wants to show prices growing more slowly despite the cut in the cash rate, thanks to their careful management; whilst others want to talk up the positive movements, to encourage more transactions. Our surveys suggest demand is still quite strong.

As best we can tell, price momentum did moderate in recent months, but now is on the rise again, thanks to low rates, and ongoing interest from investors. Somewhere between 2.5% and 7.5%! The high auction clearance rates appear to confirm this.

But, the real amount of the movement is uncertain. Yet another example of the problems we have getting meaningful, prompt and reliable statistics in Australia.

The cost to rent in Australia is still falling

From Business Insider.

The cost to rent in Australia continues to fall, according to new data released by CoreLogic.

In the group’s latest rent review, released monthly, average rental rates fell by 0.3% across Australia’s capital cities in August, leaving the decline on a year earlier at 0.5%.

The decline registered in August was identical to that seen in July.

In dollar terms, the average weekly rent now stands at $481, the lowest level seem since November 2014. From the record high of May last year, the average rent has fallen by 1.4%.

By type of dwelling, the average combined capital city house rent now stands at $484 per week, slightly ahead of units at $466 per week.

Over the past year housing rents have fallen by 0.8%, while those for units have increased by 0.7%. Both sit at record lows.

Source: CoreLogic

The annual fall in the headline index reflects the fact that there are currently more houses than units available for rent in Australia.

This table from CoreLogic shows the change in rents seen across individual capitals over the past month, quarter and year. It also shows current rental yields, comparing them to the levels of a year earlier. Like the annual change in rents, they too sit at record lows.

Though combined capital city rents have fallen over the past year, it’s clearly not uniform in nature.

“Melbourne, Hobart and Canberra have each recorded stronger rental growth over the past year compared to the previous year,” notes CoreLogic. “At the same time, we are experiencing the weakest annual changes in rents on record in Sydney, Brisbane and Perth.”

To Cameron Kusher, research analyst at CoreLogic, the weakness seen over the past year looks set to continue for some time yet.

“As long as wages growth continues to stagnate, coupled with historically high levels of new dwelling construction and slowing population growth, landlords won’t have much scope to increase rents,” says Kusher.

“On the flipside, renters are now in a much better position to negotiate,” he adds.

Capital City Auction Clearance Rate Reached a New Year to Date High

According to CoreLogic, the first weekend of spring sees preliminary capital city clearance rate reach a new year to date high of 78.4 per cent.

The number of homes taken to auction this week fell slightly to 1,858, compared to the 2,153 auctions held last week and 2,297 one year ago.  The preliminary clearance rate was higher than the previous week’s result of 74.5 per cent and up from last year, when the clearance rate was recorded at 73.2 per cent.

Preliminary results this week are the highest recorded this year.  The results show that Melbourne and Sydney recorded the highest clearance rates of (79.3 per cent) and (83.9 per cent) respectively, however both cities were host to fewer auctions this week when compared to last week.

20160905 Capital city

This is consistent with the APM data we reported on Saturday.

Auctions Up and Hot, Again

CoreLogic’s latest auction data shows there were 2,113 auctions held across Australia’s capital cities this week, a rise from last week, (1,795) yet lower than the 2,654 auctions held at the same time last year. This aligns with APM’s data we discussed on Saturday.

It is expected that auction activity will begin to pick up as we head into the spring selling season. The preliminary auction clearance rate was 76.6 per cent this week, higher than last week’s result of 75.2 per cent and representing another year to date high for the combined capitals. One year ago, the final auction clearance rate was recorded at 73.4 per cent, lower than what is currently being observed. Over winter 2016, clearance rates has ranged from a low of 65.7 per cent to a high of 76.6 per cent, compared to last winter where the weekly clearance rate remained above 70 per cent each week for the entire winter season, peaking at 78.5 per cent at the start of June.

20160829 capital city