Where to for the housing market in Spring?

A nice summary piece from CoreLogic’s blog.

Housing-Dice

The housing market appears to be responding to a number of factors which have spurred further growth in home values.  Official interest rates are at historic low levels which has encouraged borrowing for housing and driven housing debt to record-high levels.  The low interest rate setting is also seeing significant competition amongst lenders which has resulted in substantial discounts to headline mortgage rates.  Furthermore, while the total number of homes available for sale is similar to levels a year ago, there has been significantly fewer newly advertised properties listed for sale over the past few months relative to previous years.  The low number of newly advertised dwellings available for sale has created a sense of urgency for buyers in the market, particularly in Sydney and Melbourne, and resulted in further increases in home values over this growth cycle which has been running for more than four years.

While the banking regulator has implemented policies aimed at slowing investment related credit demand, his has not resulted in a significant cooling in the housing market. The pace of investment related credit growth has slowed from a peak of nearly 11% per annum to 5% over the most rent 12 months period, however we are now seeing an uplift in lending to investors once more.  Following the most recent interest rate cut, auction clearance rates have elevated to levels not seen for more than a year, particularly in Sydney, the nation’s least affordable housing market.

Interest rates

On August 2, the Reserve Bank (RBA) decided to cut official interest rates by 25 basis points to 1.5%.  While interest rates were lowered to historic lows, headline variable mortgage rates were generally reduced by much less, with each of the Big 4 banks lowering their mortgage rates by no more than 14 basis points.  Despite the fact that the interest rate cuts were not passed on in full to mortgage holders, mortgage rates below 4% are available for those who wish to move from their current lender.  With most mortgages on a variable rate, any cut to mortgage rates will improve a household’s disposable income.  Furthermore, it has become clear that it will also give them more confidence to increasingly purchase more expensive homes, well in Sydney and Melbourne at least.

Housing debt

Each quarter the RBA publishes ratios of household finances which include the ratio of household debt to disposable income.  The latest data to March 2016 shows that the typical level of housing debt is 134.7% higher than household disposable income.  The current ratio is a record-high but it is important to remember that it is a national snapshot and conditions across different housing markets are likely to vary substantially.  Since the current phase of growth in home values commenced in the June 2012 quarter, this ratio has lifted from 119.0%.

While the ratio of housing debt to disposable income has increased and is at a record-high, the ratio of housing assets to disposable income has also risen as home values have increased.  In the June 2012 quarter, the typical value of household assets was 394.4% higher than household disposable income.   By March 2016, the ratio had increased to 470.8% indicating a significant increase in the value housing assets.  Again, it should be remembered that this is a national measure and local market ratios are likely to be vastly different especially within areas of very little value growth over that time as well as those areas in which home values have fallen.

Properties listed for sale

Over the four weeks ending August 21 2016 there were 39,676 new (not previously advertised for at least six months) residential properties listed for sale and 229,386 total (includes new and relisted properties) properties advertised for sale.  The number of newly advertised properties listed for sale was -3.4% lower than at the same time last year and new listings have been lower each week year-on-year since early June 2016.  Meanwhile, total listings are -0.9% lower than they were a year ago and on a weekly basis have been consistently lower year-on-year since early July of this year.  New and total listings are now starting to increase as we head closer to the beginning of the Spring Selling Season as they do each year.

While the national figures show fewer listings than a year ago, the trends are very different across individual capital cities, particularly in Sydney and Melbourne where home value growth conditions are strongest.

In Sydney, over the past four weeks there were 6,299 newly advertised and 18,951 total properties advertised for sale.  Year-on-year, new listings have now been lower than they were the previous year fairly consistently since last November and are currently -20.6% lower than they were a year ago.  Over the past four weeks there were 17,949 total listings in Sydney which was 0.8% higher than a year ago.  While total listings are slightly higher than a year ago, there is very little new stock being listed for sale.  New listings are arguably more important than relisted properties, especially if the relisted stock has been for sale for a long period of time and vendors aren’t adjusting their price expectations.   Even though spring is just around the corner, there is very little fresh stock being added to the market.

It is a similar story in Melbourne where there were 7,177 new and 25,846 total residential properties listed for sale over the four weeks to 21 August 2016.  The number of new listings was -9.4% lower year-on-year and total listings were -0.8% lower.  Again, with spring just around the corner there is a relatively low supply of newly advertised properties hitting the market for sale.

Mortgage demand

One of the big challenges the RBA has is the quality and regularity of mortgage data collection.  While housing finance data is published each month, owner occupier housing finance commitments are published both on a number and value basis while investor housing finance commitments are only published on the basis of value not the number of loans.  With the investment segment having become so prevalent, it is a challenge not knowing both the number and value, particularly when investment is so strong in Sydney and Melbourne at a time when home value growth is also so strong.  Adding to the challenge of interpreting housing finance data is the lack of clarity about how off-the-plan unit purchases are captured in the data.  It is unclear as to whether they are classified as construction of dwellings or purchase of new dwellings.  Finally re-classification of large swathes of mortgages from lenders away from investment and toward owner occupiers has made reading the market even more difficult.

The latest housing finance data showed that in June 2016 there was $32.6 billion worth of commitments with the value having increased by 2.3% over the month following a 1.8% rise in May.  Although mortgage lending is rising, it remains -2.1% lower than its peak in April of last year.  Over the month, there was $20.8 billion in commitments to owner occupiers and $11.8 billion in commitments to investors.  Both segments of lending rose over the month however, owner occupier lending is -2.4% lower than its December 2015 peak while investment lending is -22.0% lower than its April 2015 peak.

Owner occupier lending remains quite strong and although investment lending has slowed significantly, there is now scope for it to increase over the coming months.  Without additional details on the number of investment loans it is difficult to know whether the increase is being driven by larger loan sizes, a larger number of loans or a combination of both.

Auction clearance rates

Auction clearance rates are one of the timeliest indicators of the housing market and they tend to be indicative of the broader housing market trends.  It is important to remember that far more homes sell by private sale than by auction and auctions are only a significant proportion of sales in the Sydney, Melbourne and Canberra housing markets.

Auction clearance rates in Sydney last week were at their highest levels in more than a year.  Sydney’s auction clearance rate has been above 70% for 18 consecutive weeks and in Melbourne they have been above 70% for 7 consecutive weeks.

As already discussed, the supply of homes available for sale, particularly in Sydney and Melbourne, is much lower than it has been over recent years.  This is particularly evident when looking at auction volumes.  Over 2016 so far there have been 18,619 auctions in Sydney compared to 25,399 auctions at the same point in 2015.  This represents a -26.7% decline in the number of auctions in Sydney over the year to-date.  In Melbourne there have been 23,779 auctions so far this year which is -9.5% lower than the 26,282 auctions to the same point last year.  The low volume of auction stock is likely to be resulting in the ongoing strength in clearance rates across each city.  Less stock for sale creates a sense of urgency for those looking to purchase.

So what does this mean for Spring?

It is too early to say definitively what will happen this Spring but I would be very comfortable stating that what happens with property listings will have a substantial influence on the market’s performance over the period.  Spring is typically characterised by a fairly significant upswing in stock for sale, this is driven by the belief that Spring is the best time of year to sell (that is a topic for another day).  As supply increases, the value growth performance can slow and as we saw last year, auction clearance rates can actually start to dip.  So the amount of stock which becomes available for sale will be an important factor for the strength of the Sydney housing market.

The recent interest rate cut is another important consideration for the market’s performance.  Although mortgages and the availability of them, is calculated on the borrower’s ability to repay the mortgage at a much higher interest rate, lower mortgage rates impact households by giving them the option to reduce mortgage repayments and therefore having more money each week in their pocket.  This is because most mortgages are on a variable rate and changes to the interest rate on their largest commitment (the mortgage) have an immediate impact on household balance sheets.  With the recent cut to interest rates, it is unlikely to mean that people that could not previously borrow now can, but it does mean that households that previously weren’t considering moving home or buying an investment property may now be more inclined to do so.  This may result in more confidence from those looking to upgrade their property to list their home which means that they also become an additional purchaser.  If someone is now starting to consider buying an investment property it also means additional demand for housing.  How many new buyers there are in Spring remains to be seen but it may encourage an increase in demand for purchase and could result in more people looking to sell their home.

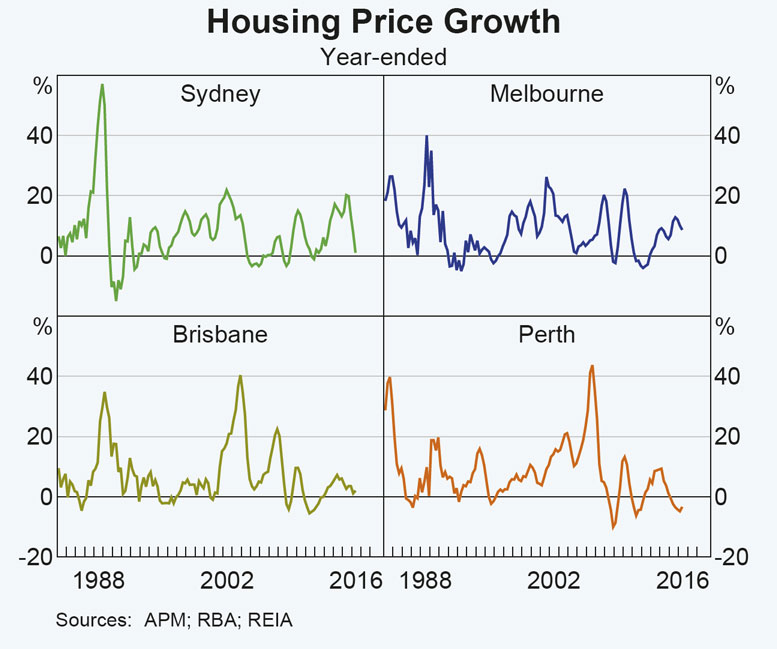
The other major consideration, particularly in Sydney and Melbourne, but also across the rest of the country is what the prospects are for additional increases in home values over the short and medium term.  Combined capital city home values have been rising for more than four years now however, this has largely been driven by Sydney and Melbourne due to their much stronger economies.  While the economies in these cities remain strong, the increasing cost of housing due to the four plus years of value growth may be starting to deter buyers. When you also consider that rents are increasing at record low levels (falling in some areas) and gross rental yields are at record lows, purchasing a property, particularly an investment, is looking less attractive than it has for some time.  Especially when you also factor in the heightened level of housing construction, most of which is inner city units, which is currently underway.

It is going to be interesting to see how all of these factors play out over the next few months and ultimately how the housing market performs.

Massive Auction Clearance Rate Confirmed

Latest data from CoreLogic confirms the APM data we discussed on Saturday, that auction clearance rates hit a high note this past weekend. This should be no surprise given the ultra-low interest rates available, and the strong demand for property as articulated in our recent surveys. We think this confirms the regulators need further to act to curb property lending, or raise, not cut the cash rate. This despite their recent assurances all is well in the property sector.

This week, 1,747 capital city auctions were held and preliminary results show that 1,485 auctions have been reported so far, with a preliminary clearance rate of 76.6 per cent, rising from 75.0 per cent last week across 1,471 auctions. This week’s clearance rate is comparable to one year ago, when 72.9 per cent of capital city properties cleared, however auction volumes remain significantly lower, as one year ago when 2,248 homes were taken to auction across the combined capitals. Preliminary results this week show that while Melbourne and Sydney maintain their place as the strongest performing cities, Canberra and Brisbane have also shown strengthening clearance rate performance.

20160822 capital city

Highest Clearance Rate Since June 2015

Corelogic says the capital city clearance rate continued its upwards trend, with preliminary results showing that 77.8 per cent of reported auctions across the capitals were successful.

The strong trend in auction results over recent months has been achieved on falling auction volumes, suggesting the buyer demand is outweighing the supply of homes being taken to auction.  Auction activity fell slightly this week, with 1,444 homes taken to auction, compared to 1,540 last week. Last year, the auction clearance rate was recorded at a similar level, at 74.6 per cent, however the number of auctions was substantially higher, with 2,118 held. Sydney’s preliminary clearance rate broke the 80 per cent mark this week, with 81.6 per cent of auction results collected so far being positive, while Melbourne was virtually at an 80 per cent clearance rate (79.9 per cent) based on the early results.

20160815 capital city

High Auction Clearances Again

CoreLogic says after recording the strongest year to date result last week, the capital city preliminary clearance rate this week has risen further, from 72.0 per cent to 74.9 per cent, based on preliminary results. The number of auctions held across the capitals this week was lower, with 1,517 held, compared to 1,610 over the previous week. Compared to the same week one year ago, auction activity currently is far more subdued, with almost 1,000 less capital city auctions. There were 2,512 auctions held over the corresponding week last year, with 76.9 per cent reported as successful. Of note this week, each of Melbourne, Sydney and Brisbane saw a rise in auction clearance rates, while across the remaining cities; week-on-week results show a fall in clearance rate.

20160808 combined caps

RBA Suggests House Price Growth Was Overstated

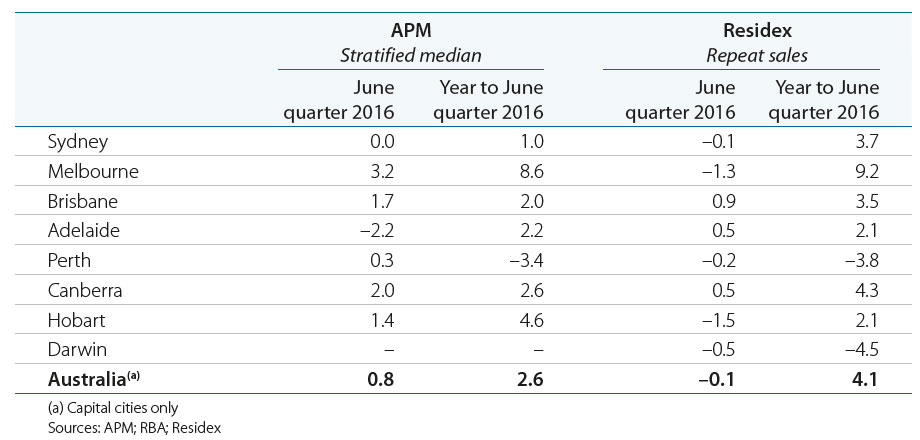
The latest statement on monetary policy, released by the RBA today, discusses the normal range of issues. However, one point of note is the apparent overstatement of the CoreLogic home price data in April and May.

A range of indicators suggest that conditions in the established housing market have eased this year from very strong conditions over recent years. Housing prices were little changed in the June quarter according to most published measures. In contrast, the headline CoreLogic measure of housing prices recorded very strong growth in April and May in a number of cities, to be more than 5 per cent higher over the June quarter.

RBA-Home-Prices-6Recent information suggests that the strong increases reported by CoreLogic were overstated as a result of methodological changes affecting growth rates for the June quarter.

Here is what CoreLogic told their customers.

As part of continual efforts to improve our analytics, filters which are applied to the CoreLogic hedonic index methodology were updated progressively through April.  Static price filters were previously applied to the hedonic index method which were designed to trim extreme transaction prices from the index calculation.  In April, after a periodic model review, CoreLogic revised the filtering method to be dynamic. 

The model recalibration should reduce index volatility and provide more accurate measurements of capital gains going forward.  Additionally, the price filter adjustment should alleviate seasonal changes that were historically evident in the index series during May and June. 

As a result of these changes, we recorded higher than normal intra-month volatility in the capital city index readings during April and May.  The combined capitals index rose 1.7% in April and 1.6% in May before reducing to 0.5% growth in June and, most recently, 0.8% in July.

The changes are part of a once off project aimed at improving the hedonic measurement of capital city home values.  The next major iteration of improvement will occur over the second half of 2016 as we migrate our indices to the new ASGS capital city boundaries.  This update will involve a revised back series of the hedonic index according to the new geography and we expect to release this to the market during Q4 2016.

The most recent data suggest that housing prices declined in most capital cities in July.

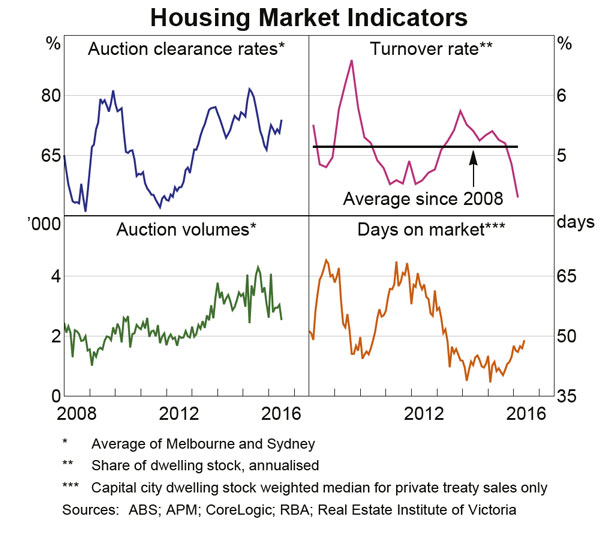
RBA-Home-Prices-1 Other timely indicators of conditions in the established housing market continue to point to weaker conditions than last year. Auction clearance rates and the number of scheduled auctions are lower than a year ago and there has been a large decline in the number of transactions in the housing market, which is reflected in the turnover rate. In the private treaty market, the discount on vendor asking prices has been little changed of late, but the average number of days that a property is on the market has increased from the lows of last year.

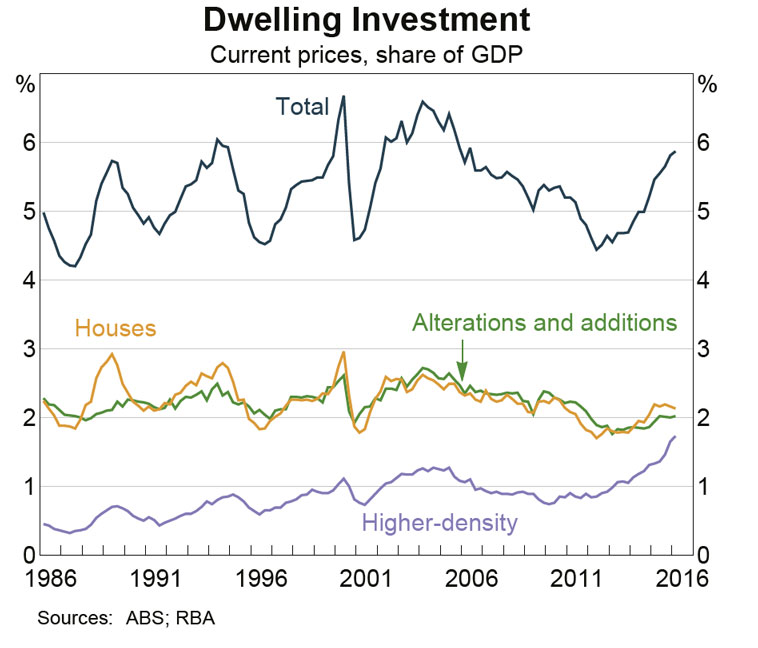
RBA-Home-Prices-2Total housing loan approvals have been little changed in recent months. Meanwhile, housing credit growth has been steady in the first six months of the year but slower than in 2015, consistent with a relatively low level of turnover and the tightening of lending standards towards the end of 2015. The upswing in dwelling investment, particularly the construction of high-density dwellings, has continued, supported by low interest rates and earlier increases in housing prices.  Residential building approvals are lower than their peak of mid 2015 but remain at high levels.

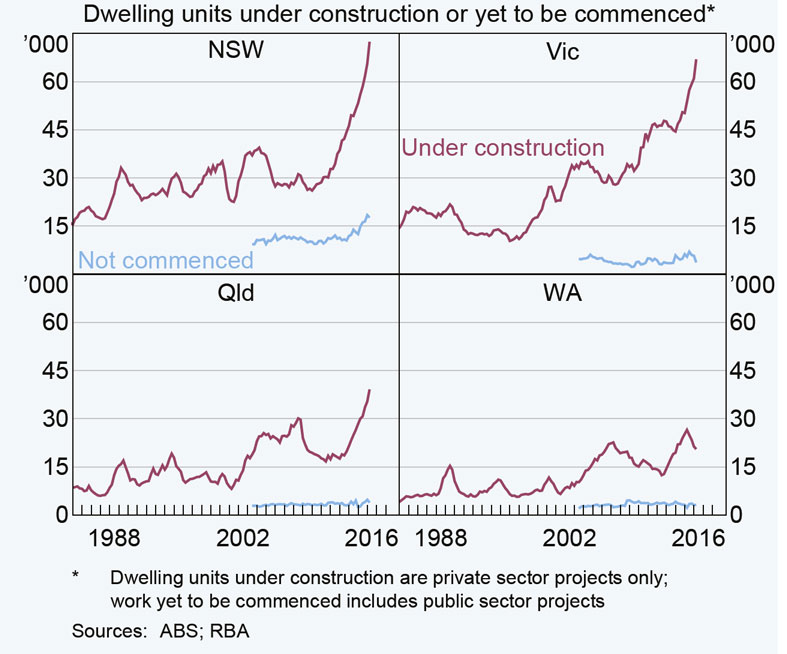
RBA-Home-Prices-7Indeed, building approvals have continued to exceed completions, resulting in the number of dwellings under construction or yet to be completed reaching historically high levels. The work in the pipeline is sufficient to underpin dwelling investment activity for the next couple of years.

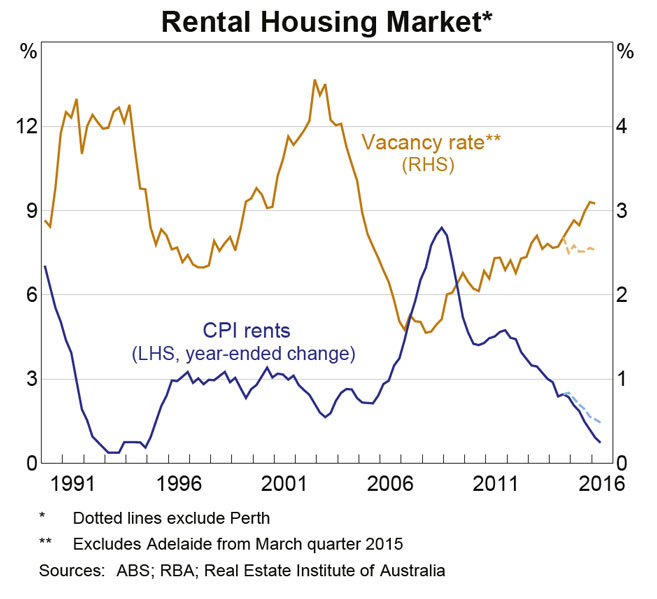
RBA-Home-Prices-4Conditions in the rental market have continued to soften over the past year. The aggregate rental vacancy rate has drifted higher to be close to its longer-run average of around 3 per cent and rental inflation is around multi-decade lows, having eased across most capital cities. The Perth rental market is particularly weak, reflecting the slowing in population growth combined with ongoing additions to the housing supply.

RBA-Home-Prices-5

Units Increasingly Driving The Market

From Corelogic.

Over recent years, the Australian Bureau of Statistics (ABS) has shown that as a proportion of overall dwelling approvals, attached dwellings (high/low rise apartments and townhouses) are increasing. As shown below, the proportion of attached dwellings, based on overall approvals has been trending upwards, and approximately half of all approvals are now for attached stock.

20160803 dwelling proportionsCoreLogic is seeing a similar trend in the proportion of units being advertised for sale. Across the combined capitals, over the four weeks ending 31 July, 2016, it was estimated that 36.2 per cent of dwellings available for sale were units, with houses accounting for 63.8 per cent of total housing stock available for sale.

Sydney and Melbourne, the two largest capital cities in terms of total volume of listings, are seeing the most prominent shift in the availability of stock for sale. In Sydney, over the most recent four week period, it was estimated that 45.3 per cent of stock available for sale were attached dwellings, up from 39.5 per cent last year and 38.3 per cent in 2014.

In Melbourne, almost half (48.9 per cent) of all dwellings currently advertised for sale are units, while one year ago 42.0 per cent of stock was units, and 40.3 per cent in 2014.  Interestingly, units make up approximately 33 per cent of total dwelling stock across Melbourne, so the fact that almost half of advertised stock is for units could potentially be showing that investors are looking to cash out of the market, given the increasing fear of unit oversupply. Melbourne, along with Canberra, are two cities where there has been a notable upwards trend in unit listings and a downward trend in house listings.

Furthermore, capital growth for Melbourne houses has outpaced units on a rolling annual basis for the past 31 months and for Canberra, houses values have grown at a faster annual rate than units for the past 11 months.

When we look at the dwelling stock available for sale five years ago, it was a much different story. Units accounted for just 26.1 per cent of overall capital city dwelling stock available for sale. While in Sydney and Melbourne, units accounted for 35.0 per cent and 29.2 per cent of overall stock on the market, respectively.

20160803 units, capitals, sydney, melbourne

Home Values Up, Rental Yields Down in July

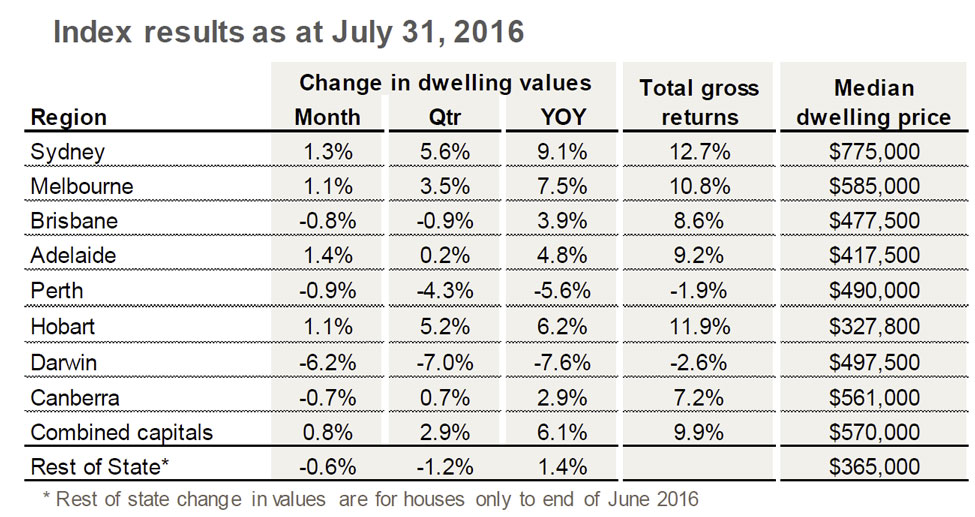
The latest Corelogic data shows that their hedonic eight capital city aggregate index rising 0.8 per cent over the month to reach a new record high. But the movements varied considerably across the capital cities and rental yields fell again.

The annual rate of growth, which hit a recent peak at 11.1 per cent across the combined capitals index in October last year, is now tracking at 6.1 per cent; the slowest annual rate of appreciation since September 2013.

Priuces-Jul-2016 Sydney and Melbourne have also seen the annual rate of growth slip back to below 10 per cent, with the July indices showing a respective 9.1 per cent and 7.5 per cent capital gain over the past twelve months. Darwin and Perth remain as the only two capital cities to record a negative movement in dwelling values over the past twelve months, with values in Darwin down 7.6 per cent and Perth values falling by 5.6 per cent.

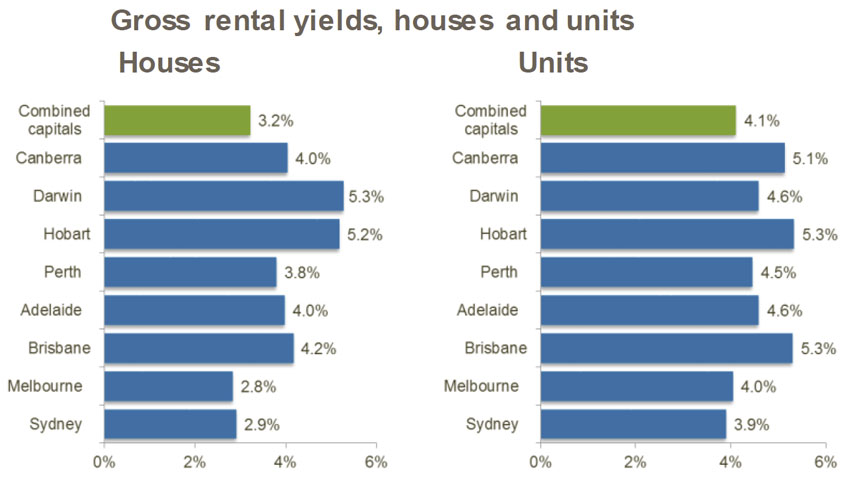
Capital city rental yields have fallen to a new low of 3.3 per cent, with Melbourne down to 2.6% and Sydney 3.9 per cent.

Rentals-Jul-2016

Auctions Clearance Rates Higher, Again

According to CoreLogic, the preliminary clearance rate rose this week, up from last week’s 67.9 per cent to 73.9 per cent.

The level of activity across the capital city auction market also increased this week, with 1,585 auctions held compared to 1,329 auctions last week.  Despite the week-on-week rise in activity, the number of auctions held this week continues to track lower than the corresponding week last year when 1,903 auctions were held, however, the difference in clearance rate (74.6 per cent) was minimal.  In general, winter is typically a quieter season for auctions prior to the ramp up in Spring, and over the past nine weeks, the volume of auctions held across the combined capitals has been around 20 per cent lower than what was seen over the comparable time frame last year, largely driven by less properties being taken to auction across the Sydney market, despite the ongoing strength in the clearance rate.

20160801 capital city

Home Values Have Fallen In Some Capital Cities

From CoreLogic.

Home values have fallen in real terms (after adjusting for inflation) in all capital cities over the past five years except Sydney, Melbourne, Brisbane and Canberra.

Adjusting capital city home values by headline inflation provides interesting insight into the performance of the housing market.  Of course, people mostly analyse the housing market in nominal terms but looking at inflation-adjusted or real changes provides some valuable insight, particularly from an affordability standpoint.  While inflation has increased by 1.0% over the year to June 2016, combined capital city home values have risen by 8.3%.

Chart 1

Adjusting for inflation lowers the change in home values. As you can see in Perth and Hobart it results in larger value declines.  In all other capital cities, real home values have increased over the past year with Sydney and Melbourne still recording double-digit value increases.

Chart 2

Over the past five years, real home values have increased by a compound annual rate of 3.7% compared to 3.1% over the past decade and 4.6% over the past 15 years.  While the headline figure indicates stronger annual growth over the past 5 years than the past 10 years, this is all being driven by Sydney with all other capital cities recording lower real home value changes over the past 5 years compared to the past 10 years.  In fact, home values have fallen in real terms in all capital cities over the past five years except Sydney, Melbourne, Brisbane and Canberra.

Chart 3

Land Price Growth Moderates in early 2016

The March 2016 edition of the HIA-CoreLogic Residential Land Report has just been released by the Housing Industry Association, and CoreLogic. The report provides detailed results relating to prices and sales activity across Australia’s residential land markets.

During the March 2016 quarter, the pace of growth in national land prices slowed to 1.2 per cent, while turnover in the market fell by 1.3 per cent. The easing of price pressures was helped by a 3.4 per cent increase in land sales in capital city markets, although the number of transactions in regional Australia fell by some 8.1 per cent over the same period.

Land-PricesDuring the March 2016 quarter, vacant residential land sales increased most strongly in Perth (+22.3 per cent) followed by Melbourne (+5.2 per cent). However, land market turnover fell in Hobart (-28.4 per cent), Adelaide (-8.3 per cent), Sydney (-5.9 per cent) and Brisbane (-3.4 per cent) over the same period.

“The easing of price growth in the market for residential land is an encouraging sign, particularly given more favourable supply conditions in capital city markets,” HIA Senior Economist, Shane Garrett pointed out.

“However, the value of residential land remains at record highs. This is a key source of affordability difficulties confronted by the many Australian families wishing to purchase their first home,” Shane Garrett cautioned.

“Current arrangements around the funding and delivery of the infrastructure that services new housing are inadequate and preventing the release of more affordable residential land stocks.”.

“As well as hurting ordinary families, the absence of comprehensive reform is paring back Australia’s future growth prospects,” concluded Shane Garrett.

According to CoreLogic research director Tim Lawless, the moderation in the number of vacant land sales has been evident for some time. “National land sales peaked during the June quarter of 2014 and have been trending lower since this time. The quarterly number of vacant land sales hasn’t been this low since the third quarter of 2012,” said Mr Lawless.

“It’s encouraging to see capital city land sales bucking the national trend with an increase of 3.4 per cent over the March 2016 quarter. However, despite the quarterly rise in sales, the number of transactions was still 12.3 per cent lower than in the March quarter of 2015,” added Mr Lawless.

“The fact that vacant land prices are still broadly rising on both a median price and rate per square metre measure, albeit at a reduced pace, at a time when transactions numbers are consistently trending lower sends a clear signal that demand for well-located vacant land remains strong,” Mr Lawless noted.