Auction Action Shows Market Distortions

CoreLogic’s data on auction clearances shows that markets remain firm with the combined capitals preliminary clearance rate remaining higher than 70 per cent for the third week running.

This week 1,295 auctions were held across the capital cities, with 1,076 reported results so far.  The preliminary clearance rate of 70.7 per cent is roughly the same when compared with last week’s result which showed 70.5 per cent of the 1,391 capital city auctions cleared.  Melbourne and Sydney are once again showing the strongest clearance rates of 72.4 per cent and 75.3 per cent respectively.  In terms of auction volumes, both Sydney and Melbourne recorded a lower number of auctions this week when compared to last week, while across the remaining capital cities the auction markets were varied.   At the same time last year, the number of auctions held was still substantially higher (2,143) with a success rate of 74.7 per cent.20160725 capital city

A total of 2 auctions have so far been reported with 1 successful result for Tasmania. Across Perth, there were 21 auctions held this week with a preliminary clearance rate of 42.9 per cent. There were 68 auctions in Adelaide and a preliminary clearance rate of 71.8 per cent, whilst in Brisbane there was 135 auctions with a preliminary clearance rate was 53.2 per cent.

Home Price Growth In Extremis

The latest blog from CoreLogic makes an interesting point about home price growth. It is concentrated in Sydney and Melbourne – and will it continue? Take the two largest centres away, and overall growth is much less impressive.

From May 2012 to June 2016, combined capital city home values have increased by 37.3% while official interest rates fell by 200 basis points to 1.75%.  Although home values have increased over the period, Sydney and Melbourne have recorded a substantially higher rate of value growth than all other capital cities.

Total change in capital city dwelling values
May 2012 to June 2016

2016-07-15--image4

The data indicates that since the financial crisis the capital city housing market could be described as being extremely interest rate sensitive.  Digging deeper into the data shows that in reality it is only Sydney and Melbourne that have really responded to the stimulus of low interest rates.  The relative strength of the Sydney and Melbourne economies and the much greater employment growth has clearly assisted drive housing values higher in these cities.

Until the economic performance improves outside of Sydney and Melbourne it seems unlikely that sustainable growth will return in these areas despite the extremely low interest rates which are set to potentially move even lower over the coming months.  For Sydney and Melbourne although affordability is increasingly becoming stretched home owners have experienced a substantial increase in equity.  With historically weak rental markets and record low yields it will be interesting to see if investors and upgraders in the two largest capital cities continue to show a thirst for housing in these cities given the growth phase has now been running for more than four years.

Auction Results Highlight The East/West Divide

The latest preliminary auction clearance data from CoreLogic shows the rate held above 70% across the combined capitals for the second week running, with more than three quarters of Sydney and Melbourne auctions returning a successful result.

Across the combined capital cities, the preliminary clearance rate rose this week, up from 70.6 per cent the previous week to 71.6 per cent. The 70.6 per cent clearance rate over the week ending 10 July represented the first time  in 15 weeks where the combined capital city clearance rate surpassed 70 per cent. The strong results are still being driven by Sydney and Melbourne, with all other capital city regions recording a preliminary clearance rate under 65 per cent.  The number of auctions held across the capitals has remained fairly steady this week, with 1,378 auctions held, compared to 1,399 and remaining low compared to the same time last year, when 1,827 auctions were held, resulting in a clearance rate of 75.4 per cent.

20160718 capital city


Auction Clearance Rates Higher Last Week

Data from CoreLogic shows that of the 1,365 capital city auctions held this week, 1,110 results have been reported so far with a preliminary clearance rate of 72.0 per cent. This week’s preliminary clearance rate is higher than last week, when final results showed that 67.0 per cent of auctions were successful. The number of auctions held this week was much higher than last week, when 841 auctions were held, with activity lower than usual given the Federal Election.  However, auction activity this week remains substantially lower than over the two weeks leading up to the election, when across the combined capital cities, more than 2,000 auctions were held each week. At the same time last year, 1,704 capital city auctions were held with 74.9 per cent clearing.

20160711 CC

Auction Volumes Down Last Saturday

According to CoreLogic, 70.7 per cent of capital city auctions were successful this week, according to preliminary results. This week’s result indicates an upwards shift in the auction clearance rate from last week, when 66.4 per cent of auctions were successful and is also higher than the clearance rate recorded over the first month of winter 2016 (67.1 per cent). The number of residential auctions held this week was 811, down substantially from 2,218 last week. At the same time last year, 1,674 capital city auctions were held with 76.8 per cent clearing.

20160704 capital city

A Two Speed Home Market

The CoreLogic June Home Value Index results reported a 0.5% rise in capital city dwelling values over the month with five capitals recording a fall in dwelling values while Sydney, Melbourne and Hobart values show another substantial rise.

Home-Prices-June-2016Higher dwelling values across Australia’s two largest capital cities continued to push the CoreLogic Hedonic Home Value Index to new record highs, with dwelling values across the combined capital cities rising by 0.5% in June to be 8.3% higher over the past twelve months.

The June results continued to show a rebound in housing market conditions after CoreLogic reported weaker results for the final quarter of 2015 when the combined capitals’ index was down 1.4%. CoreLogic Asia Pacific research director Tim Lawless said,

“Importantly, the pace of capital gains in June was substantially lower than the April and May results when CoreLogic reported a 1.7%, and 1.6% month-on-month lift in capital city dwelling values.”

“The monthly growth rate reduction is likely to be very much welcomed by state and federal government policy makers and regulators who may be concerned about a sustained rebound in capital gains.”

“As an example, home values in Sydney have been rising for four years, and have increased by a cumulative 59% over this time frame. Melbourne dwelling values have been rising for the same length of time and have moved 41% higher over the growth cycle to date.”

“The combined capitals’ headline result was driven by a strong 1.2% rise in Sydney dwelling values, and a 0.8% gain across Melbourne’s housing market. Hobart values also showed strong conditions with dwelling values moving 1.8% higher over the month,” Mr Lawless said.

Although the headline results are positive, five of Australia’s eight capital cities recorded a decline in dwelling values in June. Monthly declines of more than 1% were recorded in Darwin (-1.6%), Adelaide (-1.3%) and Canberra (-1.1%), while the falls in Brisbane (-0.1%) and Perth (-0.8%) were less severe.


Property price to income ratio is rising in Sydney, Melbourne and Canberra

From CoreLogic.

Utilising quarterly household income data from the Australian National University, CoreLogic has developed quarterly measurements of the ratio of property prices to annual household income.  This data is extremely valuable when looking to measure housing affordability.  The measure is available at a number of different geographies from SA2 regions (generally about the size of a suburb or group of suburbs) all the way up to GCCSA (capital city and rest of state) regions.  When looking at the analysis it is important to note that a higher ratio means housing is less affordable and a lower ratio indicates better affordability.

Chart 1
With property prices varying greatly between each of the capital cities it is interesting to note that the variation in household incomes in nowhere near as large.  In March 2016, Hobart had the lowest median dwelling price at $337,250 and Sydney had the highest median price at $775,000.  Meanwhile, household incomes range from as low as $1,175/week in Hobart to $2,118/week in Darwin.  Obviously the differences in property prices and incomes impact on housing affordability, so let’s take a look at each of the capital cities and the ratio of prices to income over time.

Outside of Sydney, Melbourne and Canberra housing affordability is improving with each capital city having a current ratio which indicates affordability has been worst in the past.  The problem is that almost 2 out of every 5 Australians live in either Sydney or Melbourne and these two cities have also been the epicentres of employment and economic growth over recent years.  Deteriorating housing affordability in Sydney and Melbourne impacts on significantly more people than deteriorating housing affordability elsewhere around the country.

This measure of affordability provides a high level overview of the relative housing affordability across the capital cities, but it is important to remember that geographically across each city the affordability story can be dramatically different.  Furthermore, this analysis does not take into consideration interest rates which can make housing affordability more affordable.  While interest rates are undoubtedly a consideration for buyers, they must also consider that interest rates can fluctuate dramatically over the life of a mortgage.

Capital City Clearance Rates Rise Again

According to CoreLogic, the preliminary auction clearance rate was recorded at 69.1 per cent this week, having risen from 67.4 per cent last week. This week’s rise represents a further improvement from the recent low of 65.7 per cent over the weekend leading up to the Queen’s birthday public holiday. There were 2,189 auctions held across the combined capital cities this week, up from 2,183 over the previous week. Auction performance remains well below the comparable week last year when 76.9 per cent of the 2,249 auctions cleared. For the tenth week in a row, Sydney recorded a clearance rate that was in excess of 70 per cent.

20160627 captial city

NSW and VIC Population Increased The Most

CoreLogic’s latest – population growth slows nationally but New South Wales and Victoria attract a record high proportion of the population increase.

Demographic data for the December 2015 quarter was released by the Australian Bureau of Statistics yesterday.

Chart 1

At the end of 2015, the national population was estimated to be 23,940,278 persons having increased by 1.4% or 326,073 persons over the year.  Although the population continues to increase at a fairly rapid pace, the rate of population growth has been trending lower since it peaked at 2.2% over the year to December 2008.

Chart 2

Nationally, population growth is driven by two factors: migration and natural increase (births minus deaths).  Over the 12 months to December 2015, the national population increased by 148,935 persons due to natural increase and by 177,138 persons due to net overseas migration.  Net overseas migration has increased a little over the quarter but has fallen dramatically since it peaked at 315,687 persons over the 12 months to December 2008.  Natural increase is -1.0% lower over the year while net overseas migration is -0.5% lower.

Chart 3

Looking at state population data, New South Wales and Victoria have recorded the greatest increases in population over the past year, up by 106,116 and 109,830 persons respectively.  Across the other states and territories the annual population increases have been recorded at: 59,714 persons in Queensland, 11,180 persons in South Australia, 30,980 persons in Western Australia, 2,110 in Tasmania, 840 persons in Northern Territory and 5,271 persons in the Australian Capital Territory.  The above chart shows the rate of population growth over the year and it shows that not only has Victoria seen the greatest increase in population over the year it also has the fastest rate of growth of all states and territories.

Chart 4

Over the past year, Victoria has accounted for 33.7% of the total increase in the national population (more than a third) which is a record-high for that state.  Elsewhere, South Australia accounted for 3.4% of national population growth (lowest since March 2002) and Western Australia accounted for 9.5% of population growth (lowest since December 2002).  The above chart highlights that historically either New South Wales or Queensland has typically accounted for the highest proportion of population increases.  Since the financial crisis, New South Wales and Victoria have accounted for increasing proportions of national population growth due to their stronger economies and the subsequent lure of job opportunities in Sydney and Melbourne.

At the state level there are two components of migration; net overseas migration and net interstate migration.  It is important to look at how the trends across each category of migration impact on population growth in each state.

Chart 5

Throughout 2015 almost three quarters of net overseas migration occurred in either New South Wales (38.6%) or Victoria (34.2%).  The chart shows that annual net overseas migration to New South Wales and Victoria is continuing to rise (albeit at a moderate pace) but is falling elsewhere.  The 34.2% of national new overseas migration for Victoria over the year was a record-high.  Queensland accounted for just 11.0% of net overseas migration over the year, its lowest share since March 1991 and well below the 20.1% of national net overseas migration the state attracted in March 2009.  Western Australian net overseas migration accounted for just 8.2% of national net overseas migration, a far cry from its recent peak of 23.9% in September 2012.  As the mining boom has faded and the New South Wales and Victorian economies have strengthened over recent years, more migrants have been choosing to settle in these two states and fewer are settling in Queensland and Western Australia.

Chart 6

Victoria and Queensland are the only two states that have recorded positive net interstate migration over the 2015 calendar year with net interstate migration cancelling itself out at a national level.  Over the year, net interstate migration was recorded at +13,049 persons in Victoria, which is an historic high.  In Queensland, following a long decline in net interstate migration, the number of migrants crossing to border into Queensland has started to turn, recorded at +8,326 over the past year its highest level since March 2013.  Across the other states and territories, the losses from net interstate migration have been recorded at: -8,749 in New South Wales, -4,967 in South Australia, -4,313 in Western Australia, -79 in Tasmania, -2,732 in Northern Territory and -535 in Australian Capital Territory.  The net outflow in New South Wales is the largest since March 2014, South Australia’s outflow is the greatest since September 1996 and Western Australia’s outflow is the greatest on record.  Tasmania’s net outflow is the lowest since June 2011, the Northern Territory’s is the lowest since December 2013 as is the Australian Capital Territory’s.

Although population growth is continuing to trend lower, it is becoming more evident that growth is much greater in the states with stronger economies (NSW and Vic).  It is clear that the economic strength of a state is key to attracting more residents not just domestically but also internationally.  It also looks that as housing becomes increasingly unaffordable in the two capital cities of NSW and Vic, interstate migration into Queensland (the third largest state) is beginning to pick-up again.  I would suggest this is being driven by an improving employment market accompanied by a much more affordable housing market.

The more up-to-date overseas arrivals and departures data indicates that net overseas migration is likely to continue to slow over the coming quarters.

CoreLogic’s Profile of the Australian Residential Property Investor

CoreLogic released its national Profile of the Australian Residential Property Investor Report, which comprises analysis around residential property investment across Australia, and seeks to quantify investment-related activity.

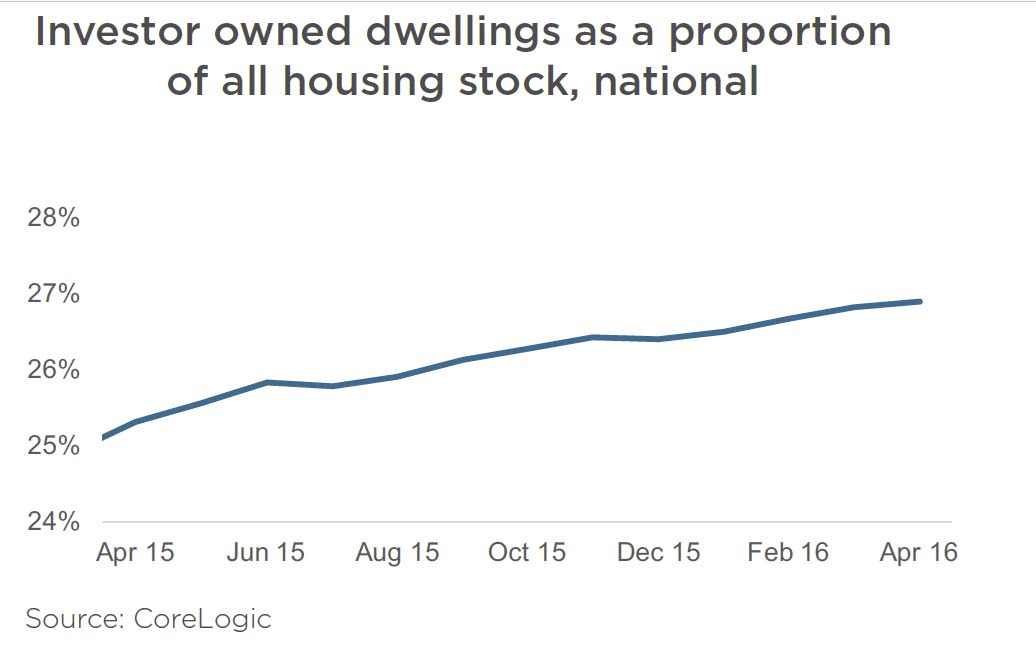
Nationally, investor owned dwellings comprise 26.9% of all housing stock, but 23.8% of the value of all housing stock, highlighting that investment in the housing market is generally across lower valuation segments compared with owner occupied homes.

CoreLogic-1At a national level investment is generally skewed towards the lower valuation brackets; 53.4% of investment-owned dwellings have a current estimated market value of less than $500,000, compared with 46.9% of owner occupied dwellings. Additionally, each capital city shows the large majority of investor -owned dwellings have an estimated market value that is lower than the capital city median value.

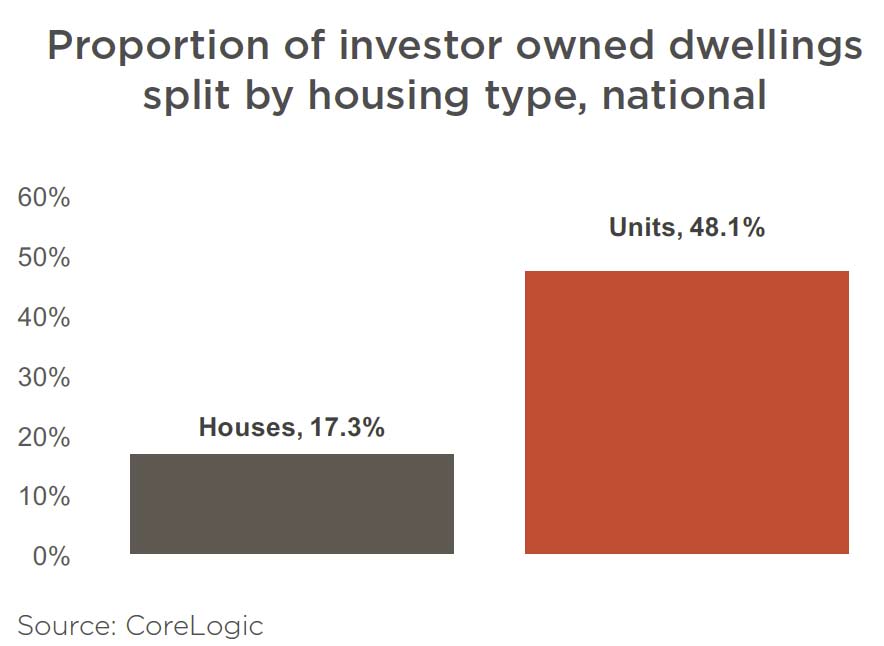
Across the broad product categories of houses versus units, investment is heavily concentrated within the unit sector, where investor owners comprise almost half (48%) of all attached housing.Conversely, detached housing ownership is more biased towards owner occupiers, with investors accounting for 17% of all detached housing stock.

CoreLogic-2 CoreLogic estimates there are 2.6 million investor owned dwellings across Australia worth approximately $1.37 trillion. Based on the most recent taxation data, there are 2.03 million individuals who indicated they owned a residential rental property, implying a very low concentration of investment (approximately 1.28 investment properties per investor).

Actually, you need segment the investment sector, as we do, between Portfolio Investors, who have multiple investment properties (average number 8) and Property Investors who have one or two properties. Averaging across all property investors misses this important segmentation.

According to the ABS, the total value of Australia’s 9.7 million residential dwellings increased $15.4 billion to $5.9 trillion. The mean price of dwellings in Australia is now $613,900. CoreLogic, on the other hand, says property is worth an estimated $6.5 trillion across 9.6 million dwellings, with an average price of $677,000!

In any event, they are right to say “the housing asset class is worth more than three times the value of Australian superannuation funds ($2.0 trillion) and more than four times the value of Australian listed stocks ($1.5 trillion)”.