VIDEO
Join us for a live Q&A as I discuss the latest from our surveys and core market model. I also had the DFA post code engine on line.
https://walktheworld.com.au/
Original live replay and chat also available: https://youtu.be/KrzLjg5IhRg
Go to the Walk The World Universe at https://walktheworld.com.au/
VIDEO
And we will also have our post code engine online tonight…
This is an edited edition of our latest live event.
CONTENTS
0:00 Start
The original edition with live chat replay is also available: https://youtu.be/mYWJ-b3lkfQ
Join us for a live Q&A as I discuss the current market with Michael Invests – host of his own channel. https://www.youtube.com/channel/UC2FiWOXQosY8RU5bxQCqmIg
https://walktheworld.com.au/
Digital Finance Analytics (DFA) Blog
DFA Live Q&A Replay 29th Dec 2020 [Podcast]
Play Episode
Pause Episode
Mute/Unmute Episode
Rewind 10 Seconds
1x
Fast Forward 30 seconds
00:00
/
01:27:32
Subscribe
Share
VIDEO
This is an edited edition of our latest live event.
CONTENTS
0:00 Start
The original edition with live chat replay is also available: https://youtu.be/mYWJ-b3lkfQ
Join us for a live Q&A as I discuss the current market with Michael Invests – host of his own channel. https://www.youtube.com/channel/UC2FiWOXQosY8RU5bxQCqmIg
Go to the Walk The World Universe at https://walktheworld.com.au/
VIDEO
Join us tonight for a live discussion on investing over the past year, and what might be ahead – and ask a question live!
Join us for a live Q&A as I discuss the current property market with Edwin, our property insider.
This is an edited version of the livestream, the original, with chat replay is also available. https://youtu.be/3IDlbNoqmwU
https://www.ribbonproperty.com.au/ https://walktheworld.com.au/
Digital Finance Analytics (DFA) Blog
DFA Live Q&A HD Replay - Edwin Almeida: Property Insider [Podcast]
Play Episode
Pause Episode
Mute/Unmute Episode
Rewind 10 Seconds
1x
Fast Forward 30 seconds
00:00
/
01:35:59
Subscribe
Share
VIDEO
Join us for a live Q&A as I discuss the current property market with Edwin, our property insider.
https://www.ribbonproperty.com.au/
https://walktheworld.com.au/
Join us for a live Q&A as I discuss the current markets with Nucleus Wealth Head of Investment Damien Klassen. This is an edited HD edition. The original, with live chat replay is at: https://youtu.be/FZMeB0PTE50
Go to the Walk The World Universe at https://walktheworld.com.au/
Digital Finance Analytics (DFA) Blog
DFA Live HD Replay: Santa Rally Or Bust? [Podcast]
Play Episode
Pause Episode
Mute/Unmute Episode
Rewind 10 Seconds
1x
Fast Forward 30 seconds
00:00
/
01:33:45
Subscribe
Share
VIDEO
This is the edited edition of our latest live show.
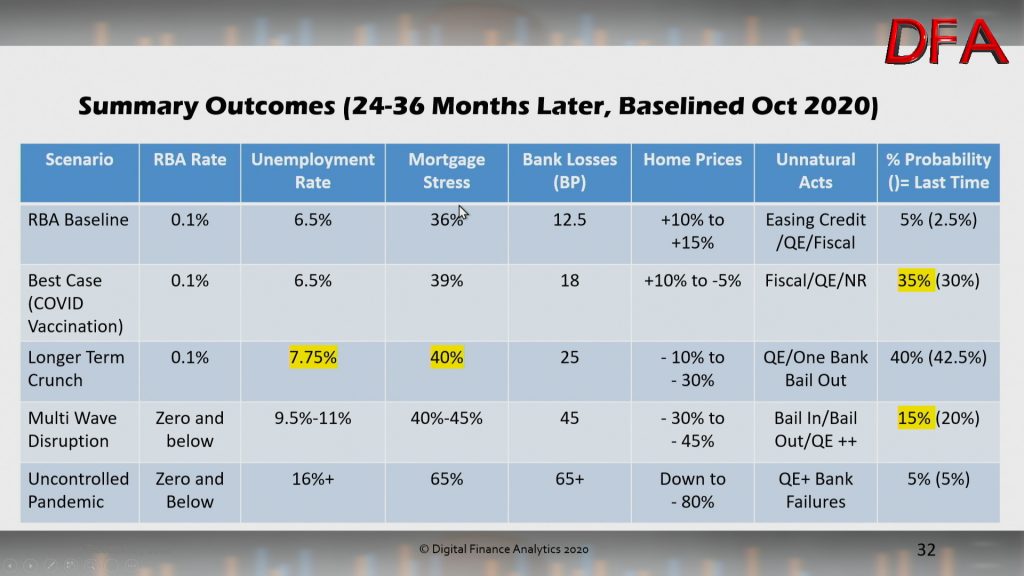
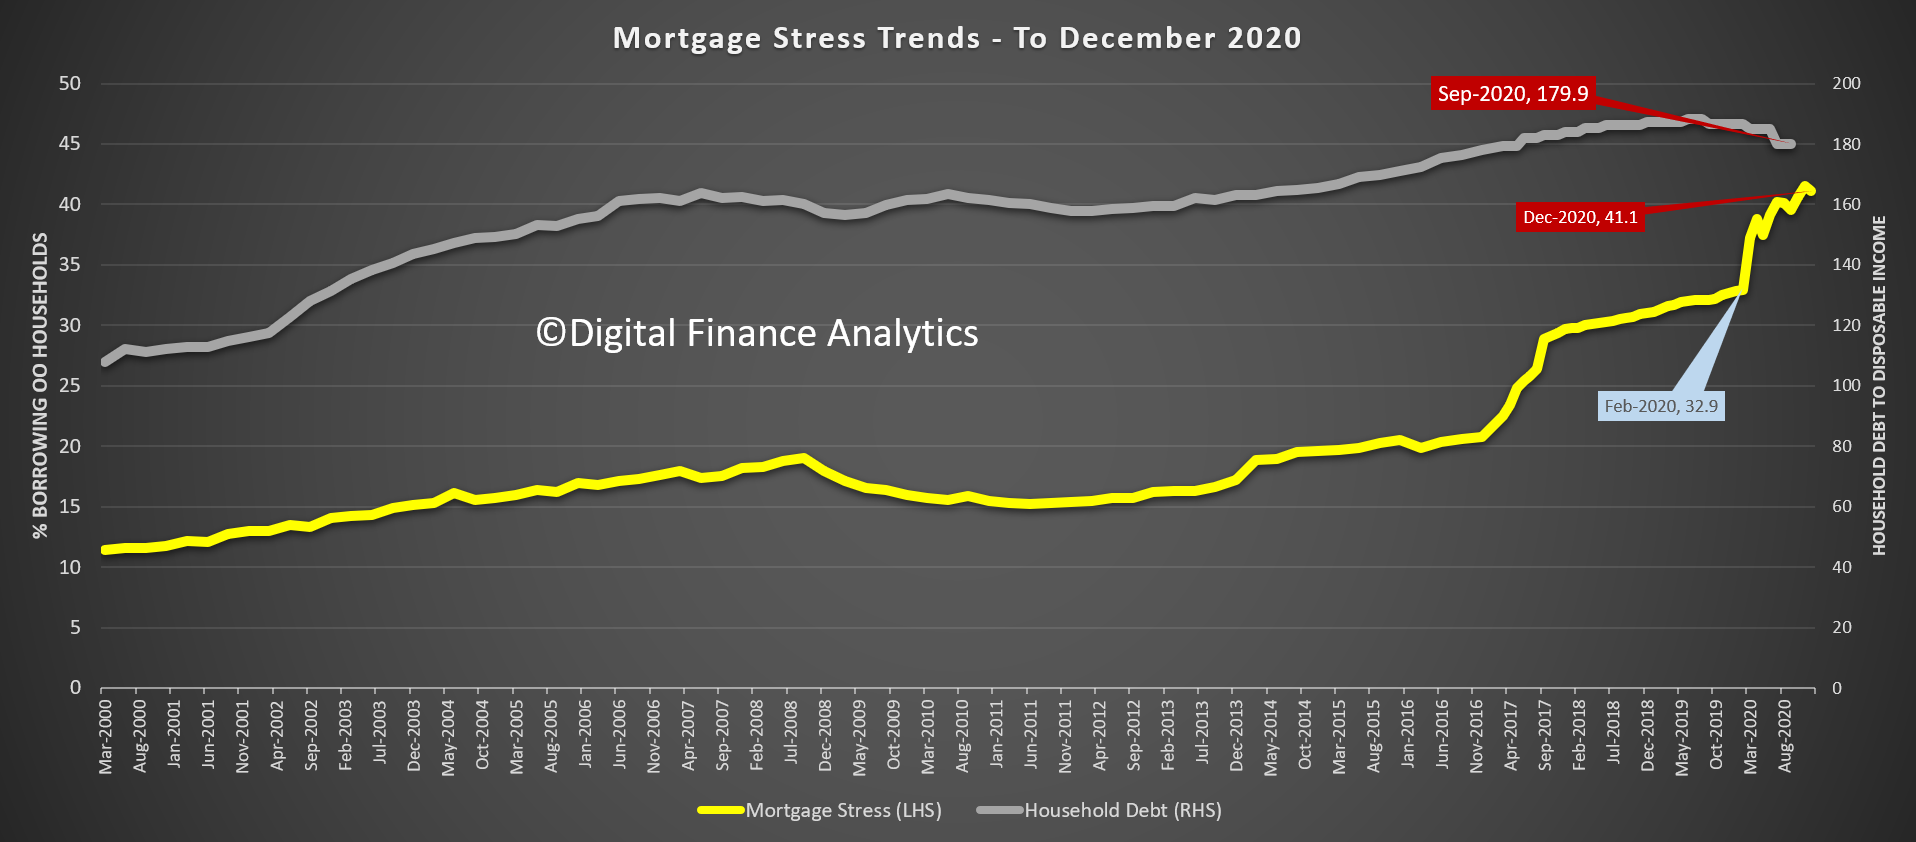
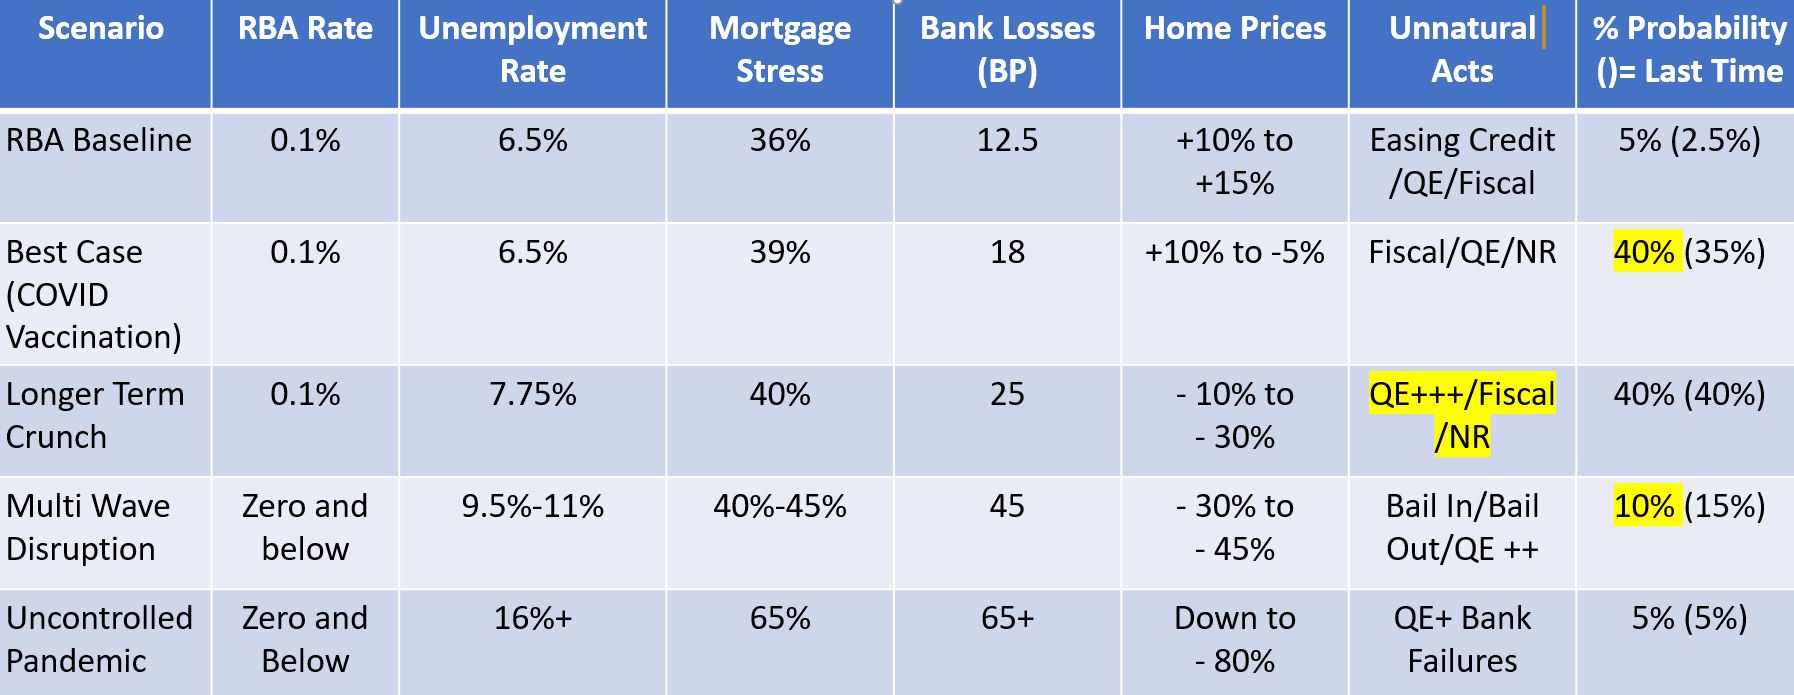
Join us for a live Q&A as I discuss the latest results from our surveys and explore the impact at a post code level.
00:00 Start
https://walktheworld.com.au/
Original edition with live chat replay at: https://youtu.be/6h4730QSG94
The latest edition of our finance and property news digest with a distinctively Australian flavour.
Go to the Walk The World Universe at https://walktheworld.com.au/
This is the edited edition of our latest live show.
00:00 Start
https://walktheworld.com.au/
Original edition with live chat replay at: https://youtu.be/6h4730QSG94
Digital Finance Analytics (DFA) Blog
DFA Live Q&A HD Replay - Scenario and Stress Update [Podcast]
Play Episode
Pause Episode
Mute/Unmute Episode
Rewind 10 Seconds
1x
Fast Forward 30 seconds
00:00
/
01:36:47
Subscribe
Share

 Blog")