This is an edited edition of our latest live stream.
The original edition is also available here: https://youtu.be/pWgSs72muBk including live chat replay.

Digital Finance Analytics (DFA) Blog
"Intelligent Insight"
This is an edited edition of our latest live stream.
The original edition is also available here: https://youtu.be/pWgSs72muBk including live chat replay.

We have updated our Core Market Models and scenarios with the latest household financial stress data to the end of September 2020.
We discussed this in our live show last night:
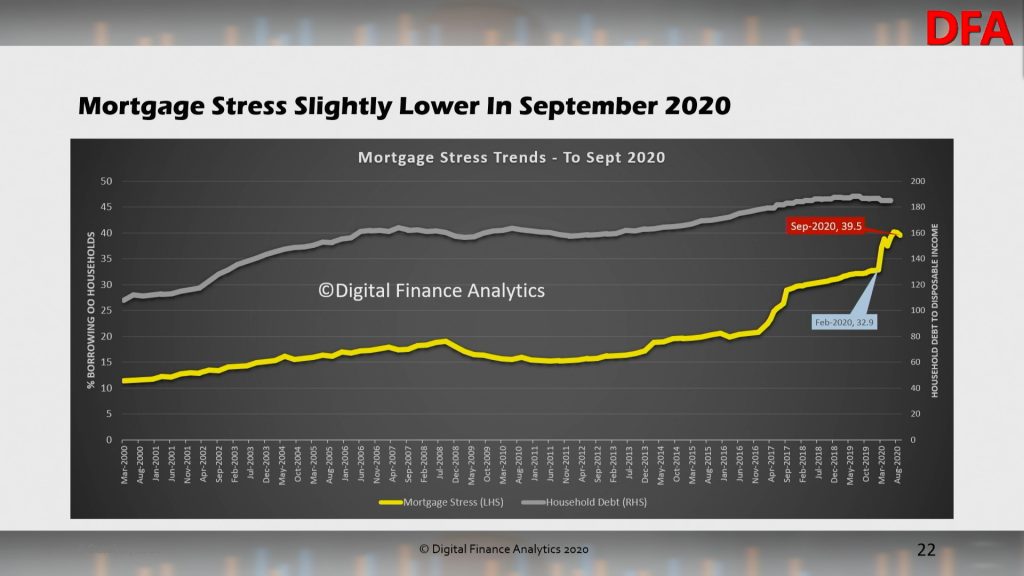
Overall mortgage stress eased back to below 40% of borrowing households at 39.5%. But it remains very high. This is measured in net cashflow terms.
The RBA household debt to income ratio eased back as loans are paid down.
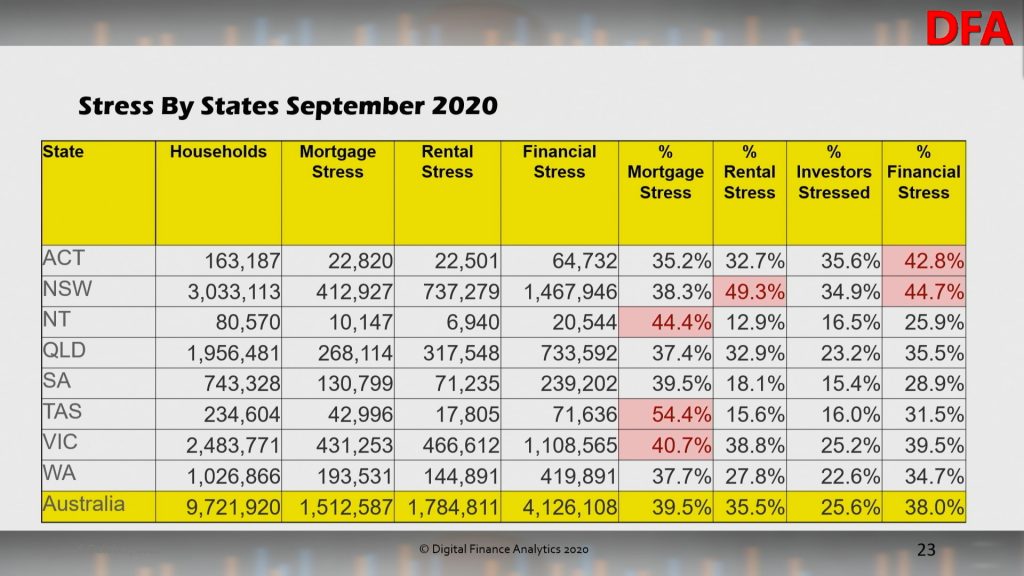
Across the states, mortgage stress is highest (in percentage terms) in Tasmania, NT and Victoria. Rental stress is highest in New South Wales. Overall financial stress (including mortgage, rental and investor stress) is highest in ACT and NSW.
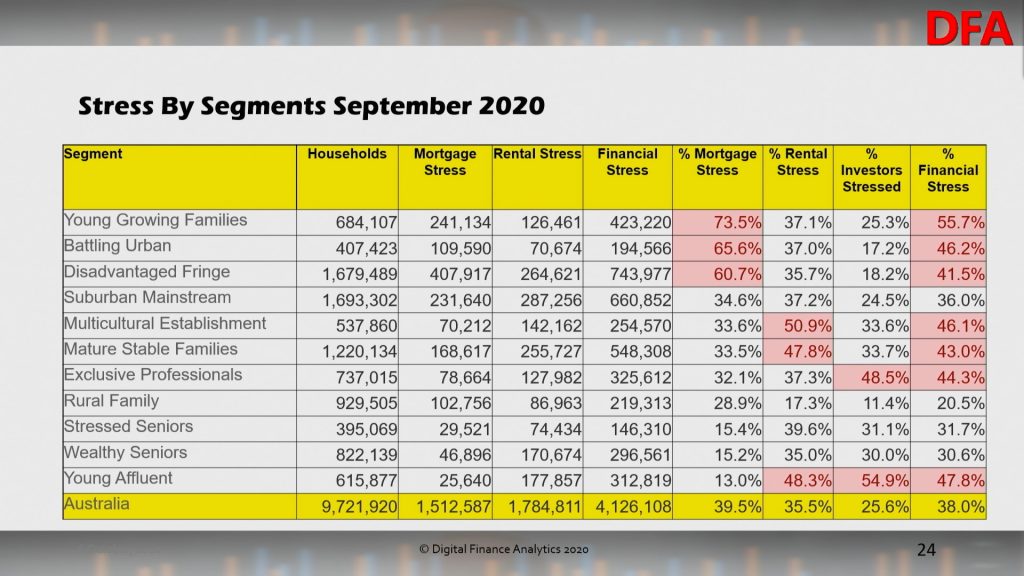
Across our household segments, young growing families (which include first time buyers) are most exposed, together with households on new estates on the edges of our towns and cities. Rental stress is highest among first generation migrants, while investor stress is highest among most affluent households who are highly leveraged into investment property.
As a result aggregate financial stress is dispersed across many of our segments, indicating this is a real structural problem.
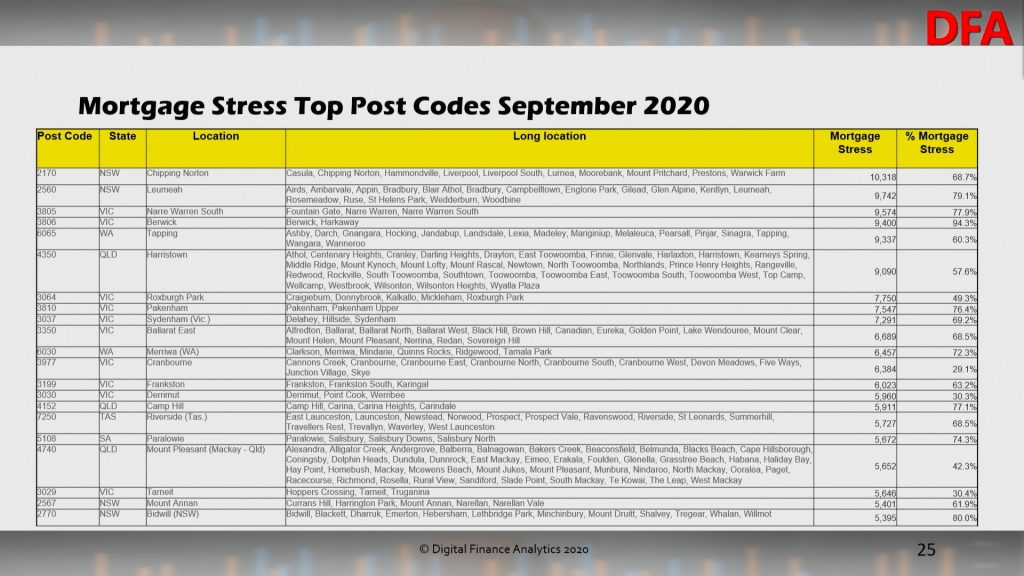
Top post codes by mortgage stress:
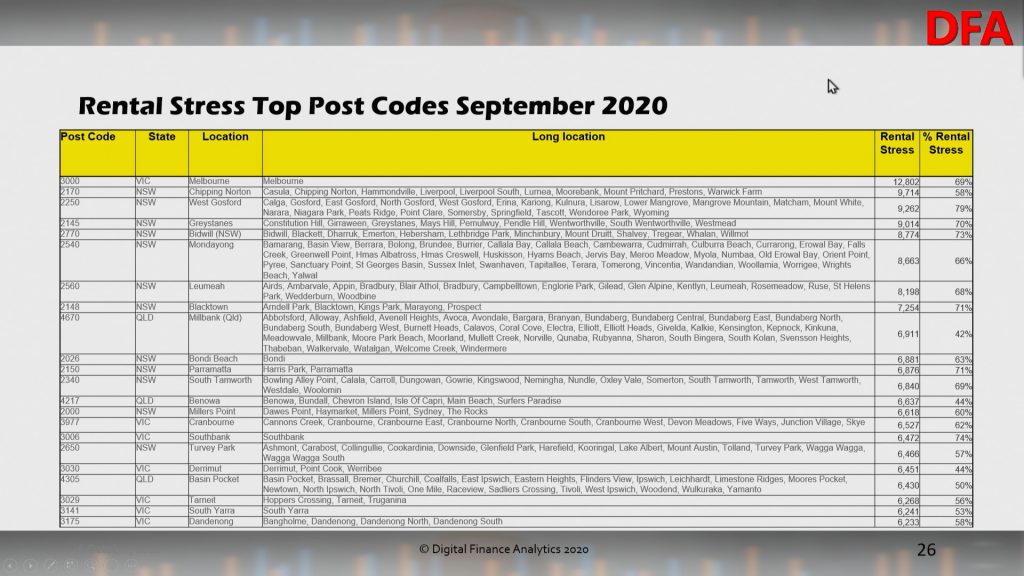
Top post codes by rental stress:
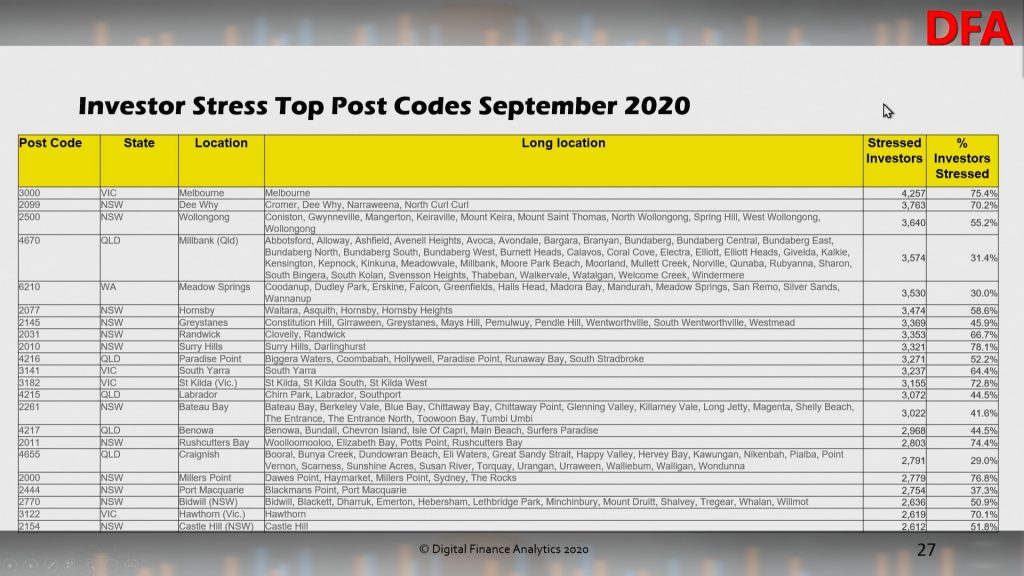
Top post codes by property investor stress:
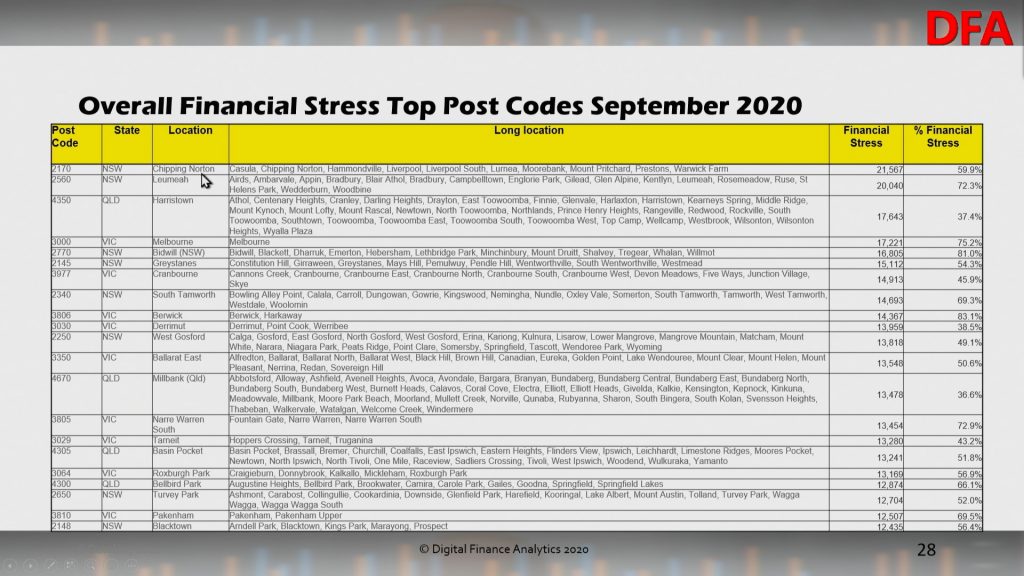
Top post codes by overall financial stress:
As we discussed in our post last night there is a strong correlation between mortgage stress and high counts of JobSeeker claims. Melbourne is an example:
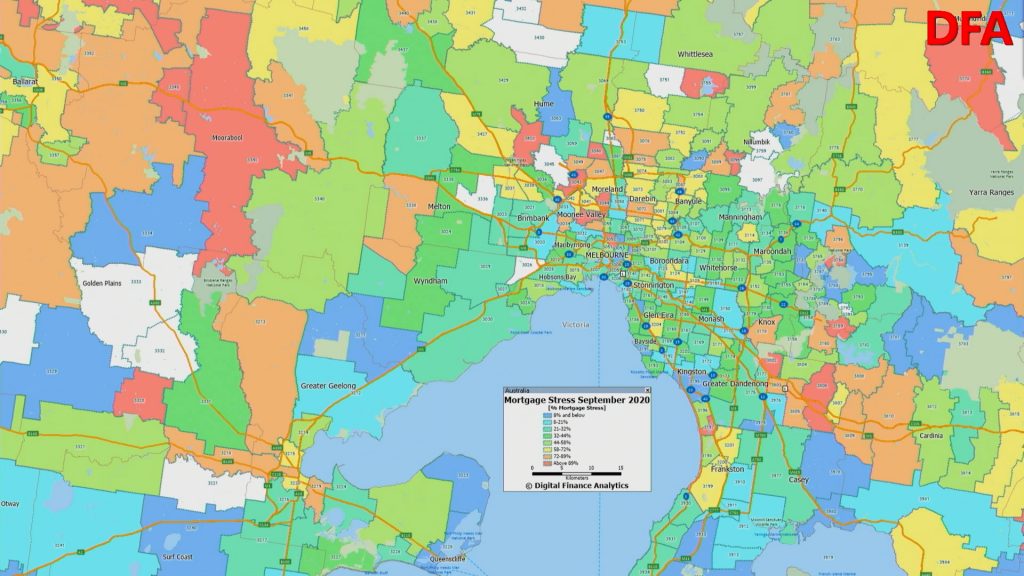
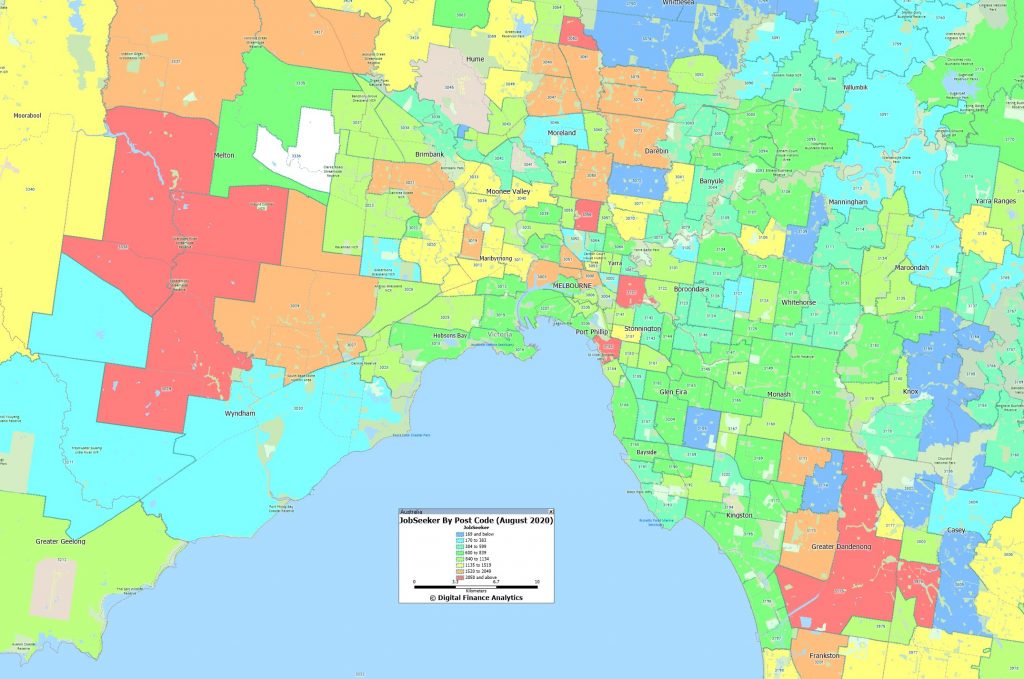
As the mortgage repayment holidays dry up we expect stress to remain high even if job growth recovers. This is a structural issue which will not be solved with more generous lending standards. Only real income growth would assist, but this seems unlikely for some time to come.
Join us tonight at 20:00 Sydney for a live discussion on our latest research and analysis. You will be able to ask a question live via the YouTube chat. We will also have our post code tool online.
This is the edited edition of our latest live stream with Damien Klassen.
Join us for a live Q&A as I discuss the current market environment with Damien Klassen from Nucleus Wealth. We will also discuss their property calculator, which I think is one of the best out there.
https://nucleuswealth.com/property-calculator
Original show with chat replay is here: https://youtu.be/GSTYE7WK92o

This is the edited edition of our latest live stream with Damien Klassen.
Join us for a live Q&A as I discuss the current market environment with Damien Klassen from Nucleus Wealth. We will also discuss their property calculator, which I think is one of the best out there.
https://nucleuswealth.com/property-calculator
Posted on by Damien Klassen
Before COVID-19 hit, Nucleus Wealth launched a property calculator. The idea I wanted to illustrate is that house prices are very sensitive to interest rates. So, with interest rates so low, property was going to be stuck in purgatory:
if the economy improved and interest rates increased then higher interest rates would cap property prices,
if the economy didn’t improve, then weak growth and already low interest rates would see property prices fall
I’ve changed my mind. Desperate times call for desperate measures. I’m pretty sure mortgage interest rates are going lower. Much, much lower.
In our house price calculator, we had a minimum mortgage rate setting of 2%. It should have been much lower. We just changed it to 0.5%.
Impossible? Japan has mortgage interest rates below that. So does Germany. Ditto France. And there is a decent probability the rest of the developed world is destined for the same.
The mechanism is already set up in Australia. The Reserve Bank of Australia has begun providing three-year funding to banks at 0.25% for mortgages. Banks can probably use this money to go below 2% for three-year loans. And that is just the beginning.
It started in April with an “initial” funding allowance for banks. Then an “additional” funding allowance. Now there is a “supplementary” one.
There is clearly a risk of running out of adjectives to describe the bank funding. But there is no risk of running out of the desire to keep the property market ticking over with low interest rates and oodles of credit. The Treasurer’s announcement last week requesting banks to start lending irresponsibly confirmed that for anyone who still doubted.
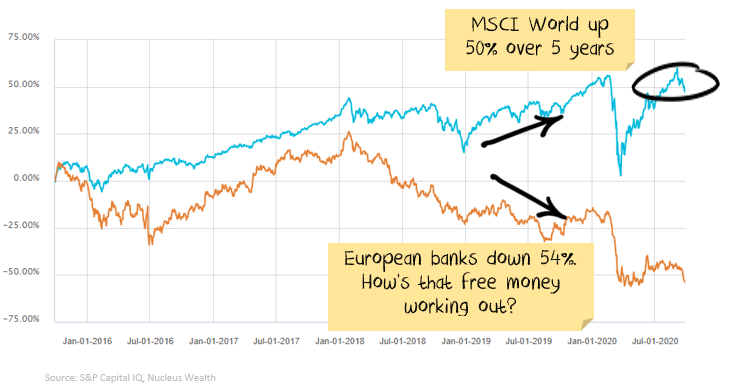
Europe has already paved the way. The European Central Bank started with 0.1% funding for banks in 2014. By 2016 the rate was -0.4%. Now, -1.0%. Yes, the central bank will pay commercial banks up to 1% if they can just find someone (anyone!!!) who will just borrow the money.
Nope. It is the flat yield curve problem smashing bank profitability, I’ve posted about it several times.
Don’t think of it as free money for banks. Think of it as life support so that the banking industry doesn’t collapse.
Keep in mind that I’m talking about forecasting residential property in aggregate – not individual houses or suburbs.
There are significant links between property prices and the availability of debt. The financial crisis showed this internationally. The Royal Commission into banking showed this in Australia. When the amount of debt available rises, so do property values. When debt slows down, property values fall.
The Federal Government is hellbent on forcing more debt onto borrowers. The Reserve Bank of Australia is providing the funding. Credit is available.
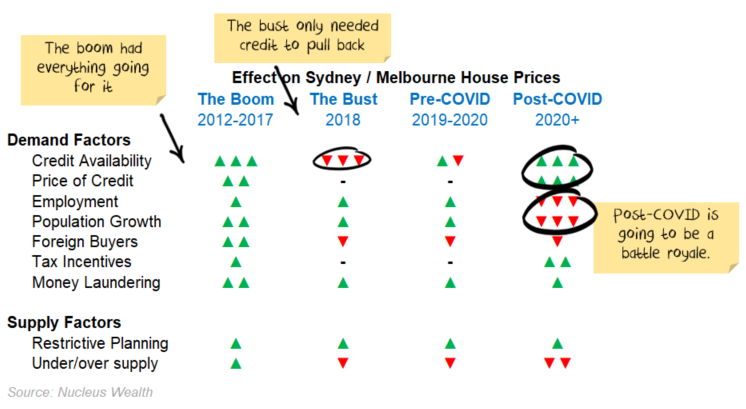
I’m going to argue four other factors also constrain how high or low property prices can go. These are the four factors you can use to forecast property prices in our online calculator:
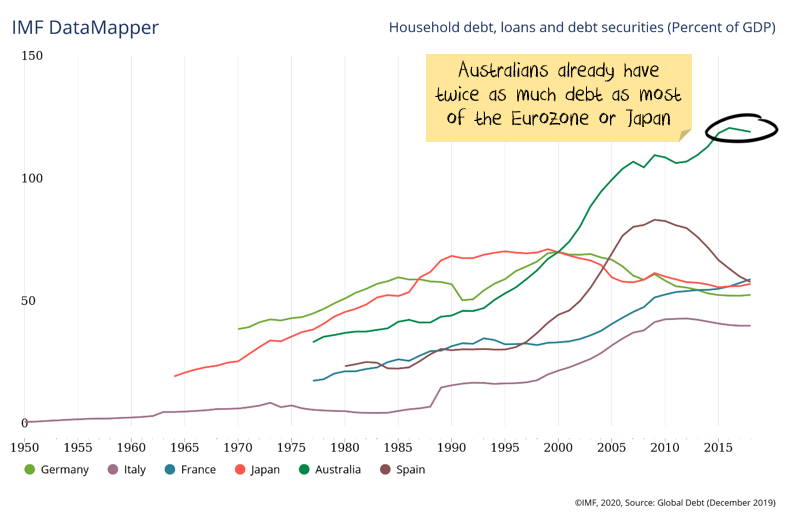
Strap yourself in for moral hazard. We already have the world’s 2nd highest consumer debt, about double most Eurozone countries. If interest rates can fall further and the shackles are off the banks for responsible lending, then who knows how much more indebted we can become?
It is a fascinating showdown.
On the one hand, we have plummeting immigration, massive unemployment, eviction moratoriums to deal with, bankruptcies to deal with and a larger private debt burden that just about any other country.
On the other, we have a burning political desire to keep house prices high, pump more debt into the economy and a roadmap to much lower interest rates to help.
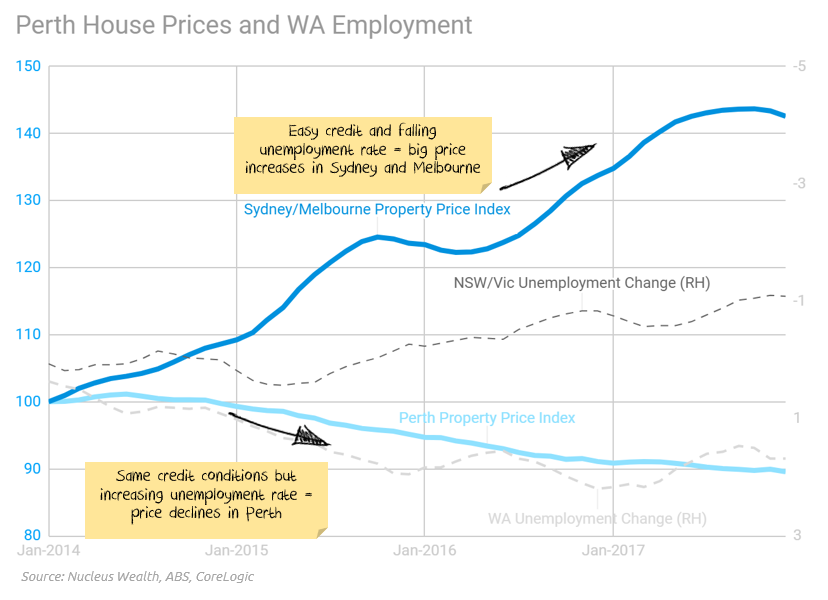
As a reminder, in Perth from 2014 to 2018 we saw free credit (pushing prices higher) meet rising unemployment (pushing prices lower). Rising unemployment won:
The best hope for housing bulls is that the interest rate falls come before the rent eviction moratoriums, interest repayment holidays and bankruptcies hit full stride. This might spark a mini-house price boom. The worst outcome for housing bulls is that the interest rate falls don’t come until after house price falls gain too much momentum. I think the negative outcomes are the default setting at this point, the burden is on the Reserve Bank and the government to do more. Either outcome is possible, but a negative outcome seems more likely. Keep in mind that we have already locked ourselves into low interest rates for the next decade. If the government gets its wish for more household lending and lower interest rates, there may not be another interest rate increase for a generation. Or until a Modern Monetary Theory loving politician is elected.
The net effect (see individual city data below for more info) is:
The cost of a mortgage relative to the cost of rent is about average in Sydney and Melbourne. In Brisbane and Perth, the cost of a mortgage is cheap relative to the cost of rent. Both rents and mortgage costs are likely to continue to fall, but mortgage costs can fall further, improving affordability.
The cost of a mortgage relative to wages is about average in Sydney and Melbourne. It is cheap in other cities. The problem is two-fold: (a) wage growth is not going to be high (b) unemployment is high. A positive longer term sign for house prices, a negative shorter term sign.
House price to wages are close to historical highs in every city except Perth.
Rental yields are close to historical lows in every city except Perth. Eviction moratoriums and rental declines are not helping investors.
PS: I will be on the Digital Finance Analytics YouTube channel with Martin North in a livestream on at 20:00 on 29 Sep 2020 to discuss these factors and more: https://www.youtube.com/watch?v=GSTYE7WK92o
The chart on the left shows how each of the ratios used for forecasting in the property calculator have changed over 40 years. The histogram on the right shows the distribution of the same ratio over the 40 years.
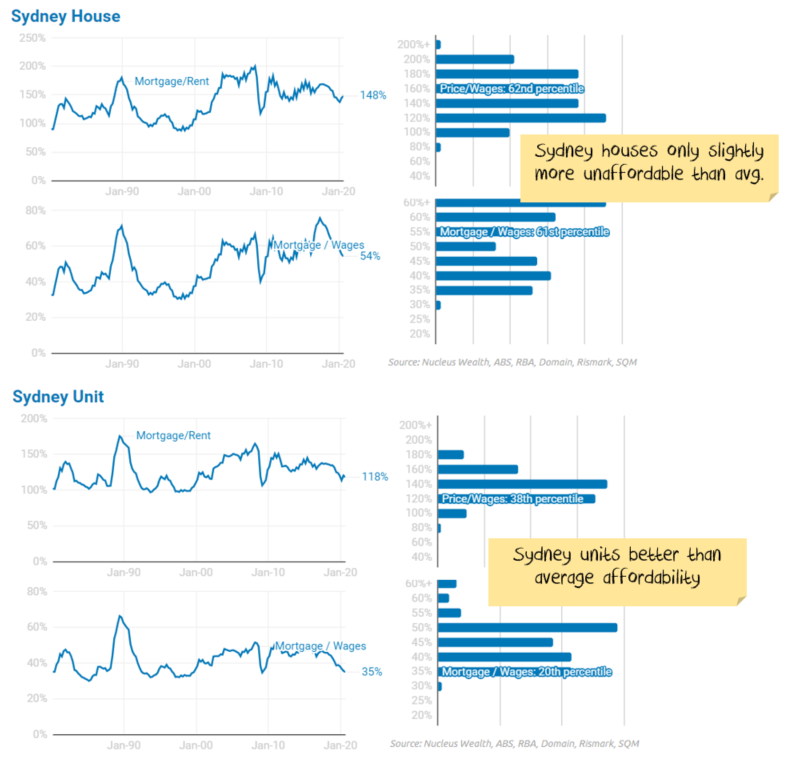
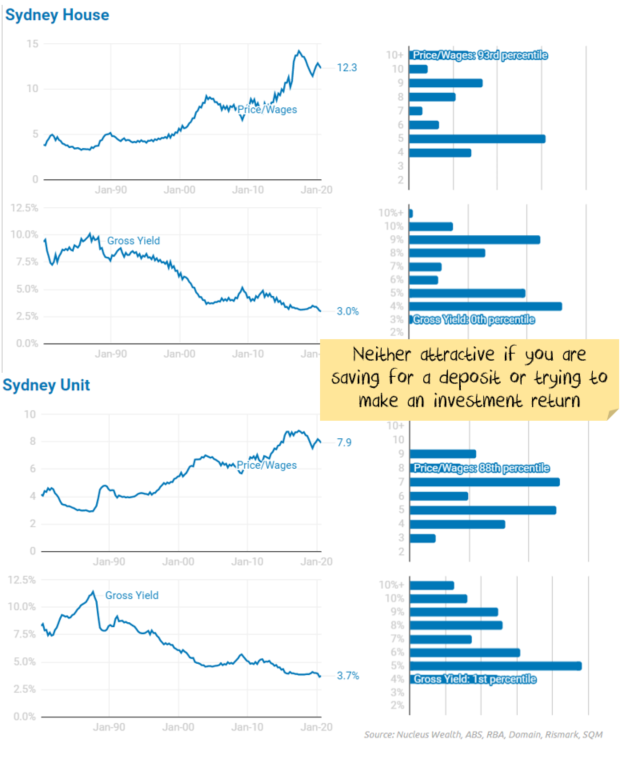
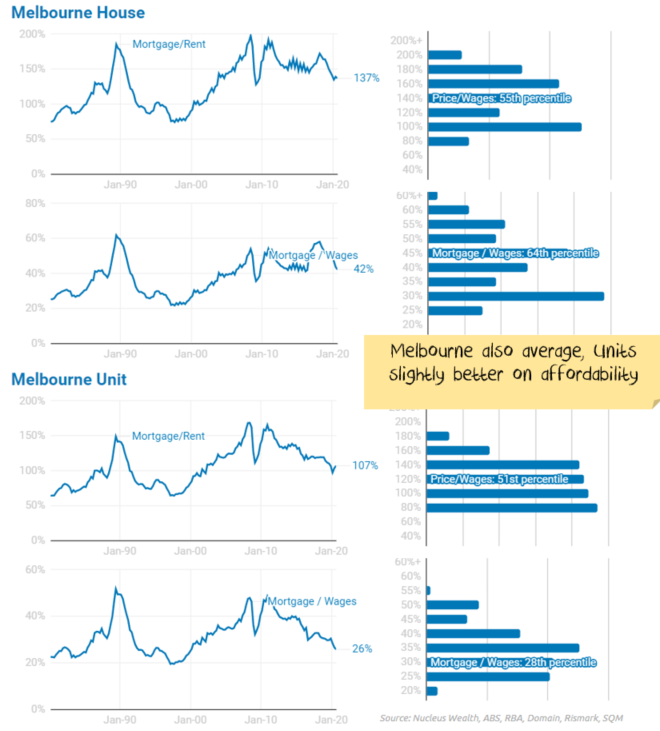
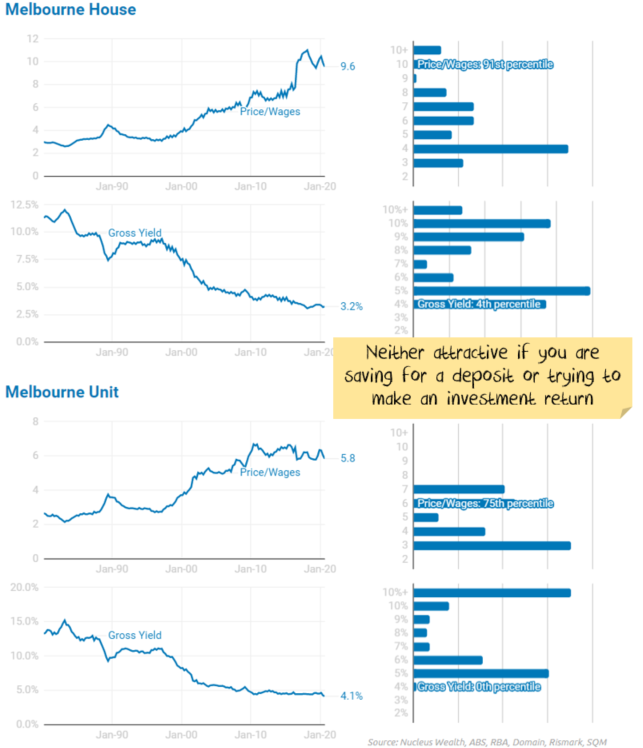
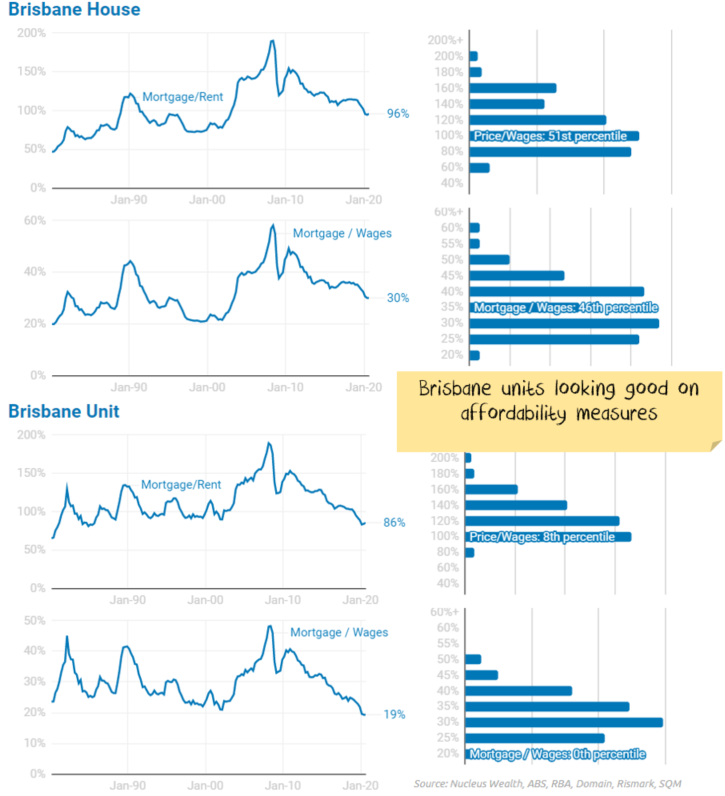
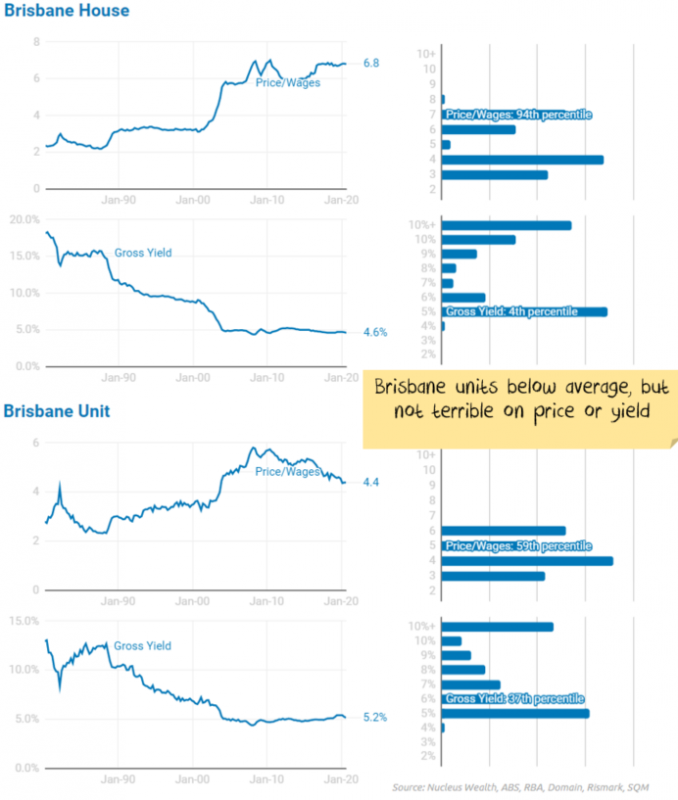
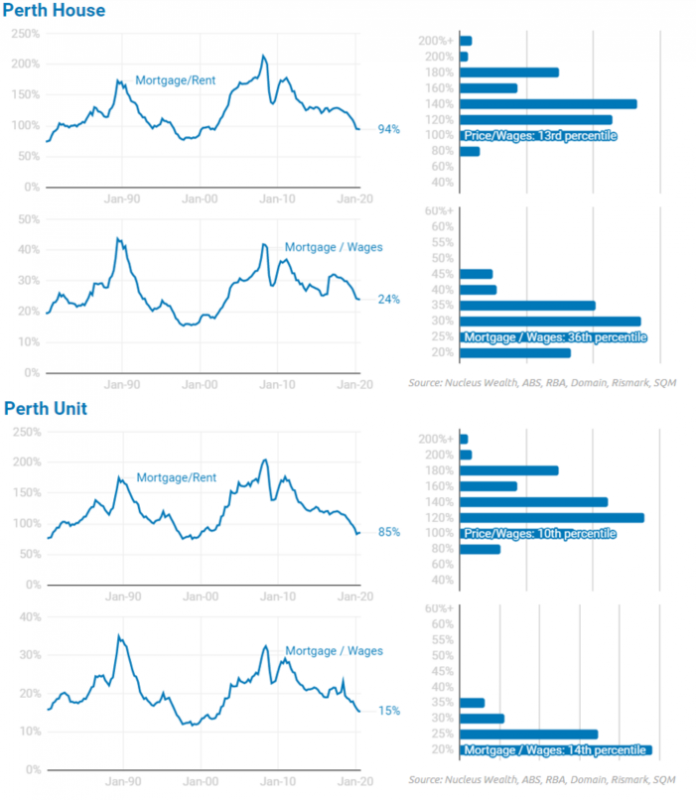
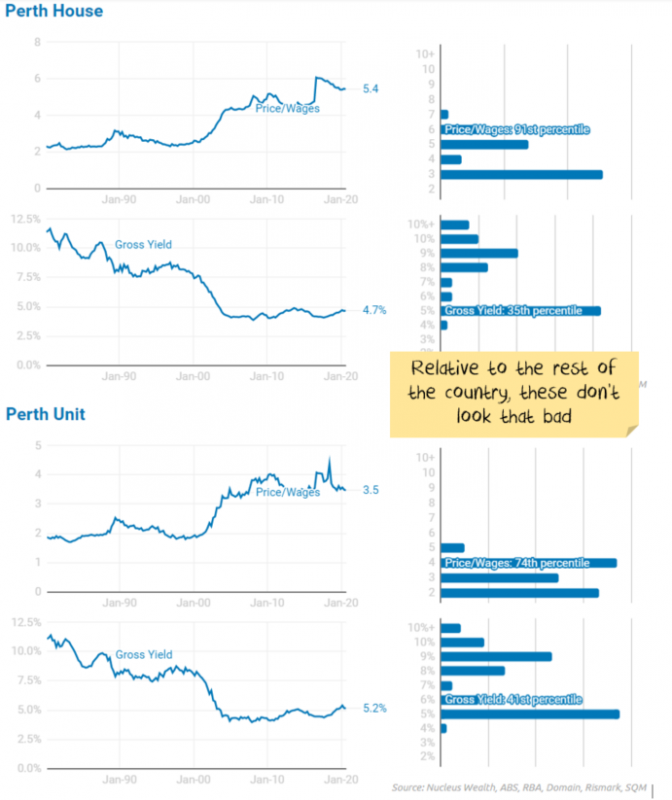
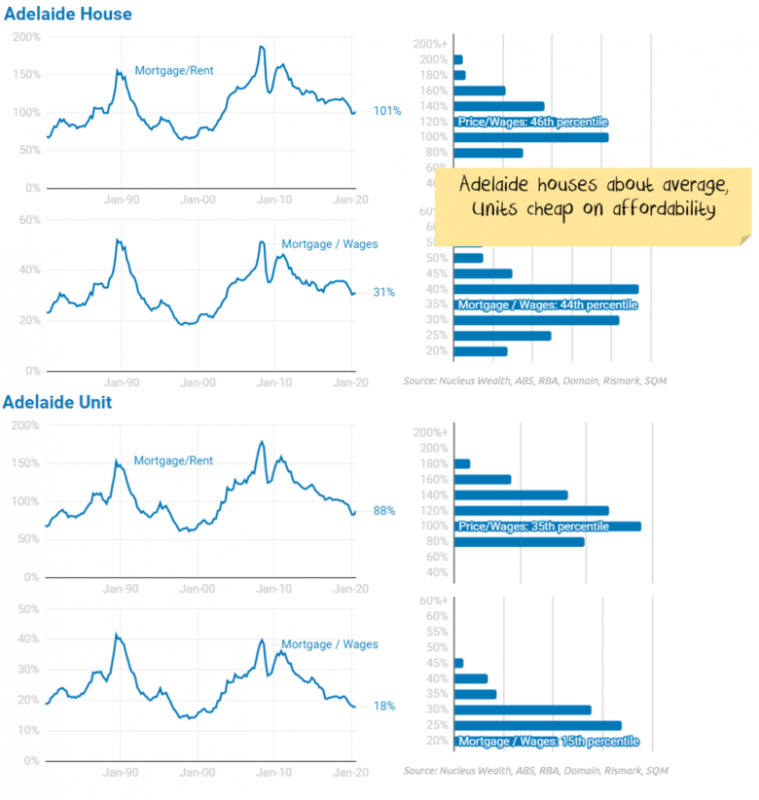
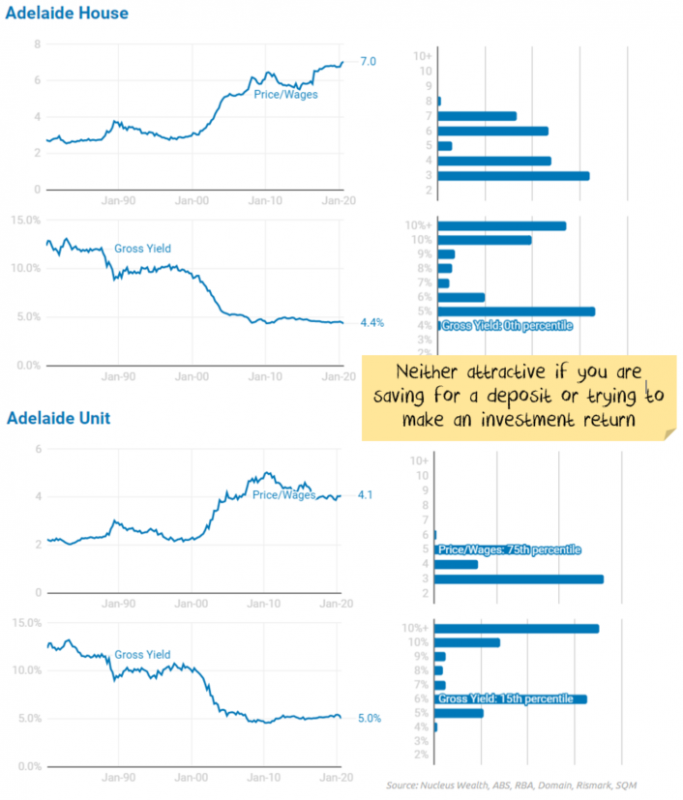
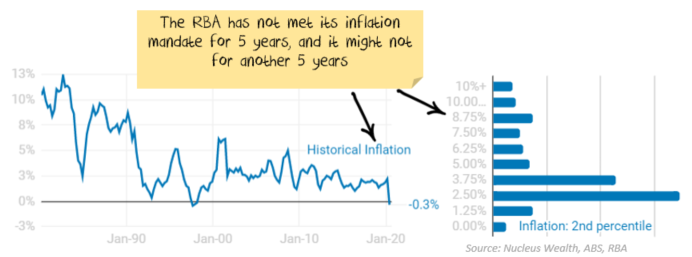

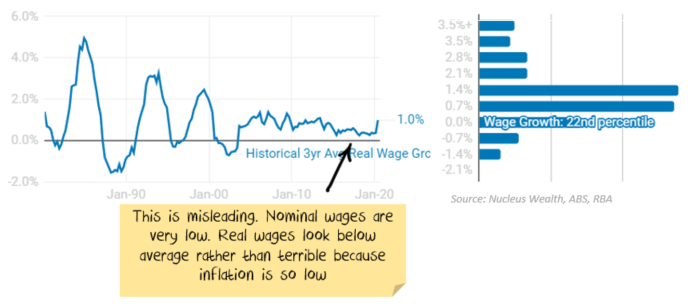

Nucleus Wealth has compiled this data using a range of different sources.
For property prices and rents we use a Domain for more recent data quarterly data, cross checked with SQM and Rismark to fill any short term moves. For older data we use Australian Bureau of Statistics data to fill timeseries.
For economic data we use either Reserve Bank of Australia or Australia Bureau of Statistics data. For older data we have had to estimate some factors due to differing definitions over time.
Join us for a live Q&A as I discuss the current market environment with Damien Klassen from Nucleus Wealth. We will also discuss their property calculator, which I think is one of the best out there. You can ask a question live, or ahead of time via the DFA Blog.
Damien will be discussing his view of much lower mortgage rates ahead, and the implications for property, and bank investors. It is the flat yield curve problem smashing bank profitability. Think of it as life support so that the banking industry doesn’t collapse.
This is an edited edition of our latest live event. We had an NBN failure so the discussion with Chris was curtailed. Chris can be found at wealthful.com.au.
Original version with live chat here: https://youtu.be/HNAQtcT6TtQ
We have released the latest edition of confidence measures based on our surveys. You can watch our live stream replay where we discuss the results in detail.
The overall index recovered a little in August, but remains well below the 100 neutral setting at 76.56.
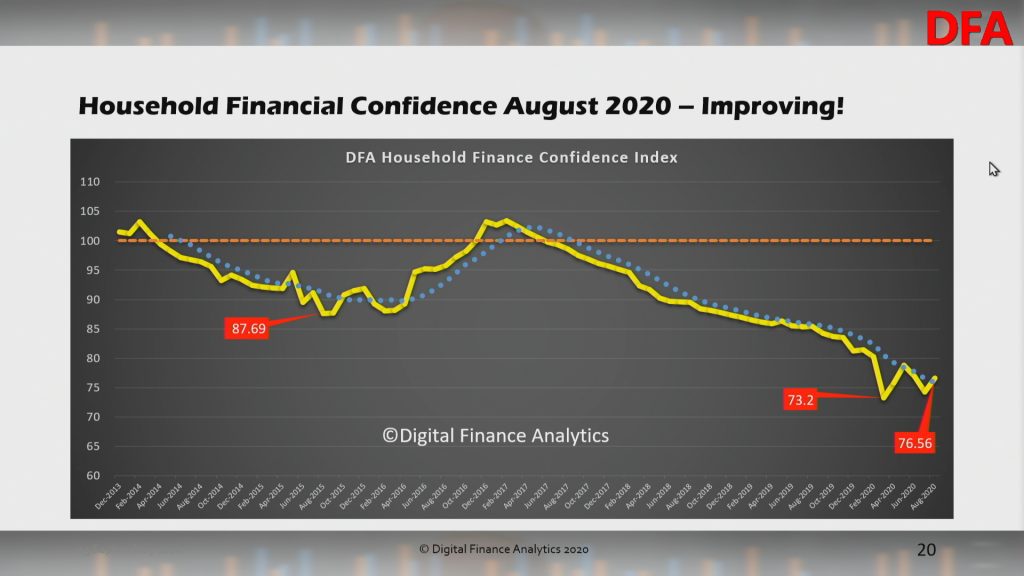
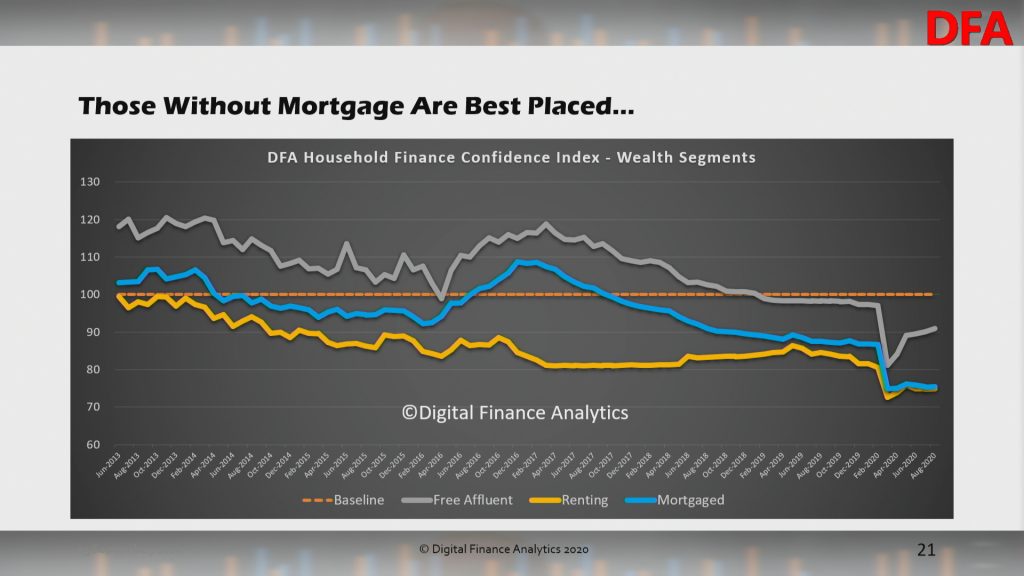
Within the cohorts, more affluent and mortgage free households are best placed, thanks to continued strength in stock markets. Those with mortgages and those renting, not so much. The massive levels of Government support, plus repayment holidays also helped, together with significant superannuation withdrawals.
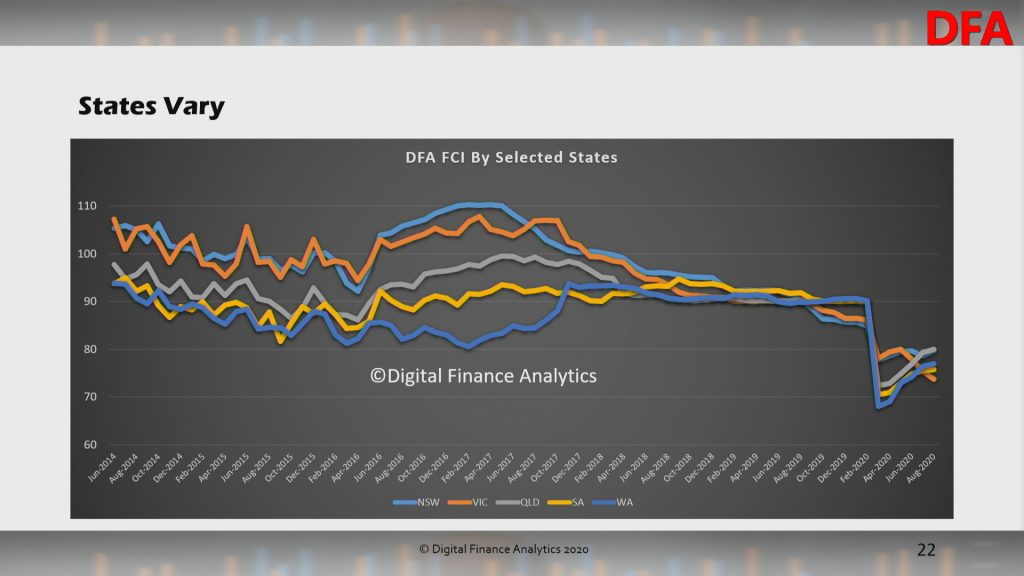
The state variations are striking, with a further fall in Melbourne in response to the latest lock-downs, while WA is looking stronger.
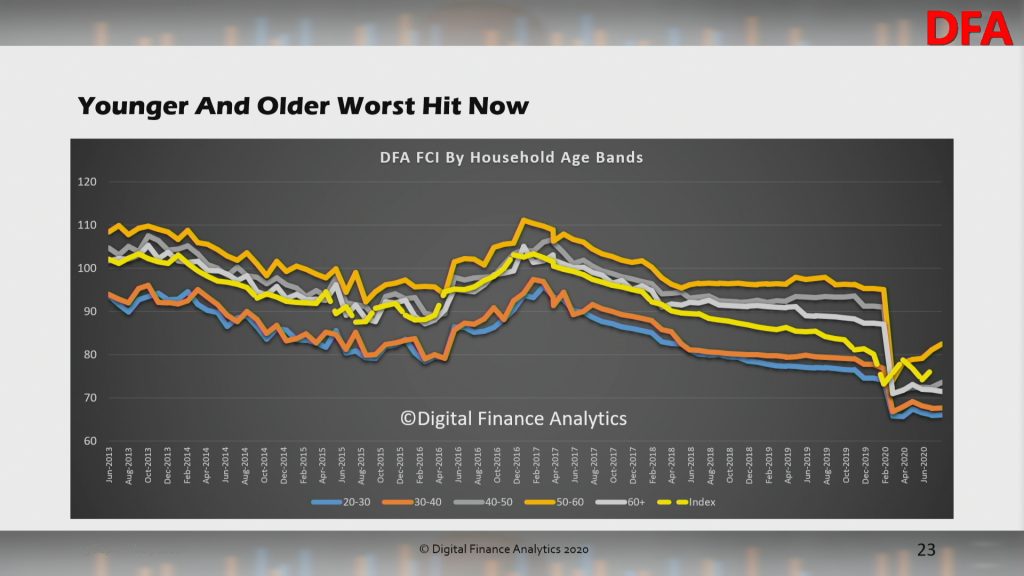
Across the age groups, younger and older households are more exposed, while late middle aged households, who have more financial resources, and less mortgage debt, are more positive.
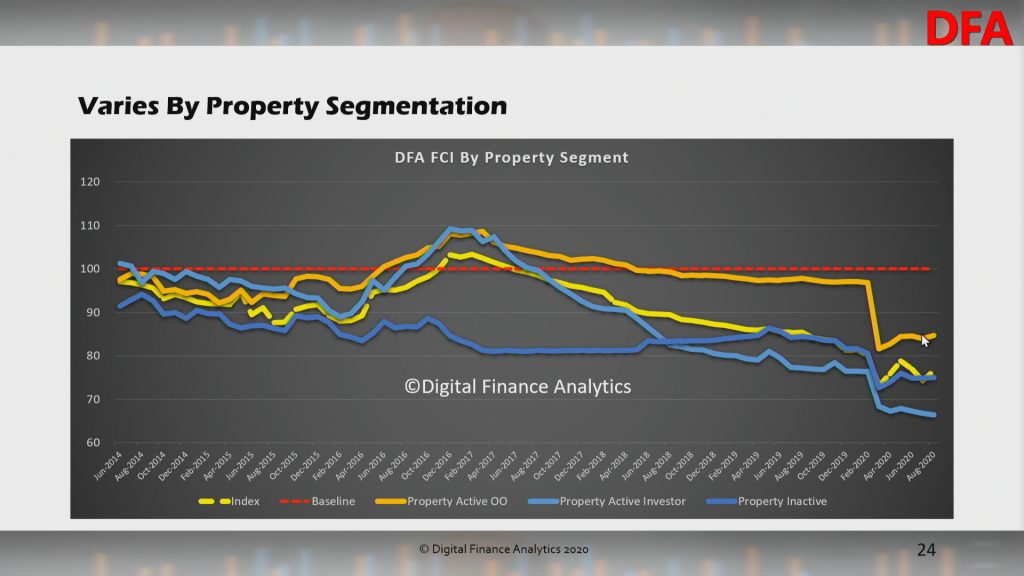
Across the property segments, owner occupied property holders are more positive relatively speaking, thanks to lower mortgage rates – this despite higher mortgage stress. However, property investors continue to wrestle with poor returns, limited capital growth, and pressure to commence repayments on mortgage balances. Many are still considering disposing of property in the months ahead. Renters are caught with more limited income, despite rents slipping in some areas. There is also concern in this cohort about the status of deferred rentals down the track.
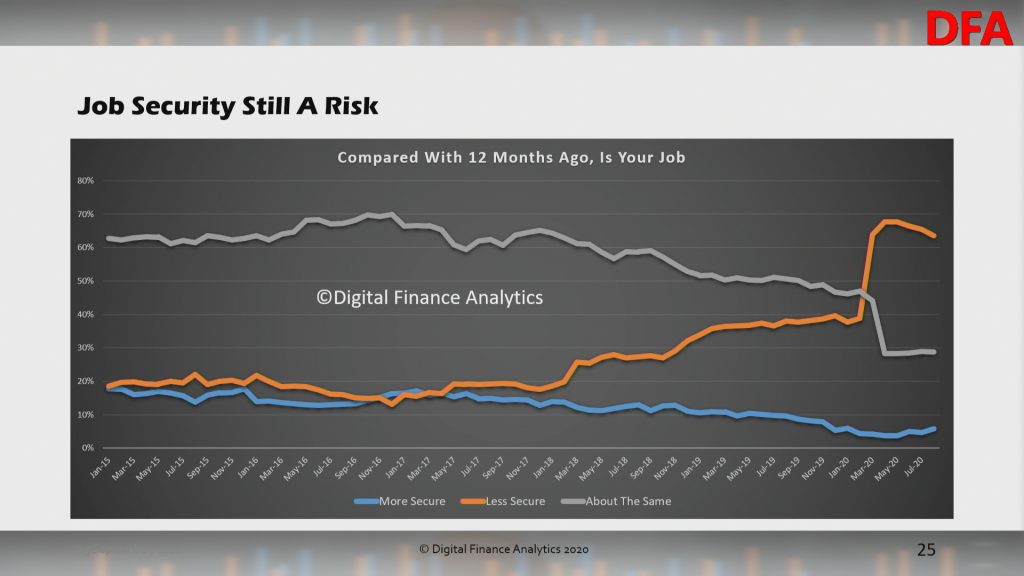
Within the moving parts of the index, job security remains a significant issue, though there was a slight easing in some areas, while in Melbourne things have degraded significantly. Many self-employed households are under severe pressure, with up to one in three concerned about the future of their business.
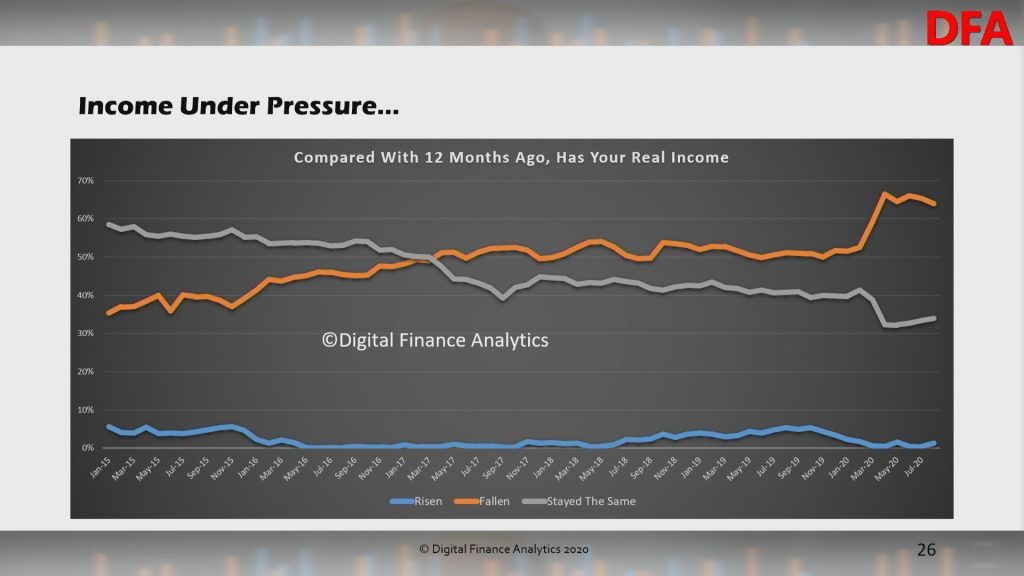
Income pressures remain to the fore, despite JobKeeper and JobSeeker. Some households have received higher incomes, though these will be reducing in September. Others have received no support despite income compression. The majority suggest real incomes have declined in the past year.
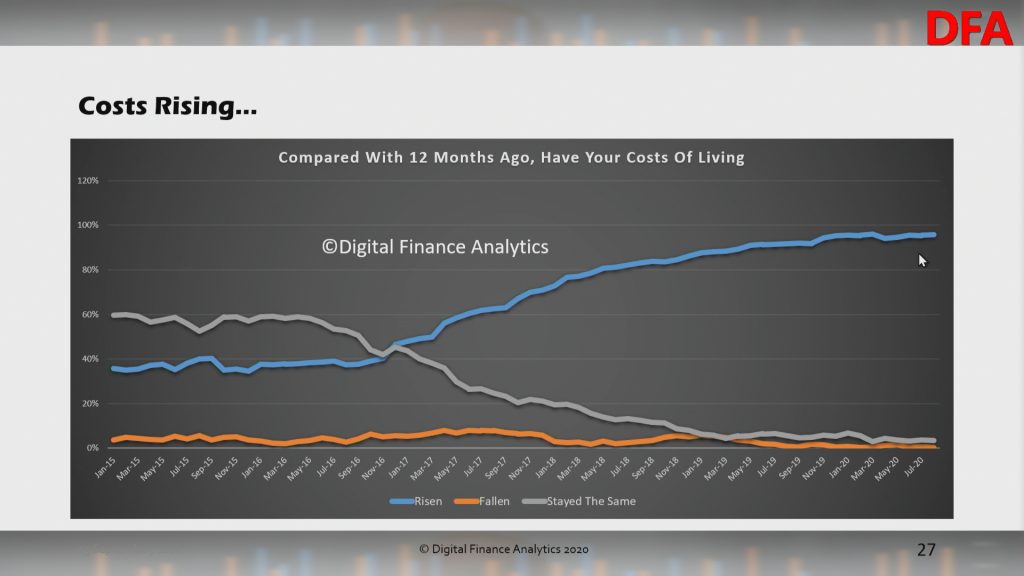
Costs of living continue to run above the official CPI figures. Food staples appears to be rising quite fast, despite lower spending by some households on transport and petrol. School fees and health care costs also figure.
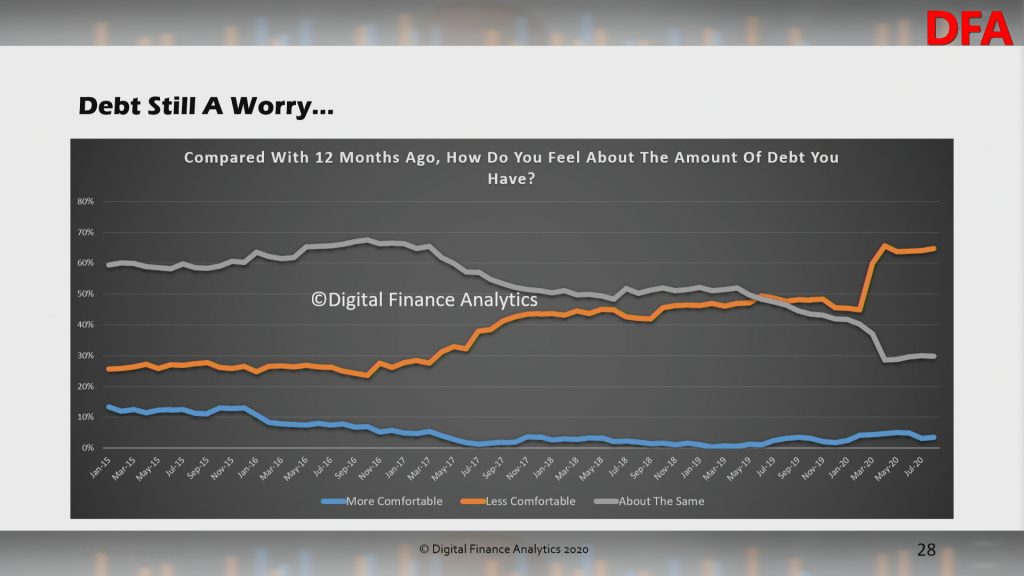
Households are under considerable debt pressure despite the current repayment holidays. Given income pressures, meeting future debt commitments registered as a significant risk. This is consistent with high levels of mortgage and rental stress.
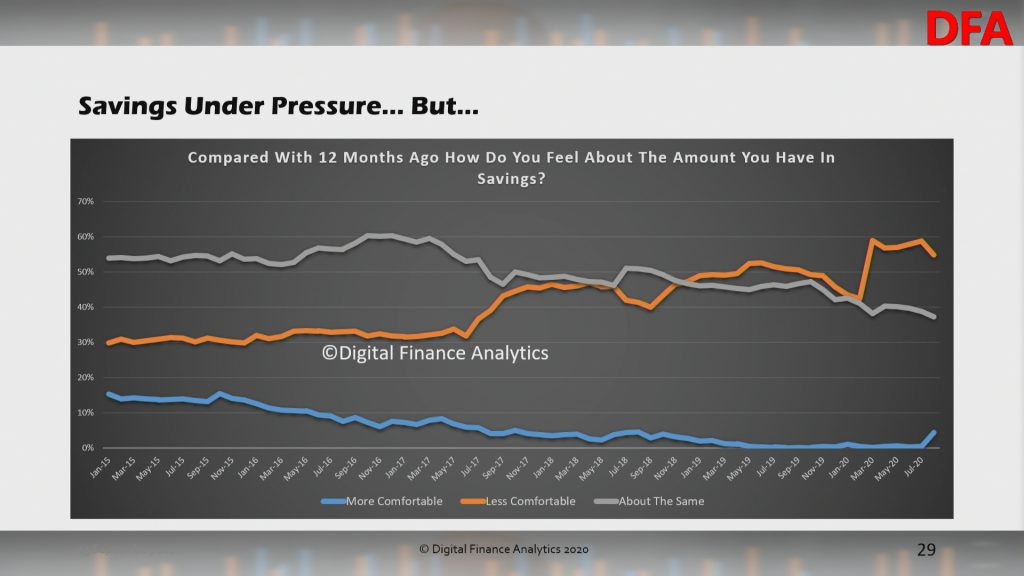
On the other hand, those receiving additional support, pulling money from superannuation, or repayment holidays are saving hard, as a hedge against future uncertainty. That said, many Australians reliant on income from bank savings continue to see their ability to service debt crushed by close to zero returns on deposits. Buy Now Pay Later facilities are in vogue to spread the costs of purchases, and as a way to manage cash flow. About 20% of users end up paying late costs, making this “free” credit expensive.
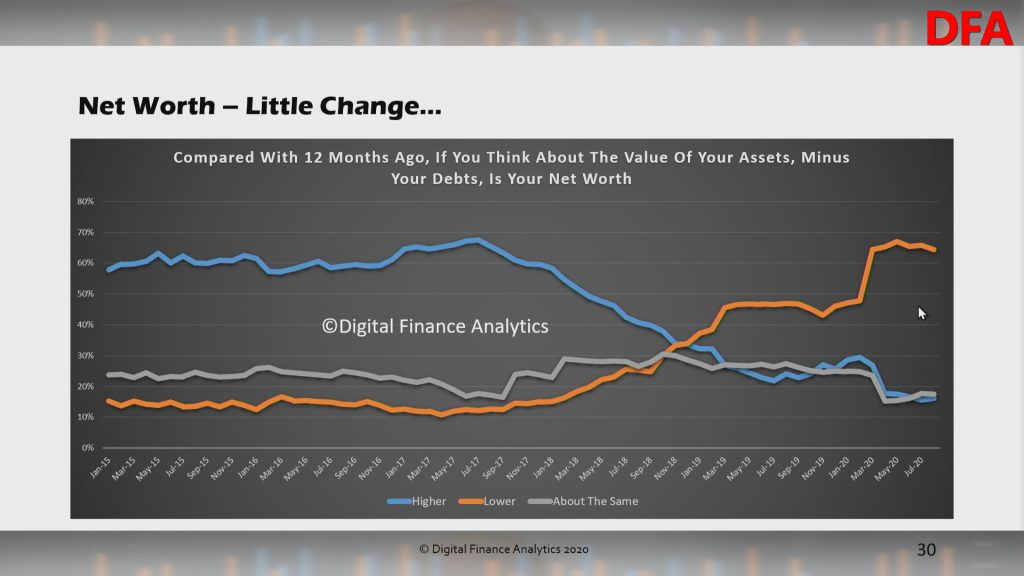
Finally, net worth remained relatively static as the elements in the index shifted. There is considerable confusion in the minds of many households who hold property, given the mixed data available about the property market. Many still believe the Government will stop home prices falling. Nevertheless, households remain cautious ahead of the impending cuts in support, and this does not bode well for greater consumption ahead. The major pain point is small businesses, may of whom have not been able to benefit from JobKeeper. This should be a focus for the Government in the upcoming budget.
An edited edition of the live show.
The original stream is also available with live chat.

Join me tonight at 8pm Sydney for this weeks DFA live stream. We will be updating our latest survey results, looking at the RBA minutes out today, and we will also have our post code database online.
You can ask a question live via the YouTube chat and join the discussion.