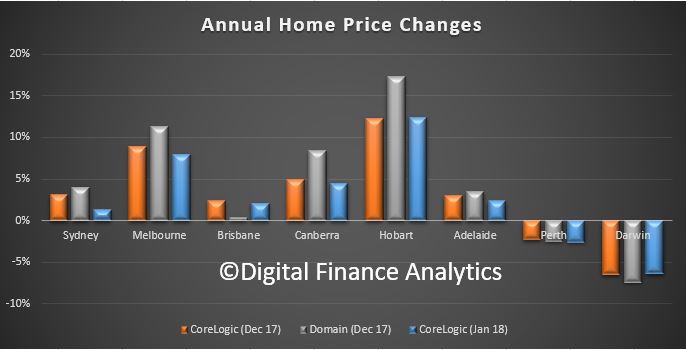
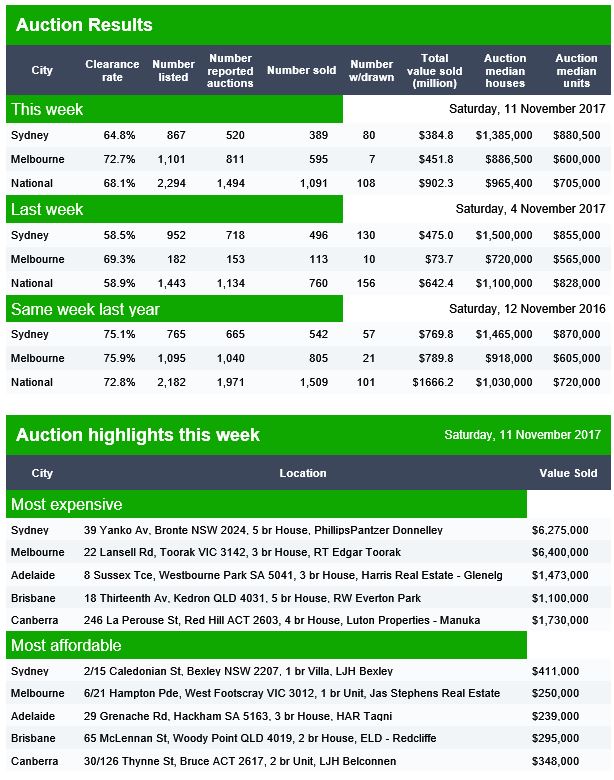
The latest data from Domain highlights the difference between the Sydney and Melbourne home prices movements. The question is, will Melbourne follow Sydney’s lead, and slow in the months ahead, or chart a different path?
Sydney’s median house price, $1,179,519, increased by 0.5 per cent over the quarter and 4 per cent over the year.
HSBC chief economist Paul Bloxham said Sydney was getting less support from international and domestic migration compared with Melbourne. “A cooling in investor interest has also been more apparent in the Sydney market.”

The gap between house prices in Melbourne and the harbour city continues to narrow. Over the latest quarter the difference was reduced to $276,000, the lowest in three years.
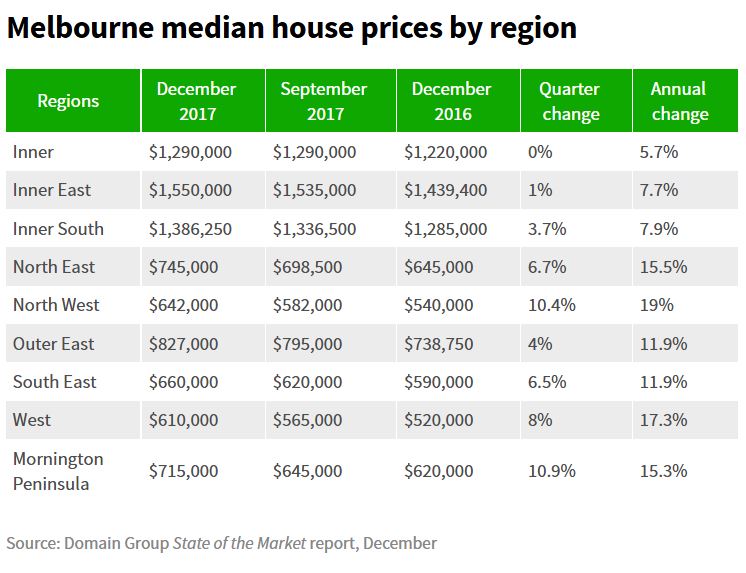
Melbourne’s median shot up 3.2 per cent to $903,859 in the December quarter, according to the Domain Group’s latest State of the Market report. Prices have risen every quarter for nearly five and a half years.
Market Economics managing director Stephen Koukoulas said “even though there has been a bit of a tightening in credit for investors, in terms of the amount that is lent and interest-only loans, it doesn’t appear to have had a significant impact in Melbourne”.
Melbourne was again a strong performer compared to most other capital cities, with only Hobart and Canberra posting higher growth.
Domain Group data scientist Nicola Powell said Melbourne’s most affordable regions — the west, north west and south east — had recorded the strongest price growth off the back of heightened first-home buyer activity.
 Worth also noting that the strongest growth areas are also the highest in terms of mortgage stress, according to our analysis. So household debt remains extended, and the risks are rising.
Even in the CBD, a market many consider to be overheated, prices for apartments climbed 1.9 per cent over the December quarter,. But compare this to a significant fall in Brisbane apartments, so it is important to get granular when examining the data.
Brisbane unit prices have continued their downward slide, down to $385,955; a fall of 2.2 per cent for the quarter and 4.4 per cent for the year. Here units are actually at a four-year low, it’s the steepest yearly fall since June 2001. Domain says “we’re starting to see developers start to respond to the oversupply, they’re delaying some projects and not starting some either”. Greater Brisbane’s lacklustre performance, as revealed in the latest Domain Group State of the Market Report, shows median house prices have fallen by 0.6 per cent across the five LGAs, which include Brisbane, Ipswich, Redland, Moreton Bay and Logan, to $548,918.
Hobart has been declared the unlikely star of Australia’s 2017 property market, charting a stellar 17.3 per cent growth rate in house prices, putting the usual mainland glitterati into the shade. Domain Group data scientist Dr Nicola Powell agrees. The strong inter-state migration to Hobart for both lifestyle reasons and the affordability of homes is driving up prices steadily to today’s record Hobart median house price of $443,521, she believes. And with the latest December 2017 quarter alone showing a price surge of 10 per cent, there’s no relief in sight.
Domain reports Canberra’s median house price surged by 5 per cent over the December quarter to a new record high of $753,516. The Canberra growth rate was the highest recorded of all the capitals with the exception of Hobart where the median increased by 10 per cent over the quarter.
But the resources slump turned Darwin into the country’s worst performer with a 7.4 per cent drop in its median house price to $565,696 and a 14 per cent plunge in its unit price to $395,279. It also hit Perth, with a house median fall of 2.5 per cent to $557,567, and its units 1.7 per cent to $369,402.
Perth’s median house price grew 0.5 per cent to $557,567 during the December quarter. However, prices fell 2.5 cent compared with the previous year. In the unit market, median prices grew one per cent to $369,402 – a 1.7 per cent decline year-on-year.
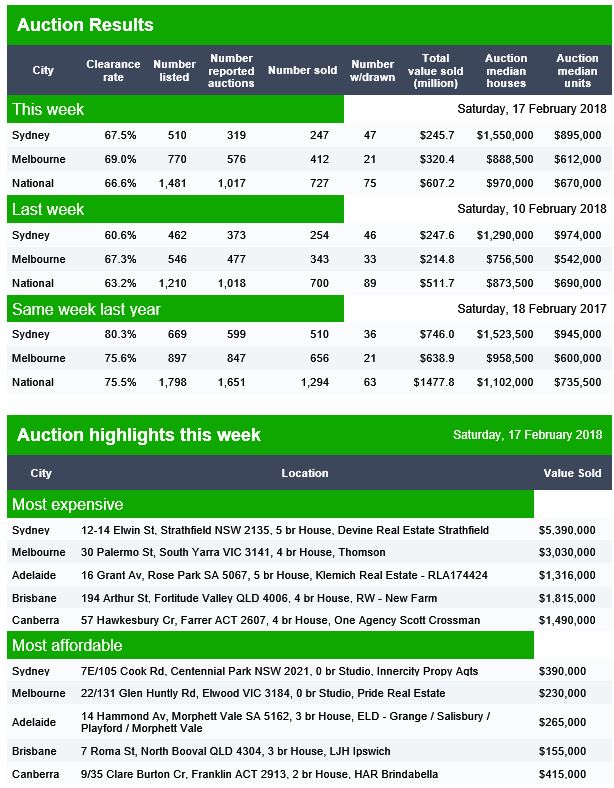
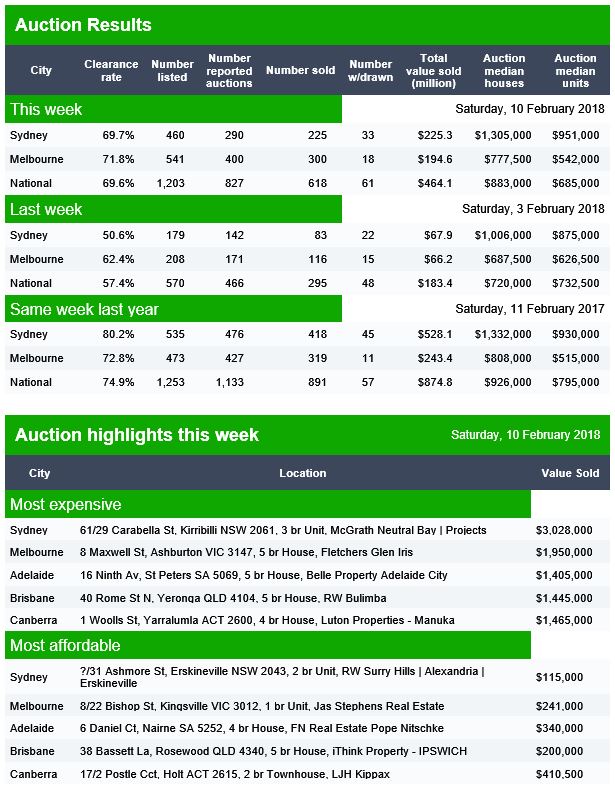
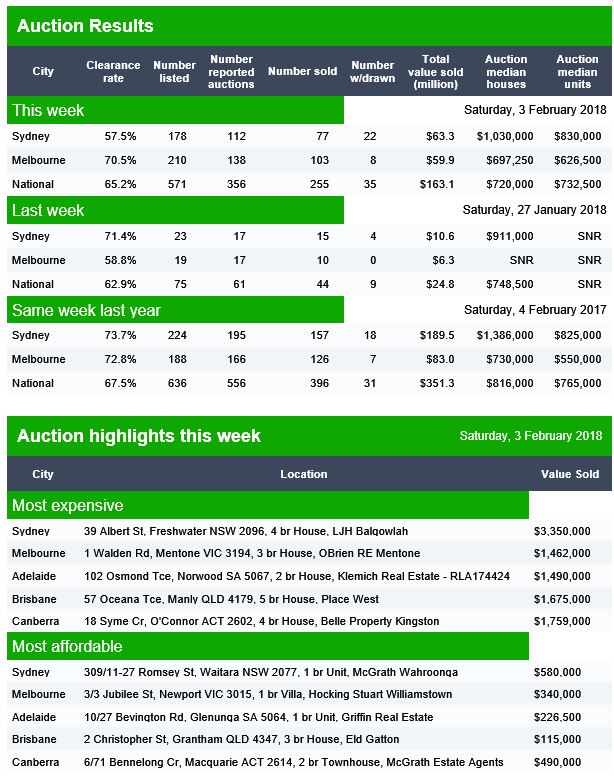
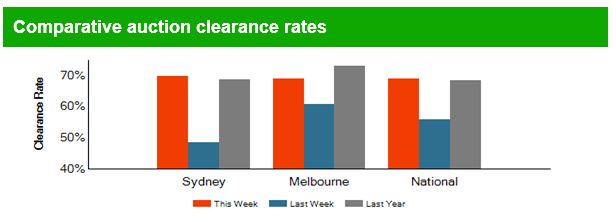
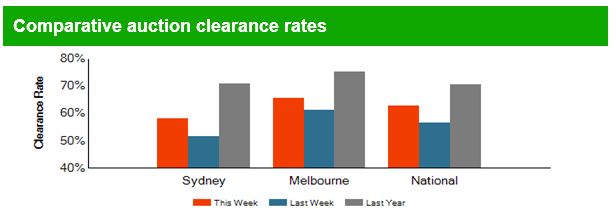
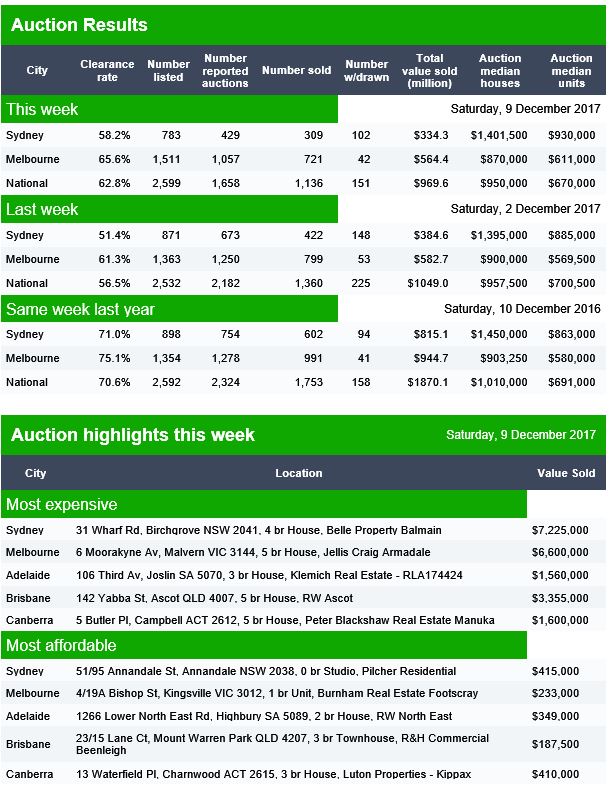
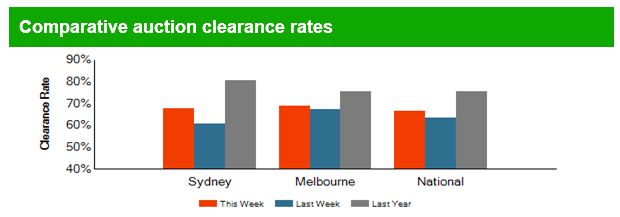 Brisbane cleared 42% of 92 scheduled auctions, Adelaide 69% of 50 auctions and Canberra 57% of 59 scheduled auctions.
