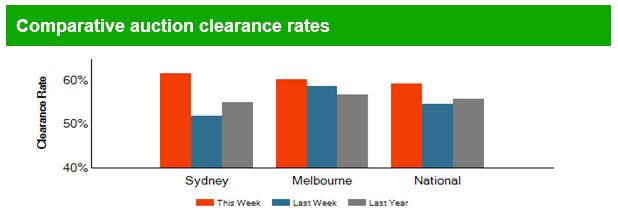
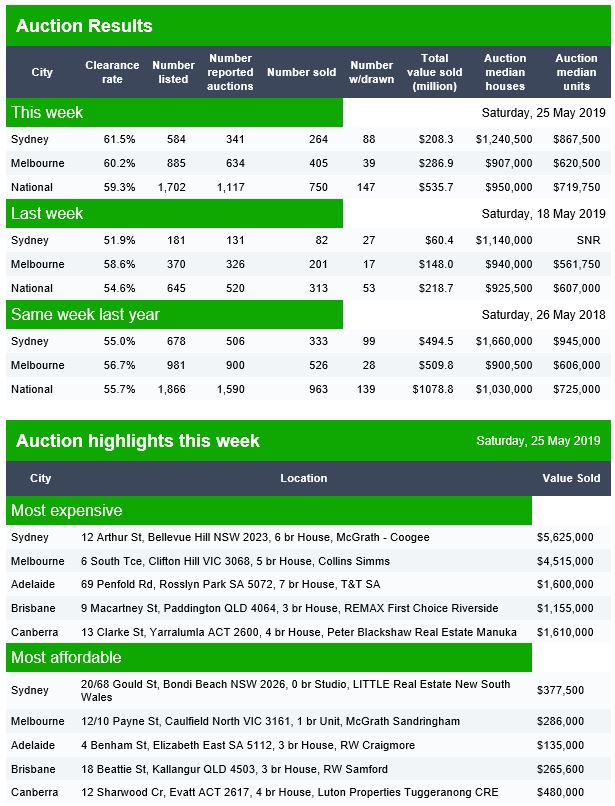
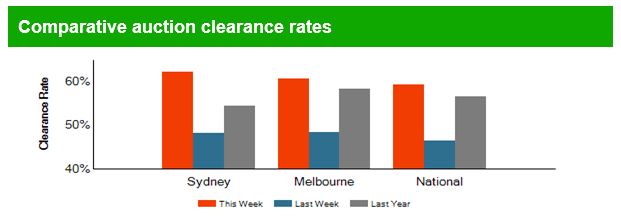
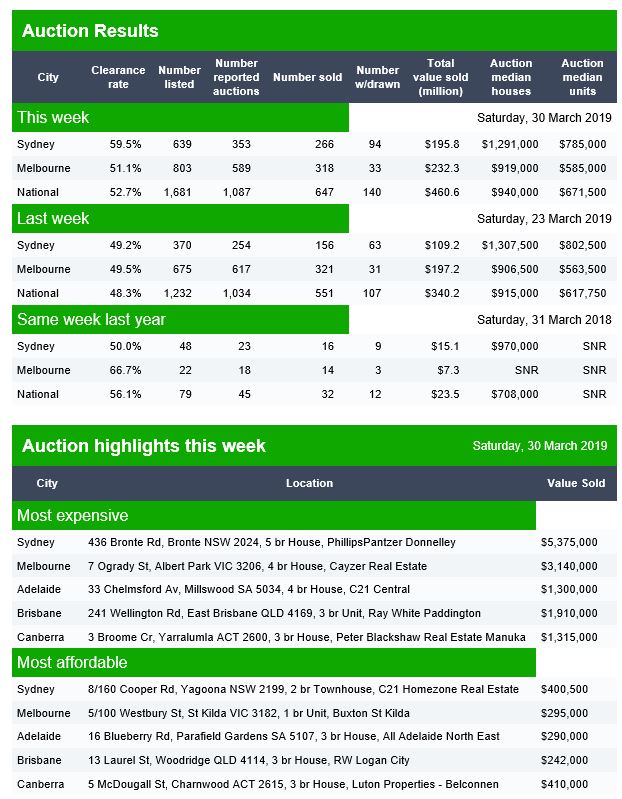
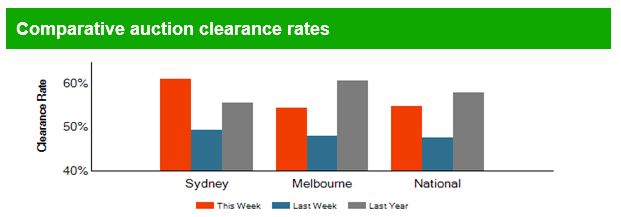
Last week the clearance rate ended in the mid-fifties, on low volume. Of 645 listed auctions, 313 sold given a true reading of 48.5%. Lower than last year. The question now is, will momentum lift given the APRA, RBA and Government incentives to get people to buy property again? We will see….
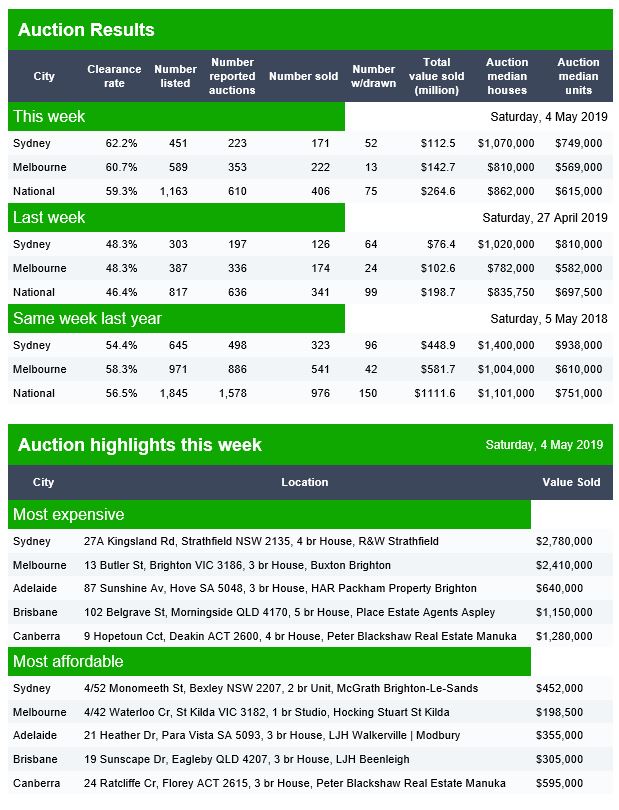
Brisbane listed 99, reported 55 and sold 27 with 8 withdrawn giving a Domain clearance of 43%.
Adelaide listed 84, reported 44 and sold 26, with 10 withdrawn giving a Domain clearance of 48%.
Canberra listed 50, reported 43 and sold 28, with 2 withdrawn giving a Domain clearance of 62%.
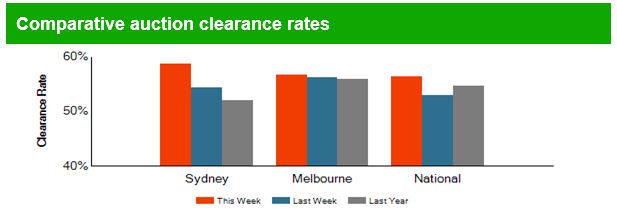
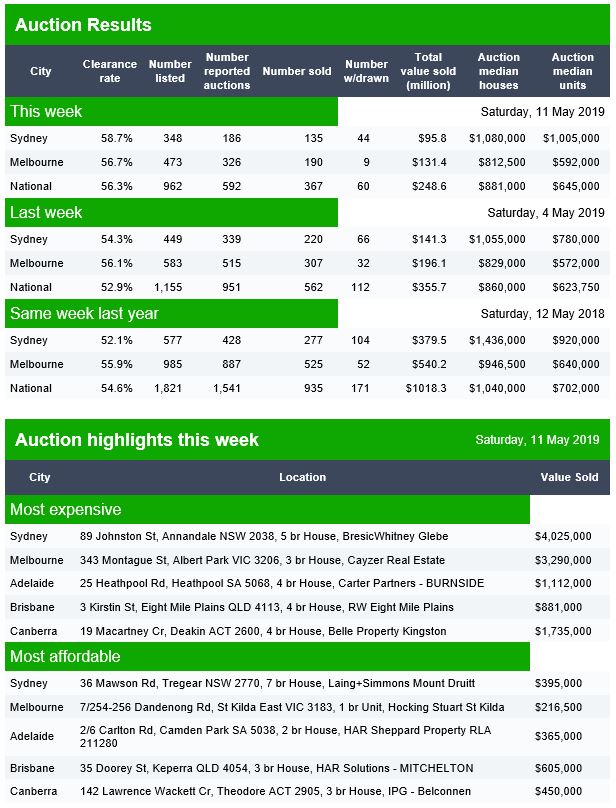
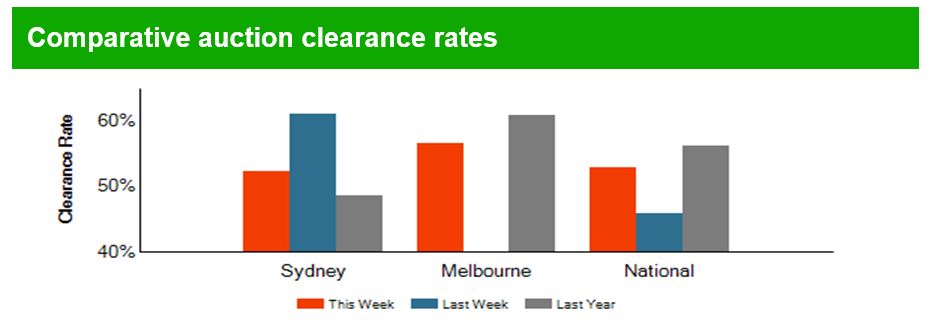
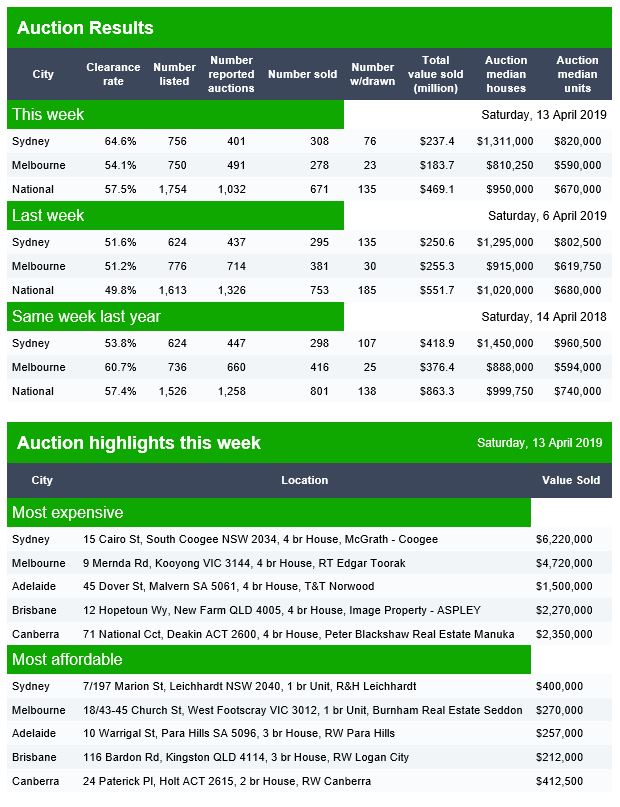
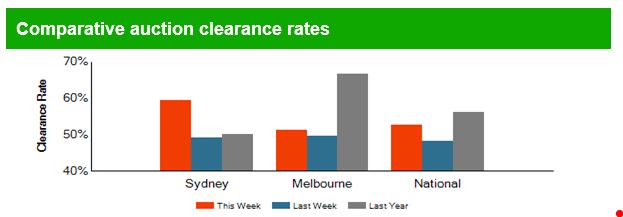
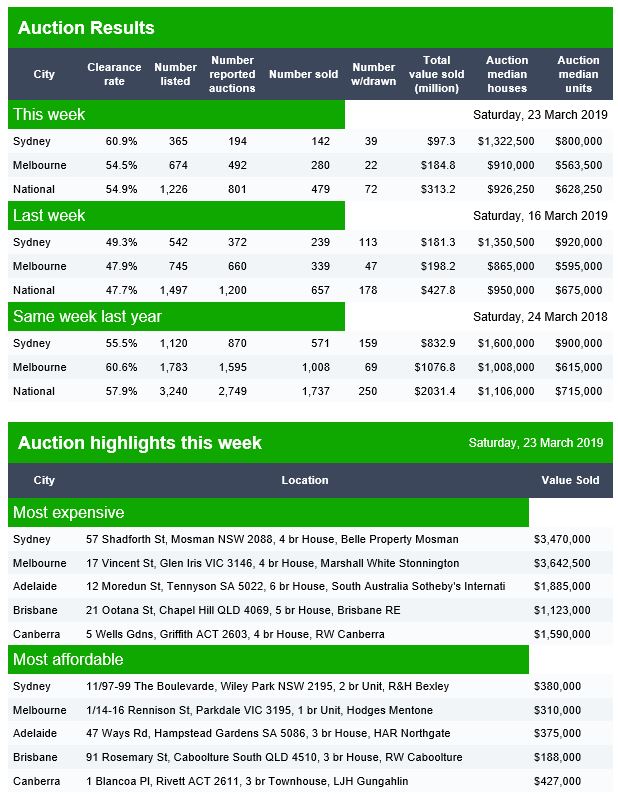
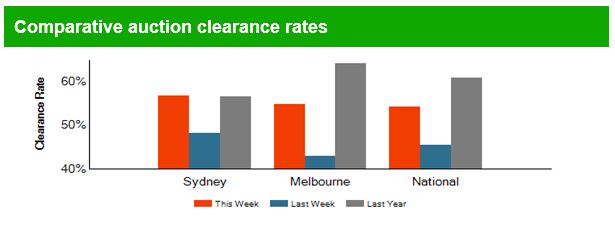
Last week final clearance rate was 52.9%, of the 1,155 listed 562 sold. This week again on low volumes, the markets are reporting slightly stronger numbers, but only 367 from 962 are reported, and this time last year 1,821 were listed. So we can see the markets are hardly buoyant!
In Brisbane 52 were listed, 31 reported, 12 sold and 2 withdrawn, giving a Domain clearance of 36%.
In Adelaide, 60 were listed, 26 reported and 20 sold with 4 withdrawn, giving a Domain clearance of 67%.
In Canberra 29 were listed, 23 reported and 10 sold with 1 withdrawn giving a Domain clearance of 42%.
Last week saw a final clearance at 46%, well down on the preliminary result, and lower in volume and rate compared with a year ago. Large numbers of auctions remain unreported. This week may be stronger but the volume is still way down. However the early signs are not good.
Brisbane listed 54, reported 13 and sold 3 with 5 withdrawn giving a clearance rate of 17% on a Domain basis.
Adelaide listed 34 and reported 7 with 2 sold and 4 withdrawn, giving a Domain clearance of 18%.
Canberra listed 35 auctions, reported 14 and sold 8 with 1 withdrawn gicing a 53% Domain clearance.
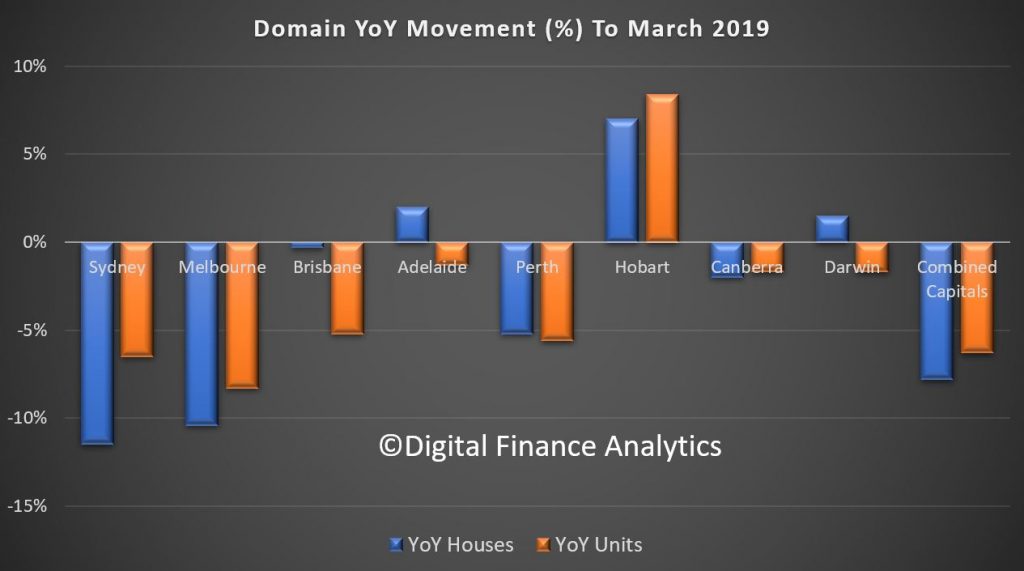
Domain has released their March quarter 2019 house price data. Sydney, Melbourne and Perth are bearing the brunt of the falls, alongside units in Brisbane, according to their statistics. Hobart remains the most buoyant but buyer interest appears to have passed its peak . And of course remember these are average figures which mask local changes.
They says that Sydney’s current property downturn is the sharpest in more than two decades. It is yet to surpass the duration of the 2004-06 slump but it is coming close to being the longest. Sydney house prices have fallen 14.3 per cent from the mid-2017 peak. If the pace of quarterly decline remains, prices are likely to dip below $1 million in the coming quarter. A six-figure median house price has not been recorded in four years. Sydney unit prices have fallen 9.9 per cent from the mid-2017 peak. For the first time in three years unit prices are below $700,000.
Despite further price deterioration to house and unit prices over the quarter, the rate of decline has eased from the quarterly falls recorded last year. House prices are now back to early 2016 and units back to mid-2015. However, house prices are 30.2 per cent higher and unit prices 20.7 per cent higher than five years ago, providing many homeowners with substantial equity gain.
Melbourne is currently facing its steepest downturn in more than two
decades. House prices have fallen for five consecutive quarters, down 11
per cent from the peak reached at the end of 2017. Unit prices have
held firmer, with price falls shorter and less severe relative to
houses. Unit prices have deteriorated for four consecutive quarters,
pulling prices back 8.3 per cent from the peak notched a year ago.
The Melbourne property market started 2019 better than 2018 ended, with auction clearance rates nudging higher (admittedly from lower volumes), views per listing rising marginally, and banks now actively seeking new business. The rate of house price declines have eased over the latest quarter.
Greater Brisbane house prices have stalled following six years of
continuous annual growth, with prices flatlining over the year.
Homeowners may not be reaping equity gain but flat house prices is a
better outcome than a fall, which is what’s playing out across most
capital cities.
The housing market remains fragmented with houses outperforming units. This has been a trend since mid-2012. Unit prices are 9.6 per cent below the mid-2016 peak, with buyers now able to reap the benefits of purchasing at 2013 prices. Significant supply numbers have weighed heavily on unit prices. Although listing volumes are shrinking, it has not been enough to translate into price growth yet.
House prices in Adelaide have bucked the national downward trend and
became one of only three capital cities to rise over the year.
Homeowners have reaped the benefit of almost six years of steady annual
house price growth. House prices may have flatlined over the quarter,
but it is the second best outcome of all the capital cities, behind
Hobart. The sustainable pace of annual growth has slowed to a
five-and-a-half year low. This weakness provides further evidence that
credit access is having an impact on markets that would otherwise have
steady growth.
Adelaide is now the third most affordable city to purchase a house, surpassing Perth’s median house price for the first time since 1993. House prices currently remain higher than Hobart, but galloping Hobart prices mean the price gap is at a 12-year low. Adelaide’s unit prices have marginally fallen from the record high achieved last quarter, but remain the most affordable of all the capital cities.
Early indicators previously displayed some encouraging signs of a
recovery in Perth’s housing market. However, over the first quarter of
this year, house and unit price falls have gathered pace. House prices
are now 14 per cent and unit prices 16.6 per cent below the 2014 peak.
Buyers continue to have the upper hand. Improved affordability is providing the ultimate silver lining for prospective homeowners, allowing a purchase to be made at 2011 prices. Perth’s recovery is being hindered by a more restrictive lending environment at a time when local confidence is subdued under weak economic conditions. A sluggish economy is being dragged down by high unemployment, a tight consumer purse, and weak population growth.
Hobart bucked the national downward trend, and remains the best
performing city for capital growth. It became the only city to record
growth over the quarter and year for both houses and units. Despite
this, the pace of house price growth has slowed to half of that recorded
over the same period in 2018, providing homeowners the lowest annual
growth since mid-2016. In the space of a year-and-a-half, Hobart has
gone from the most affordable city to purchase a unit, to more expensive
than Adelaide, Darwin and Perth. If the pace of growth continues,
Hobart unit prices are likely to overtake Brisbane’s in the coming
months.
Hobart became a hotspot for investors, a destination for interstate buyers seeking the ultimate lifestyle location, and tourism flourished helping to drive economic growth and place pressure on housing demand. Buyer interest appears to have passed its peak, with Domain recording a slip in the number of views per listing over the past two months. It is likely that capital gains will be more subdued than the double-digit growth recorded last year.
Canberra’s housing market has shown the first signs of price weakness
since 2012. House prices had their steepest annual fall in a decade,
following a stint of continuous growth that spanned roughly six years.
Despite this, the nation’s capital has a tendency to be the quiet
achiever, providing homeowners with steady equity growth. Historically,
any pullback in house prices tend to be short and relatively minor,
apart from the 1995-97 downturn. Current market conditions are likely to
be the same, a short period of softening rather than the correction
currently unravelling in Sydney and Melbourne.
Unit prices continue to slide over the quarter and year, with the market failing to produce a steady period of price growth since 2009-10. The outlook for apartment prices has been mixed, providing only subdued capital growth over the past five years, up by 4.5 per cent. Equity growth in houses has been superior at 25.8 per cent.
The peak of Darwin’s housing market is in the rear-view mirror – with
prices hitting a high during 2013-14. House and unit prices continue to
be impacted from the weak economic conditions that have ensued post the
mining boom, with a soft employment sector and lack of migration
weighing on the demand for housing. A recovery in Darwin’s housing
market largely hinges on the government’s attempts at boosting the
population, jobs growth and an improvement in the availability of
housing credit.
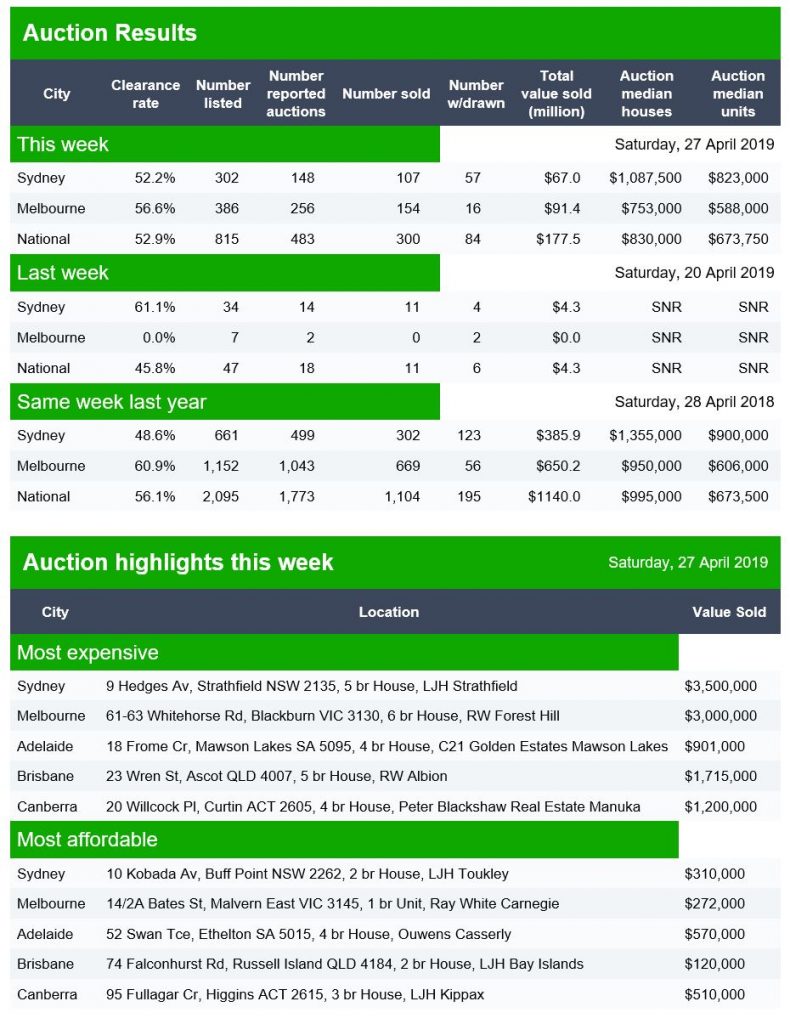
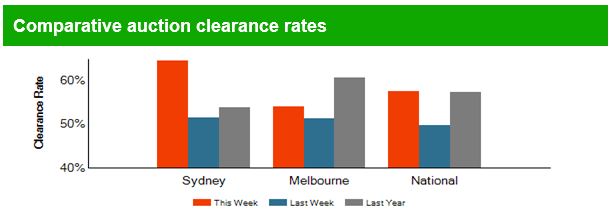
The latest results continue to yield low volumes after last weekend’s holidays. Nationally 815 were listed compared with 2,095 a year ago, 38% of last years count.
Sold so far are 300 compared with 1,104, of 27% of last years count (though it may settle higher).
So those who claim the market is buoyant, need to take account of the lower volumes.
Canberra listed 17 and reported 16 with 6 sold and 1 withdrawn giving a Domain clearance of 35%.
Adelaide listed 33 and reported 16 with 7 sold and 3 withdrawn giving a Domain clearance of 37%.
Brisbane listed 77 and reported 47 with 26 sold and 7 withdrawn giving a Domain clearance of 48%.
The final results continue the trend of lowish total clearances on low volumes. National final clearance was 49.8% with 753 sales. Holidays of course get in the way at this time of year.
Canberra listed 61, reported 44 and sold 27, with 12 withdrawn, giving a Domain clearance of 48%.
Adelaide listed 83, reported 43 and sold 31, with 12 withdrawn, giving a Domain clearance of 56%.
Brisbane listed 104, reported 53 and sold 27 with 12 withdrawn, giving a Domain clearance of 42%.
The weakish results continue with a national final clearance rate of 47.7% on ongoing low volumes last week. Nothing here suggests an uptick in the market. Similar trends so far today.
Canberra reported 49 listed properties, 42 reported auctions and 21 sold with 3 withdrawn, giving a preliminary clearance on a Domain basis of 47%.
Adelaide reported 62 listed properties, 35 reported auctions and 22 sold, with 5 withdrawn, giving a preliminary clearance on a Domain basis of 55%.
Brisbane listed 76 auctions, reported 38 and sold 24 with 3 withfrawn, giving a Domain clearance of 34%.
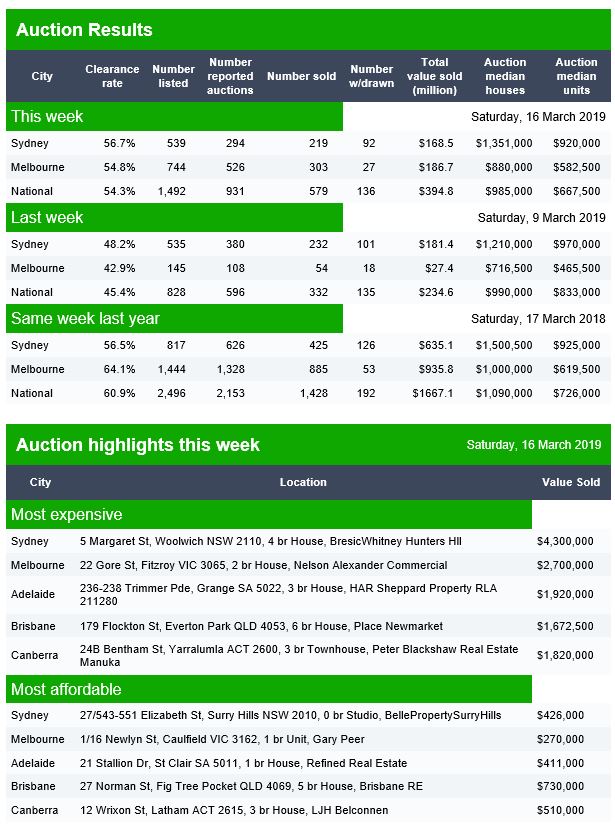
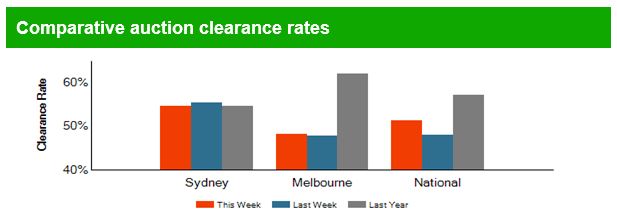
The weak results continue, with a final clearance rate last week of 45.4% on very low volumes, and Melbourne continues lower than Sydney. Once again the results today are off low volumes, and will likely settle lower.
In Brisbane there were 75 listed, 32 reported and 13 sold, with 4 withdrawn giving a Domain clearance of 36%.
In Adelaide, 70 were listed, 36 reported and 20 sold, with 4 withdrawn giving a Domain clearance of 50%.
Canberra listed 64, reported 43 and sold 24, with 9 withdrawn, giving a Domain clearance of 46%.
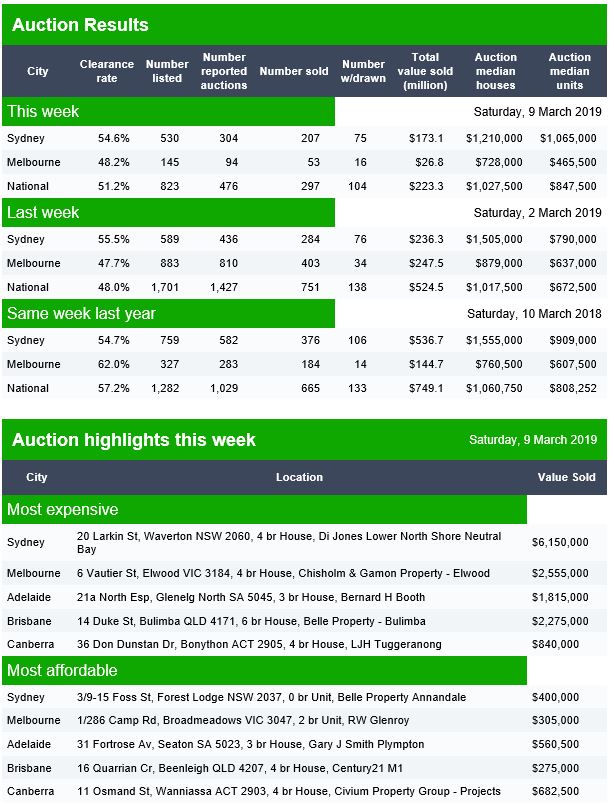
Domain released their preliminary auction results for the 9th March.
The final clearance last week landed at 48%, which is significantly lower than last year, and the preliminary data suggests more of the same with 297 sold compared with 665 last year.
Brisbane listed 86 homes, reported 42 and 20 were sold with 5 withdrawn, giving a Domain clearance of 43%.
Adelaide listed 38, reported 22 and sold 12 with 4 withdrawn, giving a Domain clearance of 46%.
Canberra listed 24, reported 14 and sold 5 with 4 withdrawn, giving a Domain clearance of 28%.