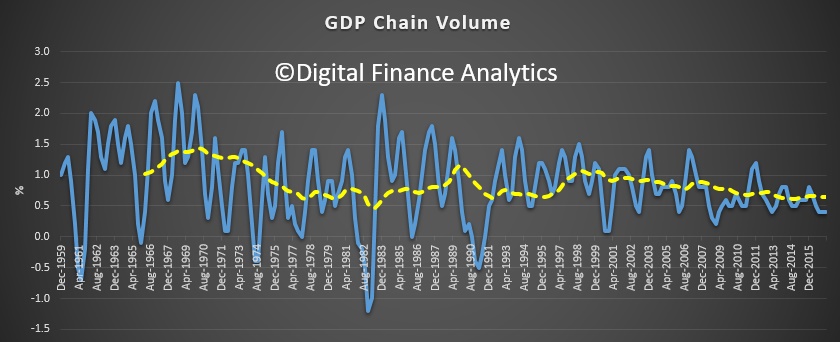
Data from the Australian Bureau of Statistics (ABS) shows the pace of growth of the Australian economy slowed in the March quarter to 0.3 per cent in seasonally adjusted chain volume terms. Through the year, GDP grew 1.7 per cent.
Investment in new housing fell by 4.4 per cent in the March Quarter 2017 which brings the sector down from record high investment in December 2016 and back to levels similar to those experienced at the start of 2016.
As Saul Estlake noted in The Conversation today:
It’s now been 103 quarters (25 years and 9 months) since Australia last had consecutive quarters of negative growth in real gross domestic product (GDP), in the March and June quarters of 1991.
Contrary to much-repeated claims, the Netherlands didn’t experience more than a quarter-century of economic growth without consecutive quarters of negative real GDP growth between the early 1980s and the global financial crisis.
The Netherlands’ real GDP declined by 0.3% in the June quarter of 2003, and by 0.01% in the September quarter of that year, according to data published by Statistics Netherlands and, separately, by the OECD. So, at best, the Netherlands went for only 22 years without experiencing a recession. Australia surpassed that benchmark in 2013.
Yes, that second quarterly decline in 2003 was almost imperceptible. But sporting records are delineated by margins as small as one one-hundredth of a second, so we can’t blithely discount a -0.01% fall in real GDP as “not relevant”.
Even if you blinked and missed that tiny second successive decline in real GDP in the September quarter of 2003, the Netherlands still wouldn’t hold the record for the longest run of continuous economic growth. That belongs to Japan – which, according to OECD data, went from the March quarter of 1960 to the March quarter of 1993 without ever registering two or more consecutive quarters of negative growth in real GDP. That’s 133 quarters, or more than 33 years.
Indeed, if Japanese GDP data were available on a quarterly basis earlier than 1960 it’s likely that this run of continuous economic growth would have been even longer, perhaps as long as 38 years, inferring from annual data available back to 1955. So Australia would need to avoid consecutive quarters of negative real GDP growth until at least 2024 if it is truly to be able to claim this “world record” as its own.
Even more importantly, the definition of a technical recession as (two or more consecutive quarters of negative growth in real GDP) is, as former RBA Governor Glenn Stevens said, “not very useful”. It was originally proposed in December 1974 by Julius Shishkin, who at that time was the head of the Economic Research and Analysis Division of the US Census Bureau (now the Bureau of Economic Analysis, which publishes the US national accounts).
It’s not used to identify recessions in the US. It takes no account of differences over time, or as between countries, in the rates of growth of either population or productivity – which are the key determinants of whether a given rate of economic growth is sufficient to prevent a sharp rise in unemployment. This is something which most people (other than economists) would use to delineate a recession.
While Australia has avoided consecutive quarterly contractions in real GDP since the first half of 1991, we’ve had two periods of consecutive quarterly declines in real per capita GDP (in 2000 and 2006). We’ve also had two periods of consecutive quarterly declines in real gross domestic income or GDI, which takes account of income gains or losses accruing from movements in Australia’s terms of trade (in 2008-09, and in 2014). Perhaps most meaningfully of all, Australia has had two episodes where the unemployment rate has risen by one percentage point or more in 12 months or less (in 2001 and 2009).
That’s still a better track record than almost any other advanced economy during the past quarter-century or so – and it reflects well on the quality of economic management (and the nature of our luck) over this period. Nonetheless, we shouldn’t be in the business of awarding ourselves prizes to which we’re not entitled.
And the long term trend also highlights a slowing, so we need new growth engines if we are to keep the growth ball in the air!
Growth was recorded across the economy with 17 out of 20 industries growing during the quarter. Strong growth was observed within the service industries including Finance and Insurance Services, Wholesale Trade, and Health Care and Social Assistance.
Agriculture, Forestry and Fishing decreased after strong growth in the previous two quarters, while Manufacturing decreased for the tenth time in eleven quarters.
Chief Economist for the ABS, Bruce Hockman said; “This broad-based growth was tempered by falls in exports and dwelling investment. Dwelling investment declined in all states, except Victoria, and overall is the largest decline for Australia since June 2009.”
Compensation of employees (COE) increased 1.0 per cent in the March quarter, a pick up from the negative growth recorded in the December quarter, and is consistent with other labour market data. COE is still only 1.5 per cent higher through the year, continuing to contribute to the reduction in the household saving rate. The household saving ratio fell to 4.7 in the March quarter, half the rate it was in March quarter 2013.
Mr Hockman said; “Even though there was a fall in dwelling investment this quarter, levels are still historically high. There was also positive growth in household consumption, albeit in non-discretionary items such as electricity and fuel purchases. The softer growth in household consumption is broadly in line with modest income growth.”