The Disconnect Between Unemployment and Wages

There is an assumption that as employment rates and growth picks up,  the much needed wage growth will follow. We discussed this on ABC’s The Business last week, with HSBC’s Chief Economist who held the view that the RBA won’t lift the cash rate here until wages growth comes through. We were not so sure.

But an interesting piece from the The IMFBlog suggests there are more fundamental forces at work, especially in terms of employment patterns and the rise of part-time work, which suggests that unemployment and wage growth is more disconnected now. We think underemployment is one of the most critical drives of wage stagnation. If this is true, then wages may be lower for longer, which is not good news for those households with heavy debt burdens, especially if rates rise. We release our September analysis of mortgage stress next week. Here is the IMF commentary:

Over the past three years, labor markets in many advanced economies have shown increasing signs of healing from the Great Recession of 2008-09. Yet, despite falling unemployment rates, wage growth has been subdued–raising a vexing question: Why isn’t a higher demand for workers driving up pay?

Our research in the October 2017 World Economic Outlook sheds light on the sources of subdued nominal wage growth in advanced economies since the Great Recession.  Understanding the drivers of the disconnect between unemployment and wages is important not only for macroeconomic policy, but also for prospects of reducing income inequality and enhancing workers’ security.

Job growth picked up, wage growth less so

In many cases, employment growth has picked up and headline unemployment rates are now back to their pre-Great Recession ranges. Still, nominal wage growth remains well below where it was prior to the recession. Sluggish wages may reflect deliberate efforts to slow down wage growth from unsustainably high levels, as was the case with some countries in Europe. But the pattern is more widespread.

There are several factors at play in explaining this pattern, both cyclical and structural – or slow-moving – in nature.

A key cyclical factor is labor market slack – that is, the excess supply of labor beyond the amount that firms would like to employ.

First off, however, it is important to recognize that headline unemployment rates may not be as indicative of labor market slack as they used to be. Hours per worker have continued to decline (extending a trend that began before the Great Recession).

Several countries have also experienced higher rates of involuntary part-time employment (workers employed for less than 30 hours per week who report they would like to work longer) and an increased share of temporary employment contracts These developments in part reflect continued weak demand for labor (itself a reflection of weak final demand for goods and services).

Another key driver of wage growth is the widely-recognized slowdown in trend productivity growth. Sustained weakness in output per hour worked can squeeze business profitability and eventually weigh on wage growth as firms becomes less willing to accommodate fast increases in compensation.

Slower-moving factors

Besides these forces, slower-moving factors such as ongoing automation (proxied by the falling relative price of investment goods) and diminished medium-term growth expectations also appear to hold back wage growth. However, our analysis suggests that automation may not have made a large contribution to subdued wage dynamics following the Great Recession.

The analysis also indicates sizable common global factors behind wage weakness in the aftermath of the Great Recession and especially during 2014–16. In other words, labor market conditions in other countries appear to have a growing effect on wage setting in any given economy. This points to the possible roles of the threat of plant relocation across borders, or an increase in the effective worldwide supply of labor in a context of closer international economic integration.

Putting it all together

The relative roles of labor market slack and productivity growth vary across countries. In economies where unemployment rates are still appreciably above their averages before the Great Recession (such as Italy, Portugal, and Spain), high unemployment can explain about half of the slowdown in nominal wage growth since 2007, with involuntary part-time employment acting as a further drag on wages. Wage growth is therefore unlikely to pick up until slack diminishes meaningfully—an outcome that requires continued accommodative policies to boost aggregate demand.

In economies where unemployment rates are below their averages before the Great Recession (such as Germany, Japan, the United States, and the United Kingdom), slow productivity growth can account for about two-thirds of the slowdown in nominal wage growth since 2007. Even here, however, involuntary part-time employment appears to be weighing on wage growth, suggesting greater slack in the labor market than headline unemployment rates capture. Assessing the true degree of slack in these economies will be important when determining the appropriate pace of exit from accommodative monetary policies.

Broader changes in the labor market

Our research further indicates that sluggish wage growth has occurred in a context of broader changes in the labor market. The increase in involuntary part-time employment itself, for example, is in part explained by cyclically-weak demand.  Accommodative policies that help lift aggregate demand would therefore lower involuntary part-time employment. But it is also associated with slower-moving factors such as automation, diminished medium-term growth expectations, and the growing importance of the service sector.

Some of these developments represent persistent changes in relationships between firms and workers that mirror underlying shifts in the economy – with the emergence of the gig economy and shrinkage of traditional sectors such as manufacturing. Policymakers may therefore need to enhance efforts to address the vulnerabilities that part-time workers face. Examples of possible measures include broadening minimum wage coverage where it does not currently include part-time workers; securing parity with full-time workers by extending pro-rated annual, family, and sick leave; and strengthening secondary and tertiary education to upgrade skills over the longer term.

Trend Full-Time Employment Rate Still At 5.6%

Monthly trend full-time employment increased for the 11th straight month in August 2017, according to figures released by the Australian Bureau of Statistics (ABS) today.

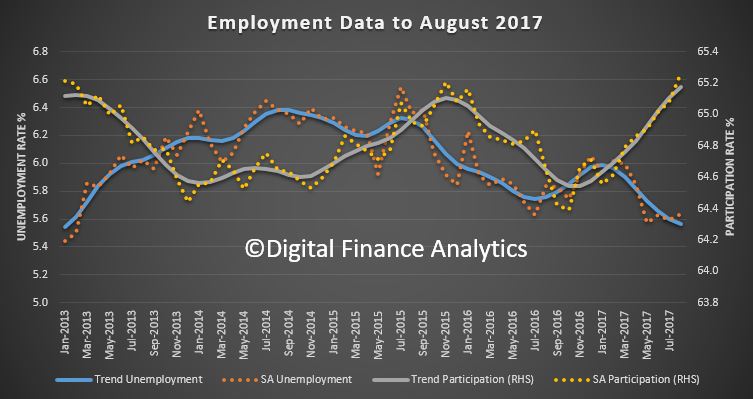
The trend unemployment rate in Australia remained at 5.6 per cent in August 2017, and the labour force participation rate increased to 65.2 per cent, the highest it has been since April 2012.

The quarterly trend underemployment rate remained steady at 8.7 per cent over the quarter to August 2017 from a revised figure for May 2017 quarter.

“The underemployment rate is an important indicator of the spare capacity of workers in Australia, and it has remained at 8.7 per cent, a historical high, for the third consecutive quarter,” the ABS said.

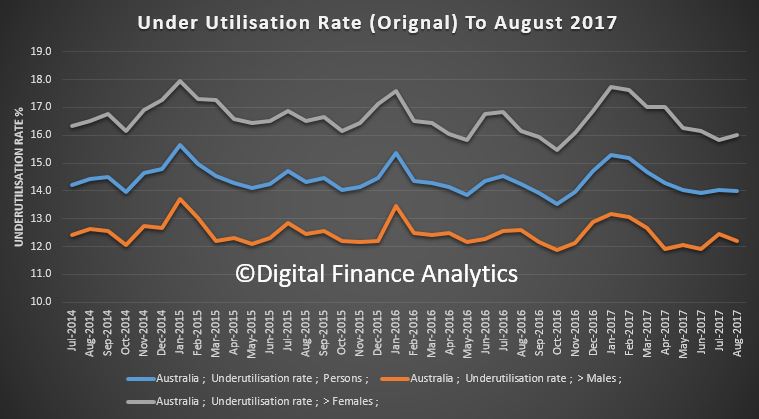
The quarterly trend underutilisation rate, which includes both unemployment and underemployment, decreased by 0.1 percentage points to 14.2 per cent.

Trend series smooth the more volatile seasonally adjusted estimates and provide the best measure of the underlying behaviour of the labour market.

Full-time employment grew by a further 22,000 persons in August, while part-time employment increased by 6,000 persons, underpinning a total increase in employment of 27,000 persons.


“Full-time employment has now increased by around 253,000 persons since August 2016, and makes up the majority of the 307,000 person increase in employment over the period,” Chief Economist for the ABS, Bruce Hockman, said.

Over the past year, trend employment increased by 2.6 per cent, which is above the average year-on-year growth over the past 20 years (1.9 per cent).

The rate of employment growth (2.6 per cent) was greater than the growth in the population aged 15 years and over (1.7 per cent), which was reflected in an increase in the employment to population ratio (which is a measure of how employed the population is). This ratio increased by 0.6 percentage points since August 2016, up to 61.5. This is the highest it has been since February 2013.

Over the past year the three states and territories with the strongest growth in employment were Tasmania (4.0 per cent), Queensland (3.7 per cent) and Victoria (3.2 per cent).

The trend monthly hours worked increased by 3.9 million hours (0.23 per cent) to 1,708.6 million hours in August 2017.

The seasonally adjusted number of persons employed increased by 54,200 in August 2017. The seasonally adjusted unemployment rate remained steady at 5.6 per cent and the labour force participation rate increased to 65.3 per cent.

Underemployment Higher – Roy Morgan

Roy Morgan Research says that in August 1.324 million Australians were unemployed (10.2% of the workforce). This is similar to a year ago (down 8,000, or 0.2%). The “real” unemployment figures of 10.2% are substantially higher than the current ABS estimate for July 2017 (5.6%).

However more Australians are now under-employed than this time last year. 1.241 million (9.5%) Australians are under-employed (looking for work or looking for more work), up a significant 324,000 (2.4%) in a year.

Roy Morgan Monthly Unemployment & Under-employment - August 2017 - 19.7%

Source: Roy Morgan Single Source October 2005 – August 2017. Average monthly interviews 4,000.

This aligns with our own data on mortgage stress, which pointed to under-employment being one of the prime drivers of financial difficulty for many households.


US Employment Data Weaker Than Expected

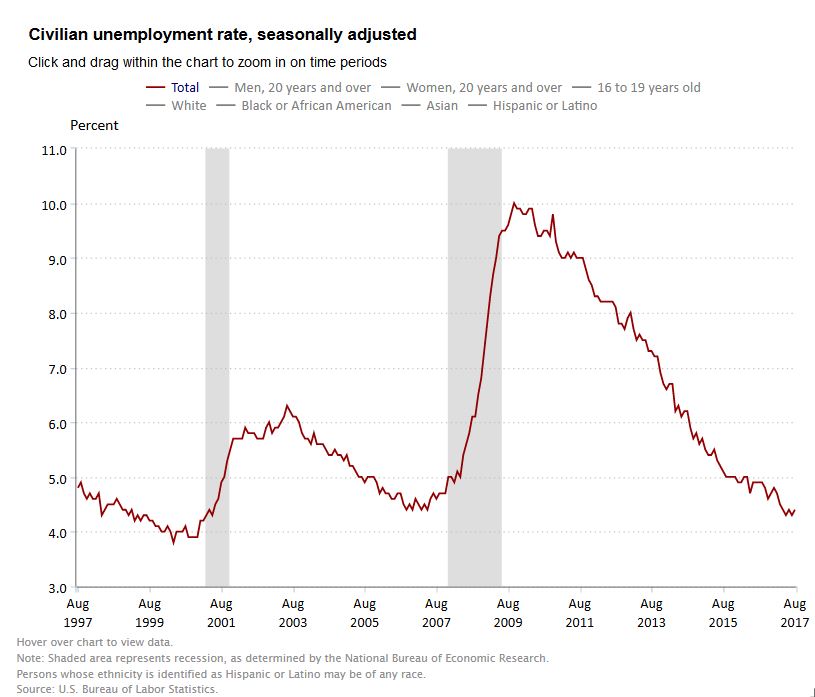
More weaker than expected economic data from the US. Total nonfarm payroll employment increased by 156,000 in August, and the unemployment rate was little changed at 4.4 percent, says the U.S. Bureau of Labor Statistics. The jobs growth was lower than the 186,000 consensus expectation. More evidence supporting the lower for longer interest rate hypothesis.

The number of long-term unemployed (those jobless for 27 weeks or more) was essentially unchanged in August at 1.7 million and accounted for 24.7 percent of the unemployed.

The labor force participation rate, at 62.9 percent, was unchanged in August and has shown little movement on net over the past year. The employment-population ratio, at 60.1 percent, was little changed over the month and thus far this year.

In August, average hourly earnings for all employees on private nonfarm payrolls rose by 3 cents to $26.39, after rising by 9 cents in July. Over the past 12 months, average hourly earnings have increased by 65 cents, or 2.5 percent. In August, average hourly earnings of private-sector production and nonsupervisory employees increased by 4 cents to $22.12.

The change in total nonfarm payroll employment for June was revised down from +231,000 to +210,000, and the change for July was revised down from +209,000 to +189,000. With these revisions, employment gains in June and July combined were 41,000 less than previously reported. (Monthly revisions result from additional reports received from businesses and government agencies since the last published estimates and from the recalculation of seasonal factors.) After revisions, job gains have averaged 185,000 per month over the past 3 months.

Employment Remains A Mixed Picture

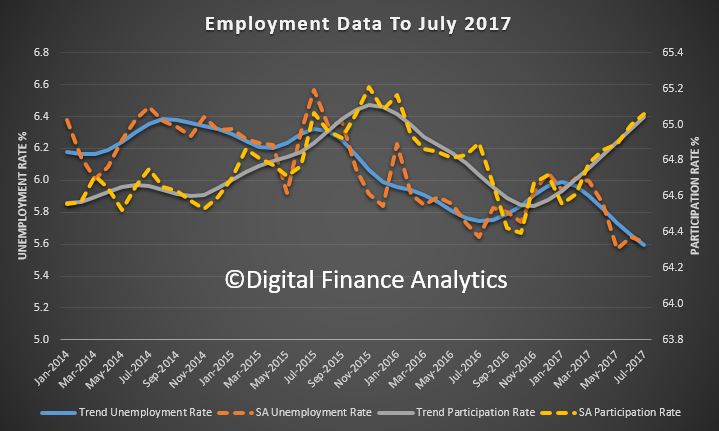
The ABS reported their monthly employment data today, showing that trend full-time employment increased for the 10th straight month in July 2017 but both the trend unemployment rate in Australia was steady at 5.6 per cent in July 2017, and the labour force participation rate remained at 65.0 per cent.

Let’s be clear 5.6% hardly a great result as The New Daily highlights, bearing in mind the unemployment rate in the US, is 4.3%, 4.5% in the UK, 3.9% in Germany and 2.8% in Japan.  Note also that wages are depressed in these countries too. We should not get deflected by the rising number of jobs, which is where the Government would like us to look.  We should be doing better. This does not reflect “full employment”.

Full-time employment grew by a further 29,000 persons, while part-time employment decreased by 3,000 persons, underpinning a total increase in employment of 26,000 persons. The trend monthly hours worked increased by 5.2 million hours (0.3 per cent) to 1,696.4 million hours in July 2017.

Over the past year, trend employment increased by 259,000 persons (or 2.2 per cent), which is above the average year-on-year growth over the past 20 years (1.9 per cent).

The rate of employment growth (2.2 per cent) was greater than the growth in the population aged 15 years and over (1.6 per cent), which was reflected in an increase in the employment to population ratio (which is a measure of how employed the population is). This ratio increased by 0.4 percentage points since July 2016, up to 61.4 per cent, the highest it has been since April 2013.

“Full-time employment has now increased by around 220,000 persons since September 2016, and makes up the majority of the 250,000 person increase in employment over the period,” Chief Economist for the ABS, Bruce Hockman, said.

Over the past year the three states and territories with the strongest growth in employment were Tasmania (4.0 per cent), Victoria (3.1 per cent) and Queensland (2.7 per cent).

Trend series smooth the more volatile seasonally adjusted estimates and provide the best measure of the underlying behaviour of the labour market.

The seasonally adjusted number of persons employed increased by 28,000 in July 2017. The seasonally adjusted unemployment rate was 5.6 per cent and the labour force participation rate was 65.1 per cent.

Will Wages Rise Any Time Soon?

On of the drivers of mortgage stress, which continues to rise, is flat and falling income growth. This phenomenon is hitting other economies too, such as the UK.

So, today’s speech from RBA Governor Philip Lowe is timely –  The Labour Market and Monetary Policy. This speech covers trends in employment and wages in Australia, and the impact of these on monetary policy decisions. It describes developments in the labour market in Australia, including the growth of employment in the services sector, and in part-time jobs. The speech then explores the reasons behind subdued wages growth in Australia and other advanced economies, and the challenge this poses for monetary policy. It restates the Bank’s approach to making monetary policy decisions within the framework of a medium-term inflation target, in way that supports sustainable economic growth and serves the public interest.

He makes the point that if some of the long standing links between income growth and monetary policy are not working as they did, more monetary stimulus may encourage investors to borrow to buy assets, which poses a medium-term risk to financial stability.

In comments after the speech, he also made the point that surging asset prices has led to a growth in inequality across Australia.

Whilst unemployment looks reasonable,

… under utilisation is a real issue.

The persistent slow growth in wages is creating a challenge for central banks. It is contributing to an extended period of inflation below target. In years gone by, the more standard challenge was to keep wage growth in check, so as to stop upward pressure on inflation, which could lead to restrictive monetary policy. No advanced economy faces this challenge at present.

It is possible that things could change in the not too distant future, particularly in those countries at, or near, full employment. It may be that the lags are just a bit longer than usual. If so, we could hit a point at which workers, having had only modest pay increases for a run of years, decide that it is time for a catch-up. If such a tipping point were reached, inflation pressures could emerge quite quickly. In this scenario we could see a period of turbulence in financial markets, given that markets are pricing in little risk of future inflation.

This scenario can’t be completely discounted. It would seem, though, to have a fairly low probability in Australia, especially in light of the continuing spare capacity in our labour market. The more likely case here is that wage growth picks up gradually as the demand for labour strengthens.

Globally, an alternative scenario is that the period of slow wage growth turns out to be much more persistent, partly for the reasons that I discussed earlier. In this scenario, wages growth eventually picks up, but it takes quite a while longer. If so, inflation stays low for longer, although there are other factors that could push inflation higher.

This scenario is one in which the Phillips Curve is flatter than it once was. It is one in which inflation is harder to generate. We can’t yet tell though whether the Phillips Curve in Australia has become flatter, given that we have experienced relatively little variation in the unemployment rate over recent times.

The combination of a flatter Phillips Curve and inflation below target raises a challenge for central banks: how hard to press to get inflation up?

For a central bank with a single objective of inflation, the answer is relatively straightforward. Inflation is too low, so you do what you can to get inflation up. If inflation doesn’t increase, you need more monetary stimulus.

This approach does carry risks, though. A flatter Phillips Curve means that the monetary stimulus has relatively little effect on inflation, at least for a while. At the same time, however, the monetary stimulus is likely to push asset prices higher and encourage more borrowing. Faced with low inflation, low unemployment and low interest rates, investors are likely to find it attractive to borrow money to buy assets. This poses a medium-term risk to financial stability.


Trend full-time employment growth continues

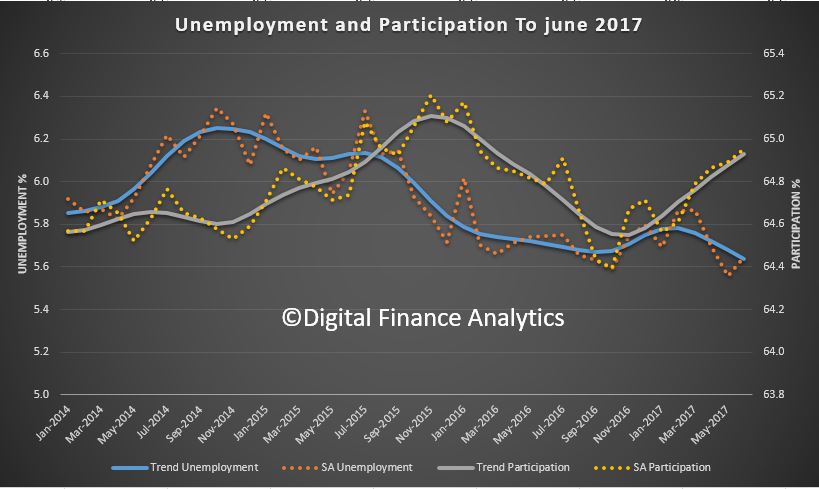
Monthly trend full-time employment increased for the ninth straight month in June 2017, according to figures released by the Australian Bureau of Statistics (ABS) today. The trend unemployment rate in Australia decreased by less than 0.1 percentage points to 5.6 per cent in June 2017.

This is good news, in that more people are employment, but of course household income growth is still sluggish and underemployment remains a continuing issue.

Full-time employment grew by a further 30,000 persons, while part-time employment decreased by 4,000 persons, underpinning an increase in total employment of 26,000 persons.

The state by state data (based on original stats) shows an improvement in SA, but a fall in ACT. The smaller states tend to be more volatile.

“Full-time employment has increased by around 187,000 persons since September 2016, with particular strength over the past five months, averaging around 30,000 persons per month,” Chief Economist for the ABS Bruce Hockman said. “Full-time employment now accounts for about 68 per cent of employment, however this is down from around 72 per cent a decade ago.”

Over the past year, trend employment increased by 227,000 persons (or 1.9 per cent), which is the same as the average year-on-year growth over the past 20 years. It has increased since December 2016, when the year-on-year growth was at 0.8 per cent and reflected relatively low employment growth through most of 2016.

The trend monthly hours worked increased by 6.2 million hours (0.4 per cent) to 1,691.5 million hours in June 2017. Most of this increase was hours worked by full-time workers.

The trend unemployment rate in Australia decreased by less than 0.1 percentage points to 5.6 per cent in June 2017.

Trend series smooth the more volatile seasonally adjusted estimates and provide the best measure of the underlying behaviour of the labour market.

The seasonally adjusted number of persons employed increased by 14,000 in June 2017. The seasonally adjusted unemployment rate remained steady at 5.6 per cent, after the May 2017 number was revised up to 5.6 per cent, and the seasonally adjusted labour force participation rate increased to 65.0 per cent.

Australian underemployment is the highest in modern times

From The New Daily.

Underemployment is at its highest level since records began in the 1970s, but you won’t have heard it on the TV.

Thursday’s headlines were instead dominated by news that Australia’s official unemployment rate had fallen from 5.7 per cent in April to a four-year low of 5.5 per cent in May, based on the popular ‘seasonally adjusted’ measure.

Economists and politicians seized on this unexpected surge in full-time employment as a sign that the labour market and the broader economy were improving.

“Fifty-thousand Australians went out to get a job in May and they got one under the economic policies of the Turnbull government,” Treasurer Scott Morrison told Parliament.

“The unemployment rate now has fallen to 5.5 per cent, lower than what we inherited from the Labor Party back in 2013.”

Mr Morrison was using the seasonally adjusted measure, the usual number quoted by politicians and journalists.

However, the measure preferred by the Australian Bureau of Statistics – trend – had the unemployment rate unchanged at 5.7 per cent.

Worse still, the ABS itself drew special attention to the fact that the share of workers wanting more hours was at the highest level since modern records began in 1978. This was widely ignored.

underemployment chart abs

The trend estimate of underemployment worsened from 8.7 per cent in December-February to 8.8 per cent in March-May, which means 1.1 million Australian workers are crying out for more hours.

ABS chief economist Bruce Hockman said this figure was an important reminder of “spare capacity” in the labour market.

“The underemployment rate is an important indicator of the spare capacity of workers in Australia, and has risen for the sixth consecutive quarter to a historical high of 8.8 per cent,” Mr Hockman said.

The ABS prefers trend estimates because it says they are less volatile than seasonally adjusted numbers.

Thursday’s record-high underemployment was a symptom of growing casualisation, which many believe has deleterious effects on wages, job security and conditions.

The ABS defines a person as underemployed if they are part-time and want more hours, or if they are usually employed full-time but were forced for economic reasons to work part-time the week they were surveyed by the bureau.

Even during the 1990s recession the underemployment rate never exceeded 7 per cent.

And despite the headlines welcoming the creation of “50,000” new full-time jobs, the long-term trend of destruction of full-time positions saw no abatement in the latest quarterly data.

full time jobs vanishing

Since the late 1970s, the share of men with full-time jobs has fallen from 95 per cent to 80 per cent. Women have suffered too, with their share of full-time jobs falling by roughly the same amount, from 66 to 53 per cent.

You won’t have heard that in Question Time.

Trend Unemployment Unchanged, Again, But…

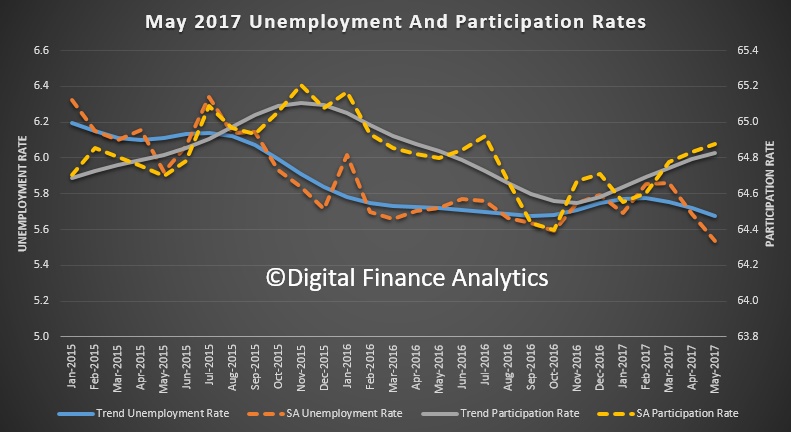
The May 17 trend unemployment remained at 5.7% according to ABS figures released today. Full time employment grew again, and participation was higher, but the trend underemployment rate, which is a quarterly measure of employed persons wanting more hours, increased from 8.7 per cent to 8.8 per cent between February and May 2017. Further pressure on household incomes.

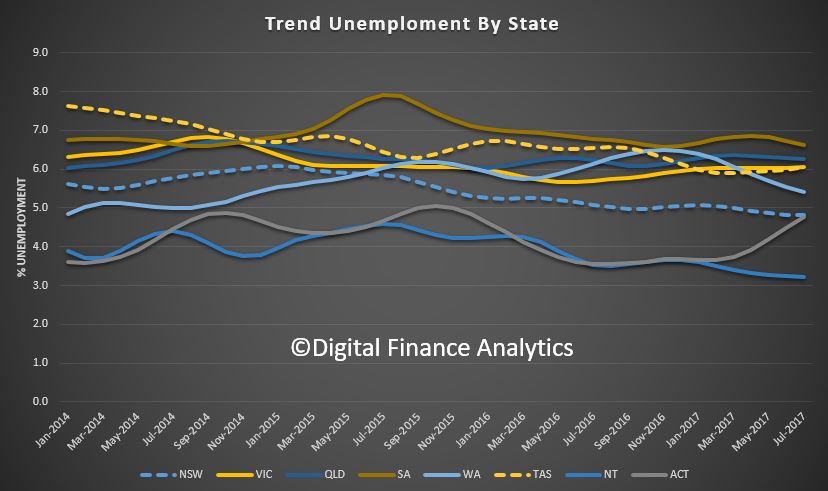
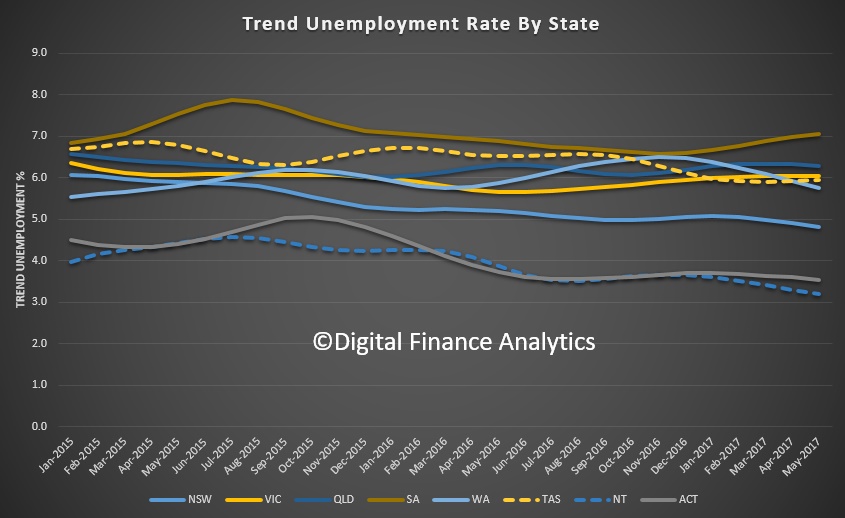
Significant state variations remain, with trend unemployment in SA at 7.1% and NT at 3.2%; the former rising, the latter falling.

Monthly trend full-time employment increased for the eighth straight month in May 2017, according to figures released by the Australian Bureau of Statistics (ABS) today. Full-time employment grew by a further 19,300 persons, while part-time employment increased by 5,900 persons, underpinning an increase in total employment of 25,200 persons.

“Full-time employment has increased by around 124,000 persons since September 2016, with particular strength over the past five months, at around 20,000 persons per month,” said Chief Economist for the ABS, Bruce Hockman.

Over the past year, trend employment increased by 194,200 persons (or 1.6 per cent), which is still below the average year-on-year growth over the past 20 years (1.8 per cent). It has increased since December 2016, when the year-on-year growth was at 0.8 per cent and reflected relatively low employment growth through most of 2016.

The trend monthly hours worked increased by 2.9 million hours (0.2 per cent) to 1,677.7 million hours in May 2017. Most of this increase was hours worked by full-time workers.

The trend unemployment rate in Australia remained at 5.7 per cent in May 2017. The trend underemployment rate, which is a quarterly measure of employed persons wanting more hours, increased from 8.7 per cent to 8.8 per cent between February and May 2017.

“The underemployment rate is an important indicator of the spare capacity of workers in Australia, and has risen for the sixth consecutive quarter to a historical high of 8.8 per cent,” Mr Hockman said.

The trend underutilisation rate, which includes both unemployment and underemployment, remained at 14.5 per cent in May 2017.

Trend series smooth the more volatile seasonally adjusted estimates and provide the best measure of the underlying behaviour of the labour market.

The seasonally adjusted number of persons employed increased by 42,000 in May 2017. The seasonally adjusted unemployment rate decreased by 0.2 percentage points to 5.5 per cent, and the seasonally adjusted labour force participation rate increased slightly to 64.9 per cent.

“The trend unemployment rate has been relatively stable over the past 18 months, at around 5.7 to 5.8 per cent, while the seasonally adjusted rate has also been relatively constrained, between 5.5 and 6.0 per cent,” Mr Hockman said.

Significant state variations remain, with SA at 7.1% and NT at 3.2%.

US Unemployment Rate Was 4.3 Percent in May 2017

From The US Bureau of Labor Statistics.

The US unemployment rate was 4.3 percent in May 2017, down from 4.8 percent in January. Among the unemployed, the number of job losers and persons who completed temporary jobs declined by 211,000 to 3.3 million in May, or 2.1 percent of the total labor force. In comparison, job leavers made up 0.5 percent of the labor force. These are people who quit or voluntarily ended their jobs and began searching for a new job.

Unemployed reentrants to the labor force made up 1.3 percent of the labor force in May 2017. Reentrants are people who previously worked but were out of the labor force before they began their job search. Unemployed new entrants made up 0.4 percent of the labor force in May.

These data are from the Current Population Survey. For more information, see “The Employment Situation — May 2017″