December Trend Employment Data Steady

Monthly trend full-time employment increased by 7,000 in Australia in December 2016, according to figures released by the Australian Bureau of Statistics (ABS) today. Whilst employment growth remains sluggish, this was the third consecutive month of increasing full-time employment.

But the rotation to part-time work continues, the seasonally adjusted unemployment rate rose to 5.8% and the seasonally adjusted participation rate rose to 64.7%.

Total trend employment increased by 8,200 persons to 11,966,800 persons in December 2016, reflecting an increase in both full-time (7,000) and part-time (1,100) employment. However, year-on-year employment growth was 0.7 per cent, which was less than half the average growth, of 1.8 per cent, from the past 20 years.

“Over the past year we have seen a shift towards part-time employment, particularly in the first half of 2016. There are now around 120,900 more people working part-time than there were a year ago, and around 35,300 fewer people working full-time. Since December 2015, the share of part-time employment increased from 31.1 per cent to 31.9 per cent,” said the General Manager of the ABS’ Macroeconomic Statistics Division, Bruce Hockman.

The trend unemployment rate was 5.7 per cent for the ninth consecutive month.

The trend participation rate was unchanged at 64.6 per cent.

The trend monthly hours worked increased by 2.3 million hours (0.1 per cent), with increases in total hours worked by both full-time workers and part-time workers.

Trend series smooth the more volatile seasonally adjusted estimates and provide the best measure of the underlying behaviour of the labour market.

The seasonally adjusted number of persons employed increased by 13,500 in December 2016. The seasonally adjusted unemployment rate increased by 0.1 percentage points to 5.8 per cent, and the seasonally adjusted labour force participation rate increased by 0.1 percentage points to 64.7 per cent.

US Employment Data Strengthens Case For More Rate Rises

The latest US Bureau of Labor Statistics, released overnight shows US employment momentum is supportive of rate rises this year. It is ironic that as the US presidency passes in a couple of week, the economy there is looking pretty strong! Over the past 3 months, job gains have averaged 165,000 per month. However the news was not sufficient to lift the Dow Index through 20,000.

Household Survey Data

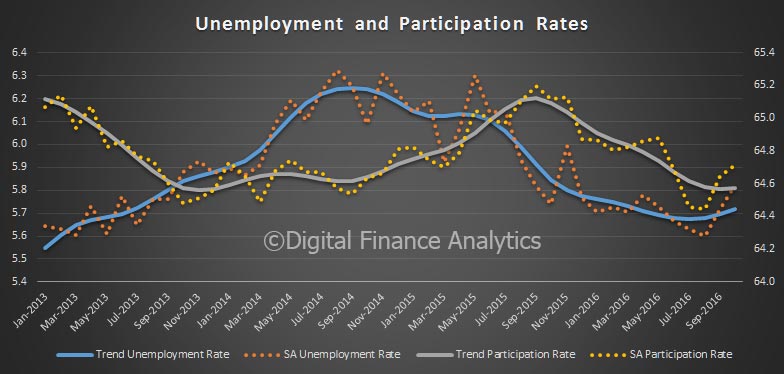
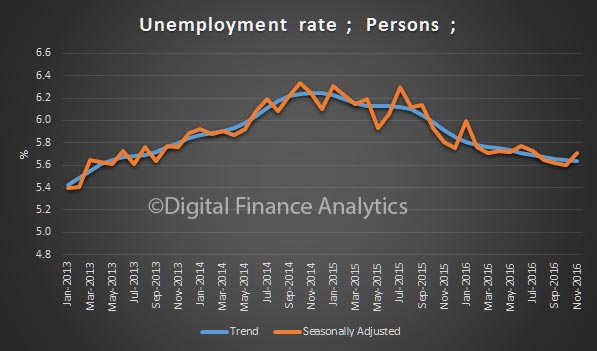
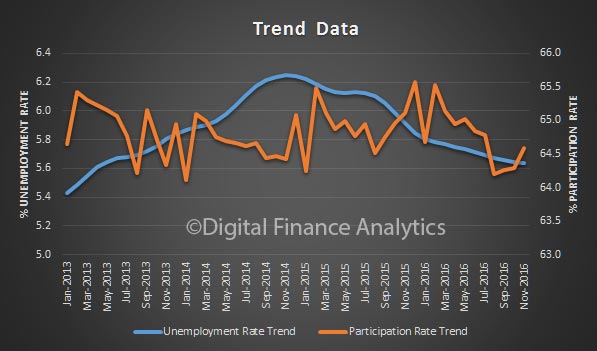
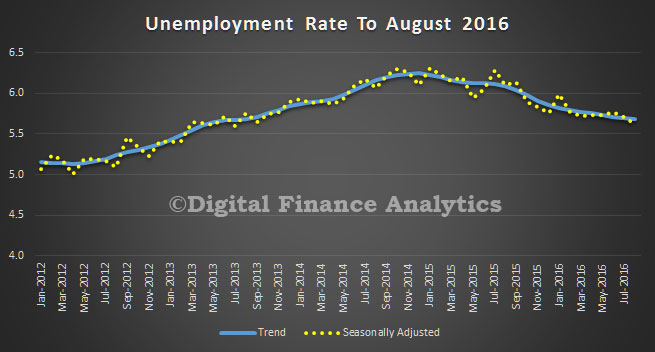
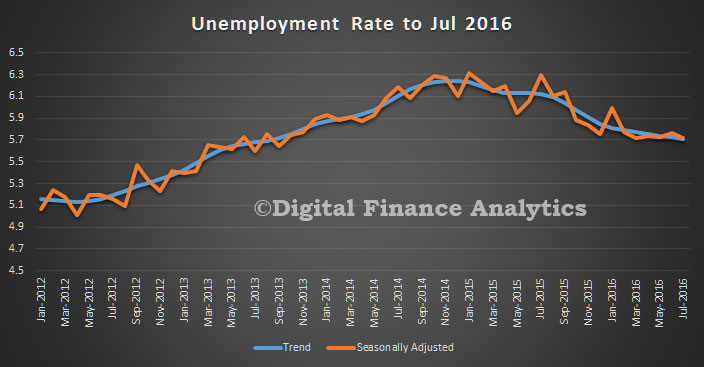
The unemployment rate, at 4.7 percent, and the number of unemployed persons, at 7.5 million, changed little in December. However, both measures edged down in the fourth quarter, after showing little net change earlier in the year.

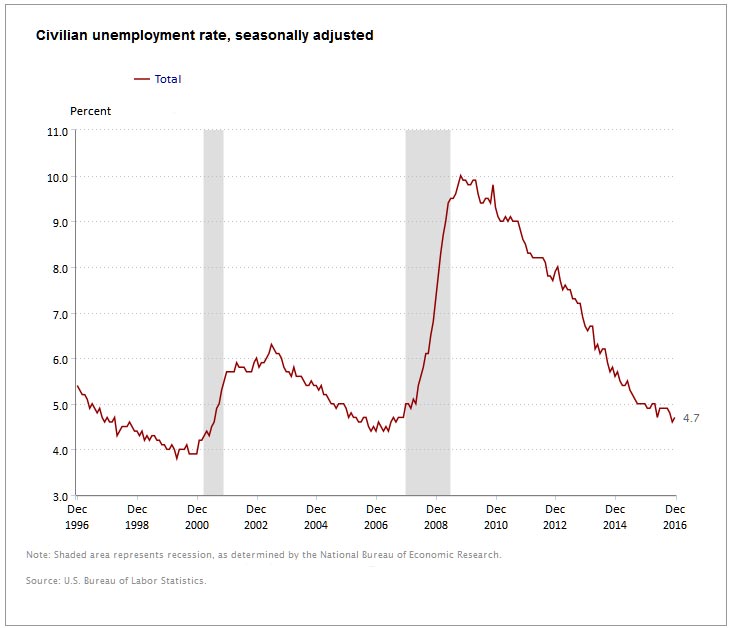
Among the major worker groups, the unemployment rates for adult men (4.4 percent), adult women (4.3 percent), teenagers (14.7 percent), Whites (4.3 percent), Blacks (7.8 percent), Asians (2.6 percent), and Hispanics (5.9 percent) showed little change in December.

The number of long-term unemployed (those jobless for 27 weeks or more) was essentially unchanged at 1.8 million in December and accounted for 24.2 percent of the unemployed. In 2016, the number of long-term unemployed declined by 263,000.

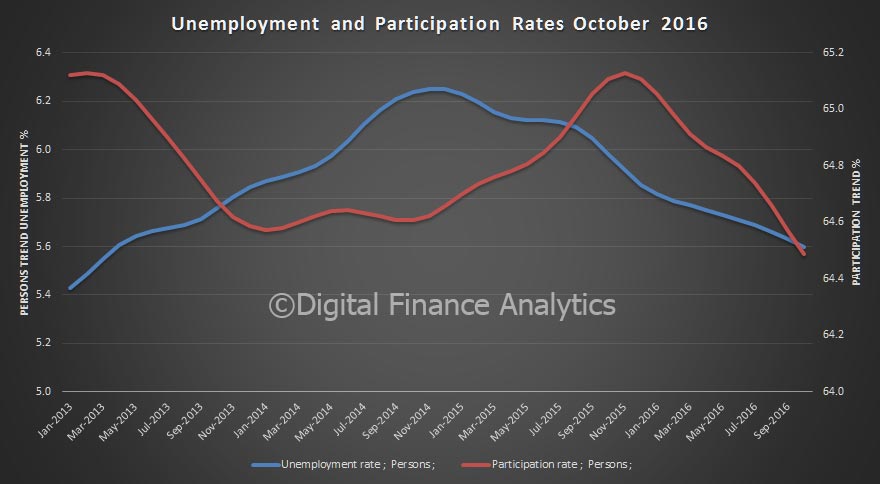
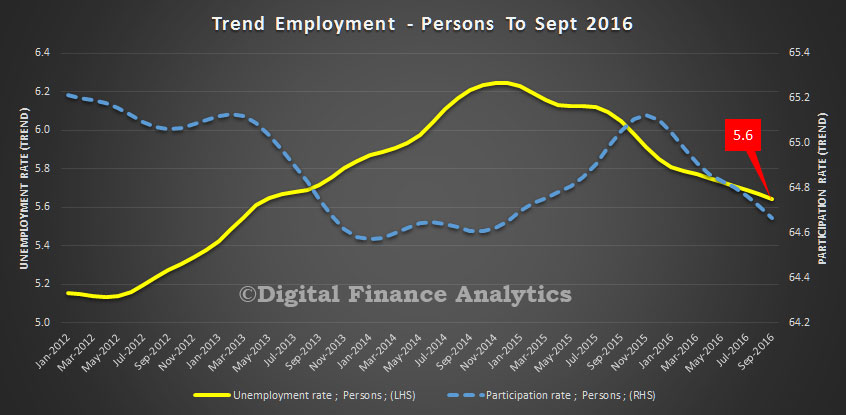
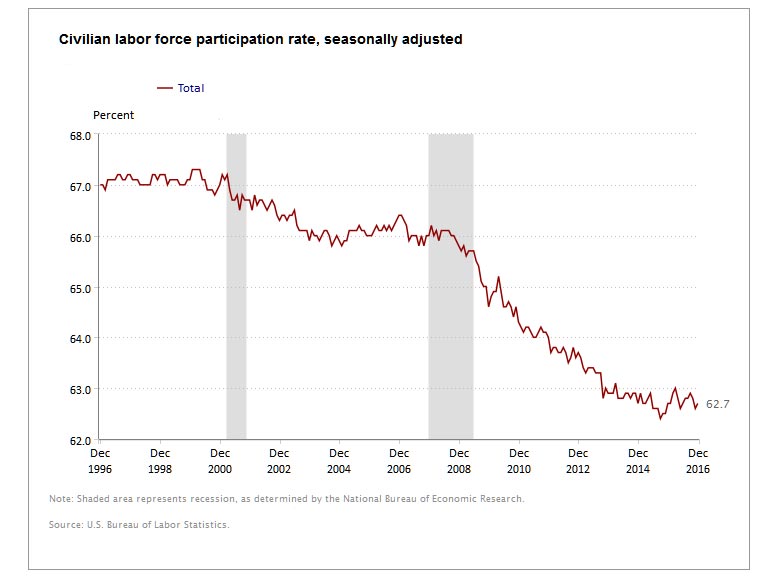
The labor force participation rate, at 62.7 percent, changed little in December and was unchanged over the year. In December, the employment-population ratio was 59.7 percent for the third consecutive month; this measure showed little change, on net, in 2016.

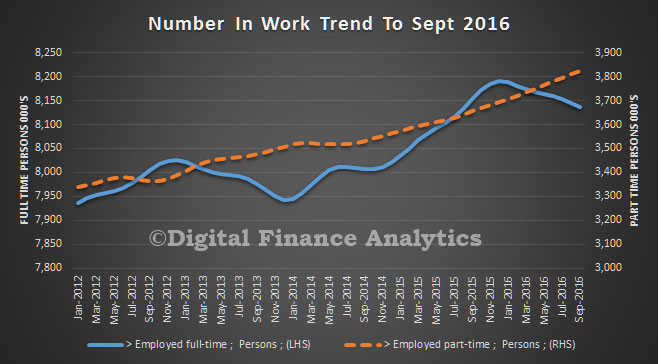
The number of persons employed part time for economic reasons (also referred to as involuntary part-time workers), at 5.6 million, was essentially unchanged in December but was down by 459,000 over the year. These individuals, who would have preferred full-time employment, were working part time because their hours had been cut back or because they were unable to find a full-time job.

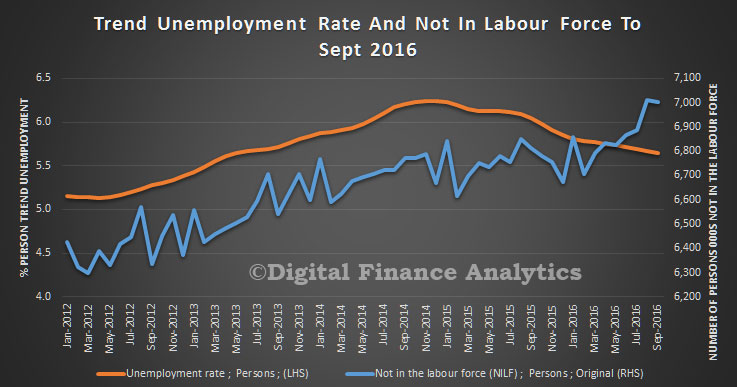
In December, 1.7 million persons were marginally attached to the labor force, little changed from a year earlier. (The data are not seasonally adjusted.) These individuals were not in the labor force, wanted and were available for work, and had looked for a job sometime in the prior 12 months. They were not counted as unemployed because they had not searched for work in the 4 weeks preceding the survey.

Among the marginally attached, there were 426,000 discouraged workers in December, down by 237,000 from a year earlier. (The data are not seasonally adjusted.) Discouraged workers are persons not currently looking for work because they believe no jobs are available to them. The remaining 1.3 million persons marginally attached to the labor force in December had not searched for work for reasons such as school attendance or family responsibilities.

Establishment Survey Data

Total nonfarm payroll employment rose by 156,000 in December, with an increase in health care and social assistance. Job growth totaled 2.2 million in 2016, less than the increase of 2.7 million in 2015.

Employment in health care rose by 43,000 in December, with most of the increase occurring in ambulatory health care services (+30,000) and hospitals (+11,000). Health care added an average of 35,000 jobs per month in 2016, roughly in line with the average monthly gain of 39,000 in 2015.

Social assistance added 20,000 jobs in December, reflecting job growth in individual and family services (+21,000). In 2016, social assistance added 92,000 jobs, down from an increase of 162,000 in 2015.

Employment in food services and drinking places continued to trend up in December (+30,000). This industry added 247,000 jobs in 2016, fewer than the 359,000 jobs gained in 2015.

Employment also continued to trend up in transportation and warehousing in December (+15,000). Within the industry, employment expanded by 12,000 in couriers and messengers. In 2016, transportation and warehousing added 62,000 jobs, down from a gain of 110,000 jobs in 2015.

Employment in financial activities continued on an upward trend in December (+13,000). This is in line with the average monthly gains for the industry over the past 2 years.

In December, employment edged up in manufacturing (+17,000), with a gain of 15,000 in the durable goods component. However, since reaching a recent peak in January, manufacturing employment has declined by 63,000.

Employment in professional and business services was little changed in December (+15,000), following an increase of 65,000 in November. The industry added 522,000 jobs in 2016.

Employment in other major industries, including mining, construction, wholesale trade, retail trade, information, and government, changed little in December.

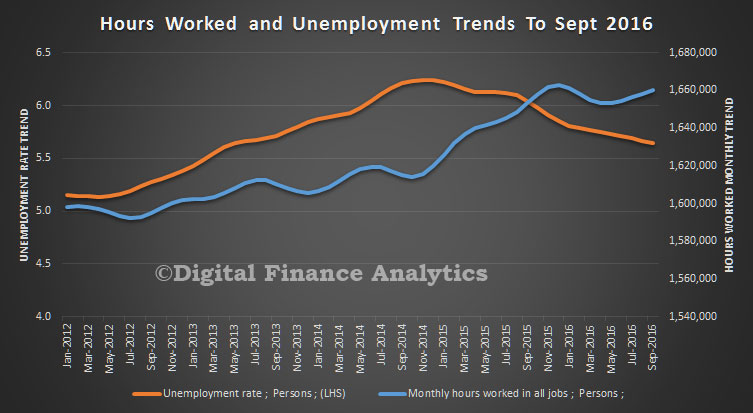
The average workweek for all employees on private nonfarm payrolls was unchanged at 34.3 hours in December. In manufacturing, the workweek edged up by 0.1 hour to 40.7 hours, and overtime edged up by 0.1 hour to 3.3 hours. The average workweek for production and nonsupervisory employees on private nonfarm payrolls remained at 33.6 hours.

In December, average hourly earnings for all employees on private nonfarm payrolls increased by 10 cents to $26.00, after edging down by 2 cents in November. Over the year, average hourly earnings have risen by 2.9 percent. In December, average hourly earnings of private-sector production and nonsupervisory employees increased by 7 cents to $21.80.

The change in total nonfarm payroll employment for October was revised down from +142,000 to +135,000, and the change for November was revised up from +178,000 to +204,000. With these revisions, employment gains in October and November were 19,000 higher than previously reported. Over the past 3 months, job gains have averaged 165,000 per month.

Trend Unemployment Steady In November

Monthly trend full-time employment was largely unchanged in Australia in November 2016, according to figures released by the Australian Bureau of Statistics (ABS) today.

Total trend employment increased by 3,100 persons to 11,949,300 persons in November 2016, reflecting an increase in part-time employment of 3,200 persons and a small decrease of 100 persons working full-time.

“Over the past year we have seen a shift towards part-time employment, particularly in the first half of 2016. There are now around 138,300 more people working part-time than there were a year ago, and around 51,000 fewer people working full-time,” said the General Manager of ABS’ Macroeconomic Statistics Division, Bruce Hockman.

The trend unemployment rate remained steady at 5.6 per cent for the second consecutive month, having fallen over the past two years from 6.2 per cent in November 2014.

The trend participation rate was unchanged at 64.5 per cent.

The trend monthly hours worked increased by 0.8 million hours (0.1 per cent), with decreases in total hours worked by full-time workers and an increase in hours worked by part-time workers.

The quarterly trend underemployment rate remained at 8.5 per cent for a third successive quarter. “The underemployment rate is still at a historically high level for Australia, but has been relatively unchanged over the past two years,” said Mr Hockman.

Trend series smooth the more volatile seasonally adjusted estimates and provide the best measure of the underlying behaviour of the labour market.

The seasonally adjusted number of persons employed increased by 39,100 in November 2016. The seasonally adjusted unemployment rate increased by 0.1 percentage points to 5.7 per cent, and the seasonally adjusted labour force participation rate increased by 0.2 percentage points to 64.6 per cent.

Participation improved this time.

The state level data shows that unemployment is highest in SA, WA and TAS, and lowest in NT and ACT.

US Employment Stronger

Latest US data shows the unemployment rate declined by 0.3 percentage point to 4.6 percent in November, and nonfarm payroll employment increased by 178,000. Further support for a FED rate rise.

work-pic

Job growth continued in professional and business services and in health care. Thus far this year, nonfarm job growth has averaged 180,000 per month, compared with an average gain of 229,000 per month in 2015.

Incorporating revisions for September and October, which reduced nonfarm payroll employment by 2,000 on net, monthly job gains have averaged 176,000 over the past 3 months.

Employment in professional and business services increased by 63,000 in November and has expanded by 571,000 over the year. Within the industry, accounting and bookkeeping services added 18,000 jobs over the month. Employment continued to trend up in administrative and support services (+36,000), computer systems design and related services (+5,000), and management and technical consulting services (+4,000).

Health care employment rose by 28,000 in November, with a gain of 22,000 in ambulatory health care services. Health care has added 407,000 jobs over the year.

Employment in construction continued on its recent upward trend in November (+19,000), led by a gain in residential specialty trade contractors (+15,000). Over the past 3 months, construction has added 59,000 jobs, largely in residential construction.

Employment in other major industries–mining, manufacturing, wholesale trade, retail trade, transportation and warehousing, information, financial activities, leisure and hospitality, and government–changed little over the month.

Average hourly earnings of all employees on private nonfarm payrolls decreased by 3 cents in November to $25.89, following an 11-cent increase in October. Over the past 12 months, average hourly earnings have risen by 2.5 percent. From October 2015 to October 2016, the Consumer Price Index for All Urban Consumers (CPI-U) increased by 1.6 percent (on a seasonally adjusted basis).

Turning to measures from the survey of households, the unemployment rate declined by 0.3 percentage point to 4.6 percent in November. The number of unemployed people fell by 387,000 over the month to 7.4 million. The decrease was largely among adult men. From August 2015 through October 2016, both the unemployment rate and the number of unemployed people had shown little movement on net.

In November, the number of people searching for work for 27 weeks or more was little changed at 1.9 million. These long-term unemployed accounted for 24.8 percent of the total unemployed.

The labor force participation rate, at 62.7 percent, was about unchanged in November, and the employment-population ratio held at 59.7 percent. Both measures have shown little movement in recent months.

In November, there were 5.7 million people working part time for economic reasons (also referred to as involuntary part-time workers). This measure was little changed over the month but was down by 416,000 from a year earlier.

Among those neither working nor looking for work in November, 1.9 million were considered marginally attached to the labor force, up from 1.7 million a year earlier. Discouraged workers, a subset of the marginally attached who believed that no jobs were available for them, numbered 591,000 in November, essentially unchanged from a year earlier. (Marginally attached to the labor force refers to people who had not looked for work in the 4 weeks prior to the survey but wanted a job, were available for work, and had looked for a job within the last 12 months.)

In summary, the unemployment rate declined to 4.6 percent in November, and nonfarm payroll employment increased by 178,000.

Employment Rate Stable, But…

The data from the ABS today shows an unchanged headline unemployment rate of 5.6%. However, trend employment decreased 1,000 to 11,946,600 and unemployment decreased 4,100 to 708,600. The participation rate decreased 0.1 pts to 64.5%. The monthly hours worked in all jobs increased 3.2 million hours to 1668.0 million hours.

We see more choosing to sit out of the market all together, and continued under utilisation. So while the headline is OK, the employment market dynamics remain a concern.

employment-oct-2016Note that last month the ABS observed that the incoming rotation group was considerably different to the rest of the Queensland sample and its influence was reduced as part of the estimation process.

The ABS has further reviewed the treatment of September’s incoming rotation group in Queensland and confirmed that the characteristics observed in September are relatively consistent with those observed in October, suggesting that last month’s data were representative of the new group. Its influence has therefore been restored, resulting in revisions to September estimates for Queensland and (to a lesser extent) Australia.

More On The Wacky Employment Data

Earlier today the ABS released some weird data, as we discussed earlier. We said then:

…the numbers seem a bit weird, with a fall in the number of full time jobs, a rise in part time jobs, and the participation rate down just a tad. Yet the number of hours worked rose significantly. Strange. Can we trust the data? Expectations were for a rise in jobs, so the results are below expectations.

We have looked in more detail at the data. If we plot the unemployment rate against the number of people not in the labour force, we immediately see a rise in the number who left the market in the past few months, allowing the employment rate to fall.

emp-sept-2016-not-in-marketSo, clearly one of the factors playing havoc with the numbers is the rise in those who have given up looking for work. In addition, we see a rise in the monthly hours worked. But hard to see how this is possible when the number of full time jobs fell, even offset by a rise in part-time work.

hours-workedThe Business Insider picked up comments from some of the economists reacting to the data.

After trying to digest the data and make something of it, even Australia’s economic community — usually guarded about criticising one of their own — appears to have had enough, presenting a less-than-glowing assessment of the figures, some more politely that others.

Here’s a selection of the commentary that we’ve read. It really does offer a damning assessment of what is the single-most important data release in Australia each and every month.

John Peters, Commonwealth Bank

The latest data also revealed a curious result in relation to the participation rate. The participation rate (% of population employed or unemployed) has actually fallen by 0.4% over the past 2 months – one of the biggest declines on record. It sits at odds with the leading indicators of participation. Big moves are typically a sign of survey problems. The participation rate will fall if you have underestimated the level of employment. So the bottom line is to take the latest headline jobs prints with a grain of salt.

The mixed September labour force report with the huge size of some of the reported moves raises a degree of scepticism about the results. The ABS goes some way in addressing this scepticism by noting in its latest report that the new group added into the survey had a lower employment intensity than the group that rotated out. This would have biased down jobs growth. There is a problem in QLD in particular.

Stephen Walters, Australian Institute of Company Directors

Today’s employment report for September was a dog’s dinner. Total employment fell again (the second straight monthly decline), dragged down by another plunge in full-time job places. But, the jobless rate fell (after revisions) to a three-year low, although this was only because more people left the labour force. Hours worked across the entire workforce rose, but the underemployment rate fell. All up, with the main indicators all over the place in what we now know is a very volatile data set, it’s extremely difficult to draw firm conclusions from today’s release.

Paul Dales, Capital Economics

There are two reasons, though, why we can’t rely on these data. First, job growth is probably stronger than it looks as September’s data will have been dragged down by the end of the temporary contracts of those people employed by the Census in August. That may have reduced it by around 10,000.

Second, there is reason to believe that job growth is worse than September’s figure suggests. The ABS stated that it has altered the headline figure because the incoming rotation sample for Queensland was “considerably different to the rest of the Queensland sample”. Part of the survey sample changes every month, but it is unusual for the ABS to actively reduce the influence of the incoming sample. Somewhat unhelpfully, when we phoned the ABS it wouldn’t say which direction it tweaked the data! But since the state breakdown shows that employment in Queensland fell by 4,100, we’re guessing that fall was smaller than would otherwise have been the case.

Michael Turner, Royal Bank of Canada

For September’s report, the ABS warns that a new part of the survey to rotate in from Queensland was “noticeably different in its labour force characteristics to the group that it replaced”. The ABS has therefore “temporarily reduced the influence of this rotation group for September estimates”. In short, it appears the ABS is struggling to take survey responses at face value, and is almost ignoring some of them. This is obviously less than ideal, and underscores widely held concerns over the veracity of the data on a month-to-month basis.

Ivan Colhoun, National Australia Bank

Overall a weaker-than-expected report, but once again with a heightened degree of uncertainty about the exact signals of the various series given a number of very unusual – and large – monthly moves.

In spite of the veracity questions, the trends are not likely to allay the RBA’s fears about the momentum of the labour market.

Paul Bloxham, HSBC

Other labour market indicators have not shown this kind of deterioration; business and consumer confidence are holding up at solid levels and job advertisements have continued to rise. The official labour market survey has also faced difficulties with changing seasonal patterns during the past few years, which mean that the other labour market measures may be giving a better read of actual conditions.

Shift to part-time employment continues

Monthly trend employment in Australia increased slightly in September 2016, according to figures released by the Australian Bureau of Statistics (ABS) today. But the numbers seem a bit weird, with a fall in the number of full time jobs, a rise in part time jobs, and the participation rate down just a tad. Yet the number of hours worked rose significantly. Strange. Can we trust the data? Expectations were for a rise in jobs, so the results are below expectations.

employment-number

In September 2016, trend employment increased by 3,900 persons to 11,959,500 persons – a monthly growth rate of 0.03 per cent. This is down from the monthly employment growth peak of 0.28 per cent in September 2015. Trend part-time employment growth continued, with an increase of 11,800 persons, while full-time employment decreased by 7,900 persons.

”The latest Labour Force release shows further increases in part-time employment. There are now 130,000 more persons working part-time than in December 2015, while the number working full-time has decreased by 54,100 persons,” said the Program Manager of ABS’ Labour and Income Branch, Jacqui Jones.

The trend monthly hours worked increased by 2.2 million hours (0.1 per cent), though it is still below the high in December 2015.

The trend unemployment rate decreased slightly (by less than 0.1 percentage points) to 5.6 per cent, and the participation rate decreased 0.1 percentage points but remained steady at 64.7 per cent in rounded terms.

sept-2016-employment

Trend series smooth the more volatile seasonally adjusted estimates and provide the best measure of the underlying behaviour of the labour market.

The seasonally adjusted number of persons employed decreased by 9,800 in September 2016. The seasonally adjusted unemployment rate for September 2016 decreased by 0.1 percentage points to 5.6 per cent, and the seasonally adjusted labour force participation rate decreased by 0.2 percentage points to 64.5 per cent.

The ABS seems to indicate concerns with the data quality: “The incoming rotation group in Queensland for September 2016 was considerably different to the rest of the Queensland sample and its influence has been temporarily reduced as part of the estimation process. The data will be further reviewed when October data are available”

Jobs Or Working Hours In The Labour Market?

Interesting paper from the RBA, released today, “Jobs or Hours? Cyclical Labour Market Adjustment in Australia.” It looks at how the labour market has adjusted over the economic cycle, and concludes that in recent times reduced job working hours, rather than job cuts have been the order of the day. One reason why measuring underemployment is so vital.

They argue this is because of the more mild downturns, and labour hoarding.

We find that, while both employment and average hours worked tend to adjust over the cycle, the share of labour market adjustment due to changes in average hours worked has increased since the late 1990s. Indeed, the contribution of average hours to the cyclical variability in total hours worked has tripled, from 20 per cent over 1978–98 to 58 per cent over 1999–2016. Such a large increase in the importance of average hours adjustment was not observed in other developed economies.

jogbs-and-hoursSince the late 1990s, a larger share of cyclical labour market adjustment in Australia has come about via changes in average hours worked, as opposed to changes in employment. While empirical evidence is inconclusive (partly due to the difficulty in modelling average hours worked), our view is that the relatively short and shallow economic downturns in the 2000s have played a role in this. Had these downturns been more severe, like the recessions in the 1980s and 1990s, firms eventually may have needed to shed more workers than they did. In other words, it is likely that both employment and average hours tend to adjust in the early stages of a downturn, but relatively more adjustment occurs through employment as the downturn persists and becomes more severe. It is also possible that labour market reforms over recent decades have provided firms with more scope to reduce their use of labour by reducing working hours rather than by redundancies.

We also find that the main driver of the adjustment in average hours during the 2008–09 economic downturn was a reduction in hours worked for employees who remained in the same job (i.e. labour hoarding). Consistent with this, a longer-run historical analysis suggests that changes in the composition of employment have not been the main driver of the decline in average hours during downturns and recessions.

Trend Unemployment Unchanged At 5.7%

Monthly trend employment in Australia increased in August 2016, according to figures released by the Australian Bureau of Statistics (ABS) today.

emp-aug-2106

In August 2016, trend employment increased by 9,900 persons to 11,965,100 persons – a monthly growth rate of 0.1 per cent. Trend part-time employment growth continued, with an increase of 10,200 persons, while full-time employment decreased by 400 persons.

”The latest Labour Force release shows continued strength in part-time employment growth, with the majority coming from increasing male part-time employment. Since December 2015, there are now around 105,300 more persons working part-time, compared with a 21,500 decrease in those working full-time,” said the Program Manager of ABS’ Labour and Income Branch, Jacqui Jones.

The trend monthly hours worked increased by 1.7 million hours (0.1 per cent), although it remained below the high in December 2015, reflecting the shift in full-time and part-time employment.

In considering the contribution of the Census to employment, the ABS confirmed that it will have resulted in an increase in hours that were worked during the month, more than the persons in employment. “Of the majority of the persons who were employed for the Census, most already had another job, but worked more hours during the month,” Ms Jones said.

The trend unemployment rate remained steady at 5.7 per cent. The participation rate was also unchanged at 64.8 per cent. Both of these figures have been relatively steady since May 2016.

The trend underemployment rate, which is a quarterly measure of employed persons who want and are available to work more hours, increased by 0.1 percentage points since May 2016, to 8.6 per cent in August 2016, the highest it has ever been.

Trend series smooth the more volatile seasonally adjusted estimates and provide the best measure of the underlying behaviour of the labour market.

The seasonally adjusted number of persons employed decreased by 3,900 in August 2016. The seasonally adjusted unemployment rate for August 2016 decreased by 0.1 percentage points to 5.6 per cent, and the seasonally adjusted labour force participation rate decreased by 0.2 percentage points to 64.7 per cent.

Trend employment growth continues

Monthly trend employment in Australia increased in July 2016, according to figures released by the Australian Bureau of Statistics (ABS) today. However, there are significant state variations as well as movements between full-time and part-time work. Younger Australians and females are more likely to be unemployed.  Beware the national averages!

The trend unemployment rate remained steady at 5.7 per cent. The participation rate also remained steady at 64.8 per cent. These figures have been constant since May 2016.

July16UnemploymentIn July 2016, trend employment increased by 11,800 persons to 11,955,100 persons – a monthly growth rate of 0.1 per cent. Trend part-time employment growth continued, with an increase of 10,600 persons, while full-time employment increased by 1,200 persons.

“The latest Labour Force release shows continued strength in part-time employment growth. Over the past six months there has been an increase of 82,600 people working part-time, compared with a 21,600 decrease in those working full-time,” said the Program Manager of ABS’ Labour and Income Branch, Jacqui Jones.

The trend monthly hours worked in all jobs increased by 0.9 million hours (0.06 per cent), although it remained slightly below the high in December 2015.

Trend series smooth the more volatile seasonally adjusted estimates and provide the best measure of the underlying behaviour of the labour market.

The seasonally adjusted number of persons employed increased by 26,200 in July 2016. The seasonally adjusted unemployment rate for July 2016 decreased by 0.1 percentage points to 5.7 per cent and the seasonally adjusted labour force participation rate remained unchanged at 64.9 per cent.

It appears that full-time and part-time unemployment are moving differently, with a rise in both male and female part-time rates.

July16Unemployment1Younger Australians have much higher, and rising unemployment.

July16Unemployment2There are significant variations across states, with several, including WA, QLD, TAS and SA above 6%, whilst ACT and NT have much lower rates.

July16Unemployment3The trends tell the story, with rates falling in NSW and VIC, whilst rising in QLD and WA.

July16Unemployment4