Is Record High Consumer Debt a Boon or Bane?

From The St.Louis Fed on The Economy Blog.

Amidst of lot of captivating headlines over the last few months, one may have missed the news that consumer debt has hit an all-time high of 26 percent of disposable income, as seen in the chart below.

In just the past five years, consumer debt (all household debts, excluding mortgages and home equity loans) has grown at about twice the pace of household income. This has largely been driven by strong growth in both auto and student lending.

But what does this say about the economy? Is it a sign of optimism or a cause for concern?

Increasing Debt Levels

Rising household debt levels could mean that:

  • More Americans are optimistic about the U.S. economy.
  • More people are making investments in assets that generally build wealth, like higher education and homes.
  • Consumers have paid off their loans to qualify for new ones.

At the same time, higher debt levels could reveal financial stress as families use debt to finance consumption of necessities. It could portend new waves of delinquencies and, eventually, defaults that displace these kinds of investments. And rising family debts could slow economic growth and, of course, even lead to a recession.

Three Key Themes

This dual nature of household debt is precisely why the Center for Household Financial Stability organized our second Tipping Points research symposium on household debts. We did so this past June in New York, in partnership with the Private Debt Project

We recently released the symposium papers, which were authored by my colleagues William R. Emmons and Lowell R. Ricketts and several leading economists, such as Karen Dynan and Atif Mian. They offer fascinating insights about how, when and the extent to which household debt impacts economic growth.

Looking at all the papers and symposium discussions together, a few key themes emerged.

No. 1: Short-Term vs. Long-Term Debt

Despite an incomplete understanding of the drivers and mechanism of household debt, we learned that increases in household debts can boost consumption and GDP growth in the shorter term (within a year or two) but suppress them beyond that.

Whether and how household debt affects economic growth over the longer term depends on three things:

  • Whether family debts improve labor productivity or boost local demand for goods and services
  • The extent of leverage concurrently in the banking sector, which is much less evident today than a decade ago
  • The stability of the assets, such as housing, being purchased with those debts

No. 2: Magnitude of Risk

Even with record-high levels of consumer debts, most symposium participants did not see household debts posing a systemic risk to the economy at the moment, though trends in student borrowing, auto loans and (perhaps) credit card debts are troubling to those borrowers and in those sectors.

Moreover, rising debt can be a drag on economic growth even if not a systemic risk, and longer-term reliance on debt to sustain consumption remains highly concerning as well.

No. 3: Public Policy

Public policy responses should also be considered. Factors that could further burden indebted families and impede economic growth include:

  • Low productivity growth
  • Higher interest rates
  • New banking and financial sector regulations
  • Rising higher-education costs

Indeed, levels of household debt have often served as a reflection of larger, structural, technological, demographic and policy forces that help or harm consumers. It only makes sense, then, that policy and institutional measures must be considered to ameliorate debt levels and their impact on families and the economy.

After all, what’s good for families is good for the economy, and vice versa.

When Holding Cash Beats Paying Debt

From The US On The Economy Blog.

For families who are struggling financially, there are times when it is better to keep some cash on hand, even if they hold high-interest debt.

A recent In the Balance article highlights the importance of emergency savings to the financial stability of struggling households. It was authored by Emily Gallagher, a visiting scholar at the St. Louis Fed’s Center for Household Financial Stability, and Jorge Sabat, a research fellow at the Center for Social Development at Washington University in St. Louis.

The Struggle to Make Ends Meet

Many families continue to struggle to make ends meet, the authors said, noting a recent Federal Reserve survey that estimated that almost half of U.S. households could not easily handle an emergency expense of just $400.

Given this, they asked: “Should more families be encouraged to hold a liquidity buffer even if it means incurring more debt in the short-term?”

In explaining why it might make sense, for example, to keep $1,000 in a low-earning bank account while owing $2,000 on a high-interest-rate credit card, Gallagher and Sabat’s research suggests this type of cash buffer greatly reduces the risk that a family will:

  • Miss a rent, mortgage or recurring bill payment
  • Be unable to afford enough food to eat
  • Be forced to skip needed medical care within the next six months

Linking Balance Sheets and Financial Hardship

Gallagher and Sabat investigated which types of assets and liabilities predicted whether a household would experience financial hardship over a six-month period.

Their survey encompassed detailed financial and demographic results that covered two time-period observations for the same household: one at tax time, and the other six months after tax time.

“This feature of our data set is ideal for capturing the probability that a household that is currently financially stable falls into financial hardship in the near term,” the authors explained. “Furthermore, the survey samples only from low-to-middle income households, our population of interest for understanding the antecedents of financial hardship.”

They tracked families in the first survey who said they hadn’t recently experienced any of these four main types of financial hardship:

  • Delinquency on rent or mortgage payments
  • Delinquency on regular bills, such as utility bills
  • Skipped medical care
  • Food hardship (going without needed food)

Gallagher and Sabat also asked if the family had any balances in:

  • Liquid assets, such as checking and saving accounts, money market funds and prepaid cards
  • Other assets, including businesses, real estate, retirement or education savings accounts
  • High-interest debt, such as that from credit cards or payday loans
  • Other unsecured debt, such as student loans, unpaid bills and overdrafts
  • Secured debt, including mortgages or debts secured by businesses, farms or vehicles

Controlling for factors such as income and demographics, they then tracked whether the 5,000 families in the survey had suffered a financial shock that would affect the results.

Cash on Hand Matters Most

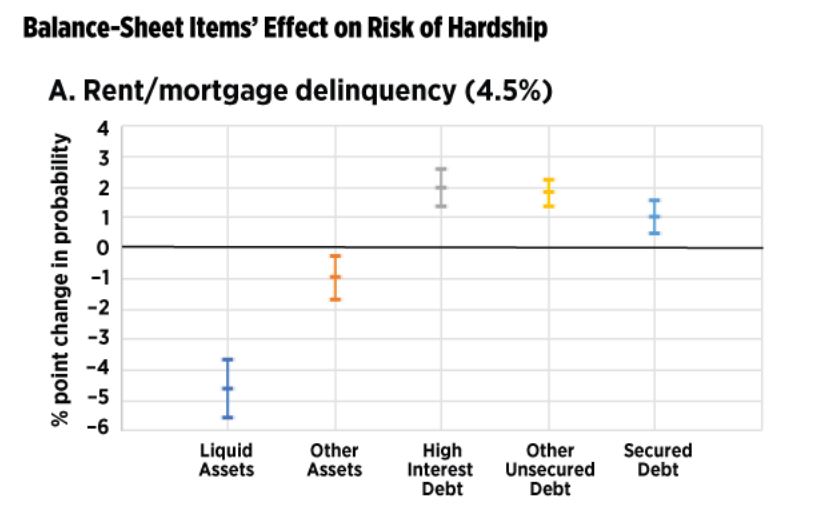
The authors found that having liquid assets or other assets always predicted lower risk of encountering hardship of any kind, while having debts generally increased the risk of hardship.

Liquid assets had the most predictive power, Gallagher and Sabat said. They noted that a $100 increase (from a mean of $6) was associated with a 4.6 percentage point reduction in a household’s probability of rent or mortgage delinquency.

Liquid assets also significantly reduced the likelihood of entering into more common forms of hardship. A $100 increase in liquidity was associated with declines in the rates of:

  • Regular bill delinquency (by 8.3 percentage points)
  • Skipped medical care (by 6.3 percentage points)
  • Food hardship (by 5.2 percent percentage points)

“These estimated effects are substantial relative to the probability of encountering each hardship,” they said.

Conclusion

“Our findings suggest that households should be encouraged to maintain at least a small buffer of liquid savings, even if the cash in that buffer is not being used to pay down high-interest debt,” Gallagher and Sabat concluded.

FED Lifts Rate As Expected

The FED has lifted the federal funds rate to 1.5% after their two day meeting – the third hike this year. The move was expected and had been well signalled.  This despite inflation still running below target, though they expect it will move to 2% later.  More rate rises are expected  in 2018.  This will tend to propagate through to other markets later.

Information received since the Federal Open Market Committee met in November indicates that the labor market has continued to strengthen and that economic activity has been rising at a solid rate. Averaging through hurricane-related fluctuations, job gains have been solid, and the unemployment rate declined further. Household spending has been expanding at a moderate rate, and growth in business fixed investment has picked up in recent quarters. On a 12-month basis, both overall inflation and inflation for items other than food and energy have declined this year and are running below 2 percent. Market-based measures of inflation compensation remain low; survey-based measures of longer-term inflation expectations are little changed, on balance.

Consistent with its statutory mandate, the Committee seeks to foster maximum employment and price stability. Hurricane-related disruptions and rebuilding have affected economic activity, employment, and inflation in recent months but have not materially altered the outlook for the national economy. Consequently, the Committee continues to expect that, with gradual adjustments in the stance of monetary policy, economic activity will expand at a moderate pace and labor market conditions will remain strong. Inflation on a 12‑month basis is expected to remain somewhat below 2 percent in the near term but to stabilize around the Committee’s 2 percent objective over the medium term. Near-term risks to the economic outlook appear roughly balanced, but the Committee is monitoring inflation developments closely.

In view of realized and expected labor market conditions and inflation, the Committee decided to raise the target range for the federal funds rate to 1-1/4 to 1‑1/2 percent. The stance of monetary policy remains accommodative, thereby supporting strong labor market conditions and a sustained return to 2 percent inflation.

In determining the timing and size of future adjustments to the target range for the federal funds rate, the Committee will assess realized and expected economic conditions relative to its objectives of maximum employment and 2 percent inflation. This assessment will take into account a wide range of information, including measures of labor market conditions, indicators of inflation pressures and inflation expectations, and readings on financial and international developments. The Committee will carefully monitor actual and expected inflation developments relative to its symmetric inflation goal. The Committee expects that economic conditions will evolve in a manner that will warrant gradual increases in the federal funds rate; the federal funds rate is likely to remain, for some time, below levels that are expected to prevail in the longer run. However, the actual path of the federal funds rate will depend on the economic outlook as informed by incoming data.

Voting for the FOMC monetary policy action were Janet L. Yellen, Chair; William C. Dudley, Vice Chairman; Lael Brainard; Patrick Harker; Robert S. Kaplan; Jerome H. Powell; and Randal K. Quarles. Voting against the action were Charles L. Evans and Neel Kashkari, who preferred at this meeting to maintain the existing target range for the federal funds rate.

Fed Keeps Countercyclical Capital Buffer at 0 percent

The Federal Reserve Board announced on Friday it has voted to affirm the Countercyclical Capital Buffer (CCyB) at the current level of 0 percent. In making this determination, the Board followed the framework detailed in the Board’s policy statement for setting the CCyB for private-sector credit exposures located in the United States.

The buffer is a macroprudential tool that can be used to increase the resilience of the financial system by raising capital requirements on internationally active banking organizations when there is an elevated risk of above-normal future losses and when the banking organizations for which capital requirements would be raised by the buffer are exposed to or are contributing to this elevated risk–either directly or indirectly. The CCyB would then be available to help banking organizations absorb higher losses associated with declining credit conditions. Implementation of the buffer could also help moderate fluctuations in the supply of credit.

The Board consulted with the Federal Deposit Insurance Corporation and the Office of the Comptroller of the Currency in making this determination. Should the Board decide to modify the CCyB amount in the future, banking organizations would have 12 months before the increase became effective, unless the Board establishes an earlier effective date.

Fed Lifts Smaller Mortgage Loan Threshold

The Consumer Financial Protection Bureau (CFPB), Board of Governors of the Federal Reserve System, and Office of the Comptroller of the Currency (OCC) today announced that the threshold for exempting loans from special appraisal requirements for higher-priced mortgage loans during 2018 will increase from $25,500 to $26,000.

The threshold amount will be effective January 1, 2018, and is based on the annual percentage increase in the Consumer Price Index for Urban Wage Earners and Clerical Workers (CPI-W) as of June 1, 2017.

The Dodd-Frank Wall Street Reform and Consumer Protection Act of 2010 amended the Truth in Lending Act to add special appraisal requirements for higher-priced mortgage loans, including a requirement that creditors obtain a written appraisal based on a physical visit to the home’s interior before making a higher-priced mortgage loan.

The rules implementing these requirements contain an exemption for loans of $25,000 or less and also provide that the exemption threshold will be adjusted annually to reflect increases in the CPI-W. If there is no annual percentage increase in the CPI-W, the agencies will not adjust this exemption threshold from the prior year. However, in years following a year in which the exemption threshold was not adjusted, the threshold is calculated by applying the annual percentage change in CPI-W to the dollar amount that would have resulted, after rounding, if the decreases and any subsequent increases in the CPI-W had been taken into account.

Where Do Consumers Fit in the Fintech Stack?

An excellent speech from Federal Reserve Governor Lael Brainard on the opportunities for innovation in customer facing services enabled by the digital revolution and the risks arising – specifically looking at “financial autopilots”.

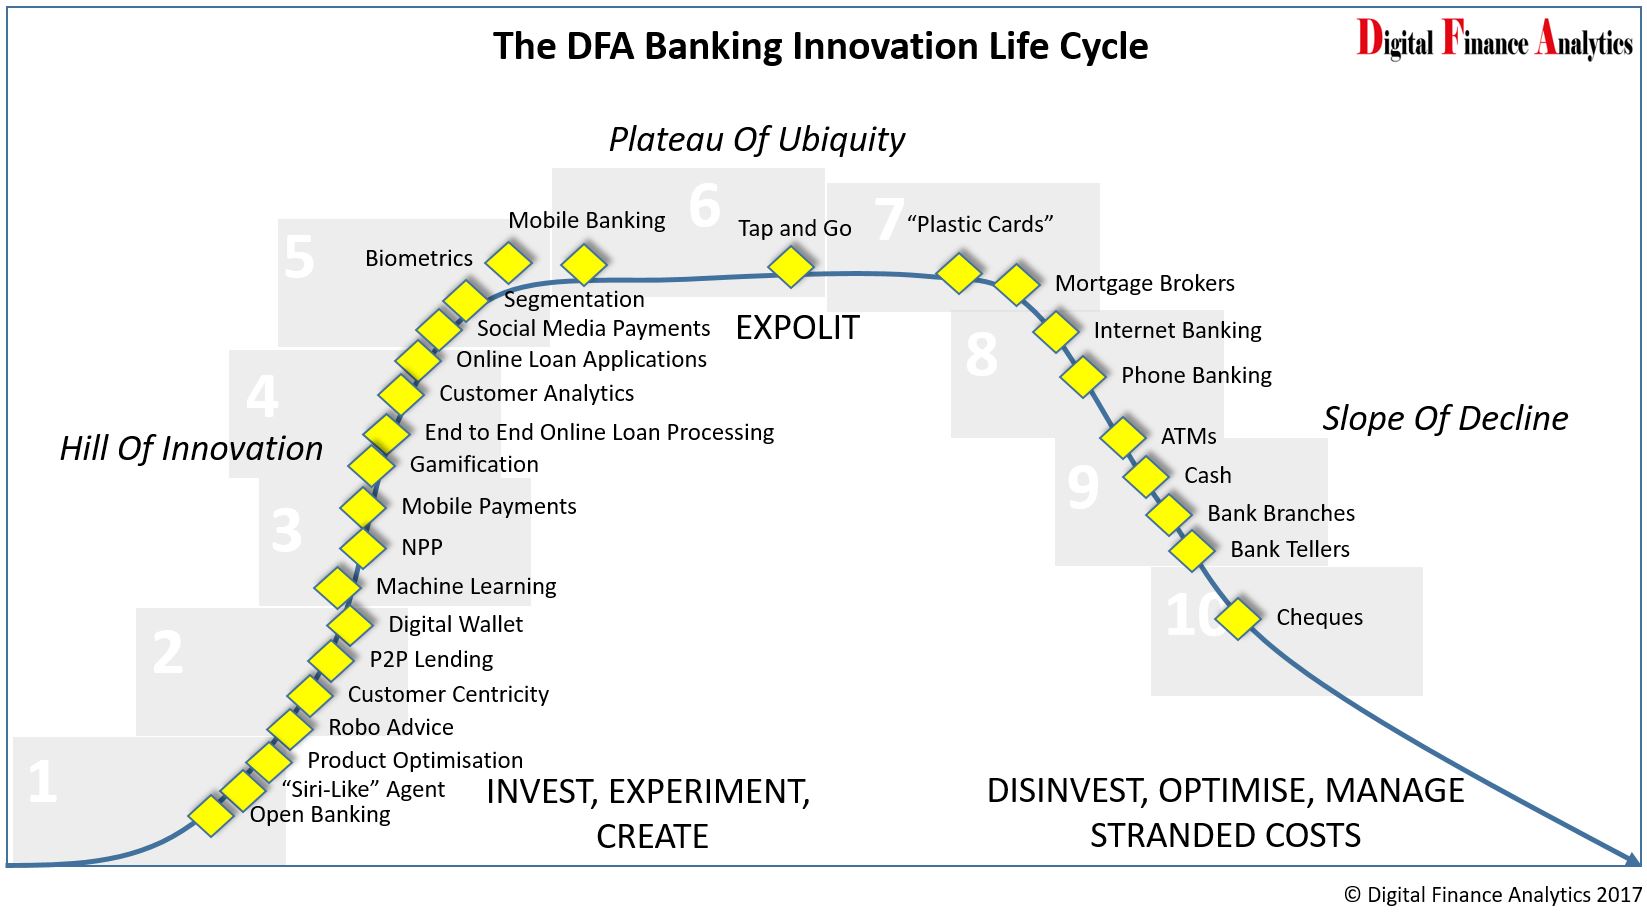
As we have been highlighting, the evolutionary path is changing fast, see, our “Quiet Revolution” report, published just this week.  We track this path using our innovation life cycle mapping, updated below.

Here is the Governor’s speech:

The new generation of fintech tools offers the potential to help consumers manage their increasingly complicated financial lives, but also poses risks that will need to be managed as the marketplace matures.

In many ways, the new generation of fintech tools can be seen as the financial equivalent of an autopilot. The powerful new fintech tools represent the convergence of numerous advances in research and technology–ranging from new insights into consumer decisionmaking to a revolution in available data, cloud computing, and artificial intelligence (AI). They operate by guiding consumers through complex decisions by offering new ways of looking at a consumer’s overall financial picture or simplifying choices, for example with behavioral nudges.

As consumers start to rely on financial autopilots, however, it is important that they remain in the driver’s seat and have a good handle on what is happening under the hood. Consumers need to know and decide who they are contracting with, what data of theirs is being used by whom and for what purpose, how to revoke data access and delete stored data, and how to seek relief if things go wrong. In short, consumers should remain in control of the data they provide. In addition, consumers should receive clear disclosure of the factors that are reflected in the recommendations they receive. If these issues can be appropriately addressed, the new fintech capabilities have enormous potential to deliver analytically grounded financial services and simplified choices, tailored to the consumers’ needs and preferences, and accessible via their smartphones.

Consumers Face Complex Financial Choices
When the first major “credit card,” the Diner’s Club Card, was introduced in 1949, consumers could only use the cardboard card at restaurants and, importantly, only if they paid the entire amount due each month. Today, the average cardholder has about four credit cards, and the Federal Reserve Bank of New York estimates that American consumers collectively carry $785 billion in credit card debt.

When signing up for a credit card, consumers face a bewildering array of choices. Half of consumers report that they select new cards based on reward programs, weighing “cash back” offers against “points” with their credit card provider that may convert into airline or hotel “miles,” which may have varying values depending on how they are redeemed. In some cases, rewards may apply to specific spending categories that rotate by quarter and require that consumers re-register each term, and the rewards may expire or be forfeited under complicated terms.

In some cases, the choices may be confusing. Let’s take the example of zero percent interest credit card promotions. A consumer may choose a zero percent interest credit card promotion and expect to pay no interest on balances during a promotional period, after which any balances are assessed at a higher rate of interest going forward. But if a consumer instead chooses a zero percent interest private-label credit card with deferred interest and has a positive balance when the promotional period expires, interest could be retroactively assessed for the full time they held a balance during the promotional period. Even sophisticated consumers could be excused for confusing these products.

As it turns out, it is often the most vulnerable consumers who have to navigate the most complicated products. For instance, one recent study of the credit card market found that the average length of agreements for products offered to subprime consumers was 70 percent longer than agreements for other products.

The complexity multiplies when we go beyond credit cards and consider other dimensions of consumers’ financial lives. The Federal Deposit Insurance Corporation has found that nearly a quarter of the Americans that don’t maintain bank accounts are concerned that bank fees are too unpredictable. Even though mortgage debt is over two-thirds of household debt, nearly half of consumers don’t comparison shop before taking out a mortgage. Student loans now make up 11 percent of total household debt, more than twice its share in 2008. Over 11 percent of student debt is more than 90 days delinquent or in default–and researchers at the Federal Reserve Bank of New York estimate that this figure may understate the problem by as much as half.

Today, consumers navigate numerous weighty financial responsibilities for themselves and their dependents.  It seems fair to assume they could use some help managing this complexity. In the Federal Reserve Board’s annual Survey of Household Economics and Decisionmaking (SHED), more than half of respondents reported that their spending exceeded their income in the prior year.  Indeed, 44 percent of SHED respondents reported that they could not cover an emergency expense costing $400 without selling something or borrowing money.

New Tools to Help Consumers Manage Their Finances
Given the complexity and importance of these decisions, it is encouraging to see the fast-growing development of advanced, technology-enabled tools to help consumers navigate the complex issues in their financial lives. These tools build on important advances in our understanding of consumer financial behavior and the applications, or “app,” ecosystem.

Researchers have invested decades of work exploring how consumers actually make decisions. We all tend to use shortcuts to simplify financial decisions, and it turns out many of these can prove faulty, particularly when dealing with complex problems.  For example, empirical evidence consistently shows that consumers overvalue the present and undervalue the future.  Researchers have documented that consumers make better savings decisions when they are presented with fewer options.  They have shown the importance of “anchoring” bias–the tendency to place disproportionate weight on the first piece of information presented. This bias can lead consumers either to make poor financial choices or instead to tip the scales in favor of beneficial choices, as with automatic savings defaults.  Similarly, “nudges” can help consumers in the right circumstances or instead backfire in surprising ways.

These behavioral insights are especially powerful when paired with the remarkable advances we have seen in the technological tools available to the average consumer, especially through their smartphones. Smartphones are ubiquitous. The 2016 Federal Reserve Survey of Consumer and Mobile Financial Services (SCMF) found that 87 percent of the U.S. adult population had a mobile phone, the vast majority of which were smartphones. Smartphone use is prevalent even among the unbanked and underbanked populations. Survey evidence suggests we are three times more likely to reach for our phone than our significant other when we first wake up in the morning.

Some evidence suggests that smartphones are already helping consumers make better financial decisions. The 2016 SCMF found that 62 percent of mobile banking users checked their account balances on their phones before making a large purchase, and half of those that did so decided not to purchase an item as a result.  In addition, 41 percent of smartphone owners checked product reviews or searched product information online while shopping in a retail store, and 79 percent of those respondents reported changing their purchase decision based on the information they accessed on their smartphone.

And those use cases just scratch the surface of what is possible. First of all, the smartphone platform has become a launch pad for a whole ecosystem of apps created by outside developers for a wide variety of services, including helping consumers manage their financial lives.

Second, the smartphone ecosystem puts the enormous computing power of the cloud at the fingertips of consumers. Interfacing with smartphone platforms and other apps, outside developers can tap the computing power of the leading cloud computing providers in building their apps. Importantly, cloud computing offers not only the power to process and store data, but also powerful algorithms to make sense of it. Due to early commitment to open-source principles, app developers have open access to many of the same machine-learning and artificial intelligence tools that power the world’s largest internet companies.  Further, the major cloud computing providers have now taken these free building blocks and created different machine-learning and artificial intelligence stacks on their cloud platforms. A developer that wants to incorporate artificial intelligence into their financial management app can access off-the-shelf models of cloud computing providers, potentially getting to market faster than by taking the traditional route of finding training data and building out models in-house from scratch.

Third, fintech developers can also draw from enormous pools of data that were previously unavailable outside of banking institutions. Consumer financial data are increasingly available to developers via a new breed of business-to-business suppliers, called data aggregators. These companies enable outside developers to access consumer account and transactional information typically stored by banks. But aggregators do more than just provide access to raw data. They facilitate its use by developers, by cleaning the data, standardizing it across institutions, and offering their own application programming interfaces for easy integration. Further, similar to cloud computing providers, data aggregators are also beginning to provide off-the-shelf product stacks on their own platforms. This means that developers can quickly and easily incorporate product features, such as predicting creditworthiness, determining how much a consumer can save each month, or creating alerts for potential overdraft charges.

Researchers have documented the benefits of tailored one-on-one financial coaching. Until recently, though, it has been hard to deliver that kind of service affordably and at scale, due to differences in consumers’ circumstances. Let’s again consider the example of deferred interest credit cards. It turns out only a small minority of consumers miss the deadlines for repaying promotional balances and are charged retroactive interest payments, and they typically have deep subprime scores.  Similarly, for consumers that opt into overdraft products on their checking accounts, 8 percent of consumers pay 75 percent of the fees.  Up until now, it has been hard for consumers to understand those odds and objectively assess whether they are likely to be in the group of customers that will face challenges with a particular financial product. The convergence of smartphone ubiquity, cloud computing, data aggregation, and off-the-shelf AI products offer the potential to make tailored financial advice scalable. For instance, a fintech developer could pair historical data about how different types of consumers fare with a specific product, on the one hand, with a consumer’s particular financial profile, on the other hand, to make a prediction about how that consumer is likely to fare with the product.

The Evolution of Financial Autopilots
Since the early days of internet commerce, developers have tried to move beyond simple price comparison tools to offer tailored “agents” for consumers that can recommend products based on analyses of individual behavior and preferences.  Today, a new generation of personal financial management tools seems poised to make that leap. When a consumer wishes to select a new financial product, he or she can now solicit options from a number of websites and mobile apps. These new comparison sites can walk the consumer through a wide array of financial products, offering to compare features like rewards, fees, and rates, or tailoring to a consumer’s stated goals. Some fintech advisors ask consumers to provide access to their bank accounts, retirement accounts, college savings accounts, and other investment platforms in order to enable a fintech advisor to offer a consumer a single, near complete picture of his balances and cash flows across different institutions.

In reviewing the advertising, terms and conditions, and apps of an array of fintech advisors, it appears that many of these tools offer advanced data analysis, machine learning, and even artificial intelligence to help consumers cut down on unnecessary spending, set aside money for savings, and use healthy nudges to improve their financial decisions. For instance, a fintech advisor may help a consumer automate savings “rules,” like rounding up charges and putting the difference into savings, enabling these small balances to accumulate over time or setting a small amount of money aside every time a consumer spends money on little splurges.

The early stages of innovation inevitably feature a lot of learning from trial and error. Fortunately, as the fintech ecosystem advances, there are useful experiences and good practices to draw upon from the evolution of the commercial internet. To begin with, one internet adage is that if a product is free, “you are the product.”  In this vein, fintech advisors frequently offer free services to consumers and earn their revenue from the credit cards and other financial products that they recommend through lead generation.

Of course, many fintech advisors are not lead generators. Some companies offer fee-for-service models, with consumers paying a monthly fee for the product. Other companies are paid by employers, who then provide the products free of charge to their employees as an employee benefit. In these cases, they likely have quite different business models.

But for those services that do act as lead generators, there are important considerations about whether and how best to communicate information to the consumer about the nature of the recommendations being made. For instance, according to some reports, fintech advisors can make between $100 and $700 in lead generation fees for every customer that signs up for a credit card they recommend.

In many cases, a fintech advisor may describe their service as providing tailored advice or making recommendations as they would to friends and family. In such cases, a consumer might not know whether the order in which products are presented by a fintech assistant is based on the product’s alignment with his or her needs or different considerations. Different fintech advisors may order the lists they show consumers using different criteria. A product may be at the top of the advisor’s recommendations because the sponsoring company has paid the advisor to list it at the top, or the sponsoring company may pay the fintech assistant a high fee, contingent upon the consumer signing up for the product. Alternatively, a fintech advisor may change the order of the loan offers or credit cards based on the likelihood that the consumer will be approved. Moreover, in some cases, the absence of lead generation fees for a particular product may impact whether that product is on the list shown to consumers at all.

There appears to be a wide variety of practices regarding the prominence and placement of advertising and other disclosures relative to the advice and recommendations such firms provide. Overall, fintech assistants have increasingly improved the disclosures that explain to consumers how they get paid, but this is still a work in progress.

The good news is that these challenges are not new. The experience with internet search engines outside of financial products, such as Google, Bing, and Yahoo!, as well as with other product comparison sites, such as Travelocity and Yelp, may provide useful guidance. As consumers and businesses have adapted to the internet, we have, collectively, adopted norms and standards for how we can expect search and recommendation engines to operate. In particular, we generally expect that search results will be included and ranked based on what’s organically most responsive to the search–unless it is clearly labeled otherwise.  Accordingly, when we search for a product, we now know to look for visual cues that identify paid search results, usually in the form of a text label like “Sponsored” or “Ad”, different formatting, and visually separating advertising from natural search results.  Even when an endorsement is made in a brief Twitter update, we now expect disclosures to be clear and conspicuous.

As fintech advisors evolve to engage consumers in new ways, disclosure methodologies will no doubt be expected to adapt as well. For instance, some personal financial management tools now interact with consumers via text message. If consumers move to a world in which most of their interactions with their advisors occur via text-messaging “chatbots”–or voice communication–I am hopeful that industry, regulators, consumers, and other stakeholders will work together to adapt the norms to distinguish between advice and sponsored recommendations.

The Data Relationship
While the lead generation revenue model presents some familiar issues that are readily apparent, under the hood, fintech relationships raise even more complex issues for consumers in knowing who they are providing their data to, how their data will be used, for how long, and what to expect in the case of a breach or fraud. Let me briefly touch on each issue in turn.

Often, when a consumer signs up with a fintech advisor or other fintech app, they are asked to log into their bank account in order to link the fintech app with their bank account data. In reviewing apps’ enrollment processes, it appears that consumers are often shown log-in screens featuring bank logos and branding, prompting consumers to enter their online banking logins and passwords. In many cases, the apps note that they do not store the consumers’ banking credentials.

When the consumer logs on, he or she is often not interfacing with a banks’ computer systems, but rather, providing the bank account login and password to a data aggregator that provides services to the fintech app. In many cases, the data aggregator may store the password and login and then use those credentials to periodically log into the consumer’s bank account and copy available data, ranging from transaction data, to account numbers, to personally identifiable information. In other cases, things work differently under the hood. Some banks and data aggregators have agreed to work together to facilitate the ability to share data with outside developers in authorized ways. These agreements may delineate what types of data will be shared, and authorization credentials may be tokenized so that passwords are never stored by the aggregator.

It is often hard for the consumer to know what is actually happening under the hood of the financial app they are accessing. In most cases, the log in process does not do much to educate the consumer on the precise nature of the data relationship. Screen scraping usually invokes the bank’s logo and branding but infrequently shows the logo or name of the data aggregator. In reviewing many apps, it appears that the name of the data aggregator is frequently not disclosed in the fintech app’s terms and conditions, and a consumer generally would not easily see what data is held by a data aggregator or how it is used. The apps, websites, and terms and conditions of fintech advisors and data aggregators often do not explain how frequently data aggregators will access a consumer’s data or how long they will store that data.

Recognizing this is a relatively young field, but one that is growing fast, there are a myriad of questions about the consumer’s ability to opt out and control over data that will need to be addressed appropriately. In examining the terms and conditions for a number of fintech apps, it appears that consumers are rarely provided information explaining how they can terminate the collection and storage of their data. For instance, when a consumer deletes a fintech app from his or her phone, it is not clear this would guarantee that a data aggregator would delete the consumer’s bank login and password, nor discontinue accessing transaction information. If a consumer severs the data access, for instance by changing banks or bank account passwords, it is also not clear how he or she can instruct the data aggregator to delete the information that has already been collected. Given that data aggregators often don’t have consumer interfaces, consumers may be left to find an email address for the data aggregator, send in a deletion request, and hope for the best.

If things go wrong, consumers may have limited remedies. In reviewing terms, it appears that many fintech advisors include contractual waivers that purport to limit consumers’ ability to seek redress from the advisor or an underlying data aggregator. In some cases, the terms and conditions assert that the fintech developer and its third-party service providers will not be liable to consumers for the performance of or inability to use the services. It is not uncommon to see terms and conditions that limit the fintech adviser’s liability to the consumer to $100.

Traditionally, under the Electronic Funds Transfer Act and its implementing Regulation E, consumers have had protections to mitigate their losses in the event of erroneous or fraudulent transactions that would otherwise impact their credit and debit cards, such as data breaches. Those protections are not absolute, however.  In particular, if a consumer gives another person an “access device” to their account and grants them authority to make transfers, then the consumer is “fully liable” for transfers made by that person, even if that person exceeds his or her authority, until the consumer notifies the bank.  As the industry matures, the various stakeholders will need to develop a shared understanding of who bears responsibility in the event of a breach.

Shared Responsibility and Shared Benefit Moving Forward
So what can be done to make sure consumers have the requisite information and control to remain squarely in the driver’s seat? Establishing and implementing new norms is in the shared interest of all of the participants in the fintech stack. For instance, in the case of credit cards, mortgages, and many other products, it is often banks or parties closely affiliated with banks that pay fees to fintech advisors to generate leads for their products, pursuant to a contract. Through these contractual relationships with fintech advisors, banks have considerable influence in the lead generation relationship, including through provisions describing how a sponsored product should be described or displayed. Banks have a stake in ensuring that their vendors and third-party service providers act appropriately, that consumers are protected and treated fairly, and that the banks’ reputations aren’t exposed to unnecessary risk.  Likewise, some of the leading speech-only financial products are currently credit card and bank products. Accordingly, banks have incentives to invest in innovating the way they disclose information to consumers, as they also invest in new ways of interacting with them.

As for consumers’ relationships with data aggregators, there’s an increasing recognition that consumers need better information about the terms of their relationships with aggregators, more control over what is shared, and the ability to terminate the relationship.  We have spoken to data aggregators who recognize the importance of finding solutions to many of the complex issues involved with the important work of unlocking the potential of the banking stack to developers. And while there are some difficult issues in this space, other issues seem relatively straightforward. It shouldn’t be hard for a consumer to be informed who they are providing their credentials to. Consumers should have relatively simple means of being able to consent to what data are being shared and at what frequency. And consumers should be able to stop data sharing and request the deletion of data that have been stored.

Responsibility for establishing appropriate norms in the data aggregation space should be shared, with banks, data aggregators, fintech developers, consumers, and regulators all having a role.  Banks and data aggregators are negotiating new relationships to determine how they can work together to provide consumers access to their data, while also ensuring that the process is secure and leaves consumers in the driver’s seat.  In many cases, banks themselves were often the original customers of data aggregators, and many continue to use these services. According to public filings, more than half of the 20 largest banks are customers of data aggregators.  The banks have an opportunity as customers of data aggregation services to ensure that the terms of data provision protect consumers’ data and handle it appropriately.

Regulators also recognize that there may be opportunities to provide more clarity about how the expectations about third-party risk management would work in this sector, as well as other areas experiencing significant technological change. Through external outreach and internal analysis, we are working to determine how best to encourage socially beneficial innovation in the marketplace, while ensuring that consumers’ interests are protected. We recognize the importance of working together and the potential to draw upon existing policies, norms, and principles from other spaces. Consumers may not fully understand the differences in regulations across financial products or types of financial institutions, or whether the rules change when they move from familiar search and e-commerce platforms to the fintech stack. Consumers, as well as the market as a whole, will benefit if regulators coordinate to provide more unified messages and support the development of standards that serve as a natural extension of the common-sense norms that consumers have come to expect in other areas of the commercial internet.

Conclusion
The combination of technologies that put vast computing power, rich data sets, and artificial intelligence onto simple smartphone apps together with important research into consumer financial behaviors has great potential to help consumers navigate their complex financial lives more effectively, but there are also important risks. I am hopeful that fintech developers, data aggregators, bank partners, consumers, and regulators will work together to keep consumers in the driver’s seat as we move forward with these new technologies. If we work together effectively toward this goal, the fintech stack may be able to offer enormous benefits to the consumers they aim to serve, while appropriately identifying and managing the risks.

 

Is Peer To Peer Lending Mirroring Sub-Prime?

An interesting paper from the Federal Reserve Bank of Cleveland “Three Myths about Peer-to-Peer Loans” suggests these platforms, which have experienced phenomenal growth in the past decade, resemble predatory loans in terms of the segment of the consumer market they serve and their impact on consumers’ finances and have a negative effect on individual borrowers’ financial stability.

This is of course what triggered the 2007 financial crisis. There is no specific regulation in the US on the borrower side.  Given that P2P lenders are not regulated or supervised for antipredatory laws, lawmakers and regulators may need to revisit their position on online lending marketplaces.

While P2P lending hasn’t changed much from the borrowers’ perspective since 2006, the composition and operational characteristics of investors have changed considerably. Initially, the P2P market was conceived of as individual investors lending to individual borrowers (hence the name, “peer-to-peer”). Yet even from the industry’s earliest days, P2P borrowers attracted institutional investors, including hedge funds, banks, insurance companies, and asset managers. Institutions are now the single largest type of P2P investor, and the institutional demand is almost solely responsible for the dramatic, at times triple-digit, growth of P2P loan originations (figure 2).

The shift toward institutional investors was welcomed by those concerned with the stability of the financial sector. In their view, the P2P marketplace could increase consumers’ access to credit, a prerequisite to economic recovery, by filling a market niche that traditional banks were unable or unwilling to serve. The P2P marketplace’s contribution to financial stability and economic growth came from the fact that P2P lenders use pools of private capital rather than federally insured bank deposits.

Regulations in the P2P industry are concentrated on investors. The Securities and Exchange Commission (SEC) is charged with ensuring that investors, specifically unaccredited retail investors, are able to understand and absorb the risks associated with P2P loans.

On the borrower side, there is no specific regulatory body dedicated to overseeing P2P marketplace lending practices. Arguably, many of the major consumer protection laws, such as the Truth-in-Lending Act or the Equal Credit Opportunity Act, still apply to both P2P lenders and investors. Enforcement is delegated to local attorney general offices and is triggered by repeat violations, leaving P2P borrowers potentially vulnerable to predatory lending practices.

Signs of problems in the P2P market are appearing. Defaults on P2P loans have been increasing at an alarming rate, resembling pre-2007-crisis increases in subprime mortgage defaults, where loans of each vintage perform worse than those of prior origination years (figure 1). Such a signal calls for a close examination of P2P lending practices. We exploit a comprehensive set of credit bureau data to examine P2P borrowers, their credit behavior, and their credit scores. We find that, on average, borrowers do not use P2P loans to refinance pre-existing loans, credit scores actually go down for years after P2P borrowing, and P2P loans do not go to the markets underserved by the traditional banking system.1 Overall, P2P loans resemble predatory loans in terms of the segment of the consumer market they serve and their impact on consumers’ finances. Given that P2P lenders are not regulated or supervised for antipredatory laws, lawmakers and regulators may need to revisit their position on online lending marketplaces.


How Has the Economy Performed around Fed Chair Transitions?

From The On The Economy Blog.

Jerome Powell has been nominated to be the next chair of the Federal Reserve Board. Historically, what has happened to economic growth following a transition?

Average Growth Sometimes Slows in the Short Term

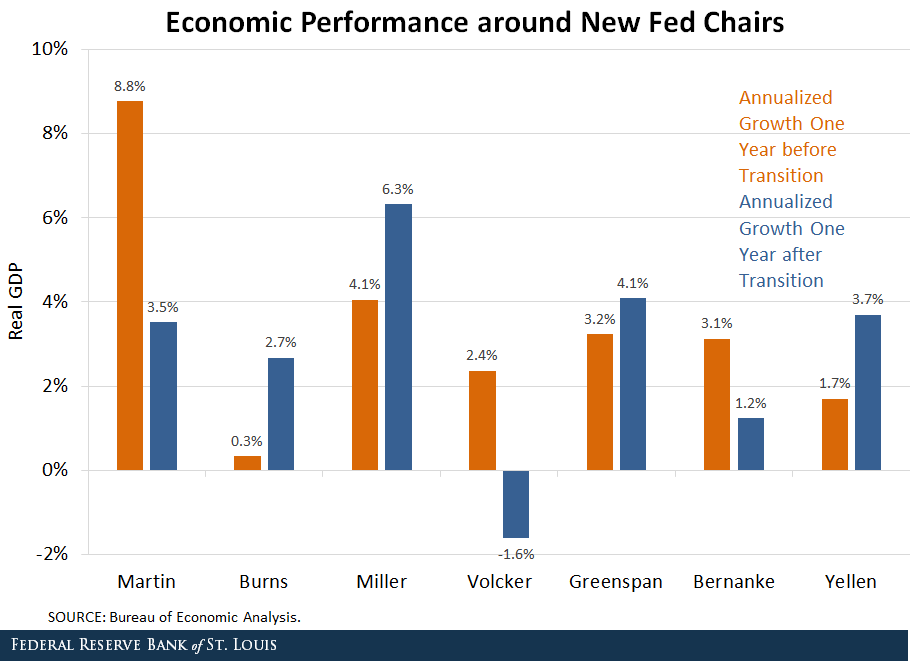
Whether a transition to a new Fed chair affects economic growth in the short term is not apparent at first glance, as can be seen in the figure below.

GDP per Fed Chair

Notable growth slowdowns occurred immediately after Chairs William McChesney Martin, Paul Volcker and Ben Bernanke took office. However, growth was stronger in the year after the terms began of Chairs Arthur Burns, G. William Miller, Alan Greenspan and Janet Yellen.

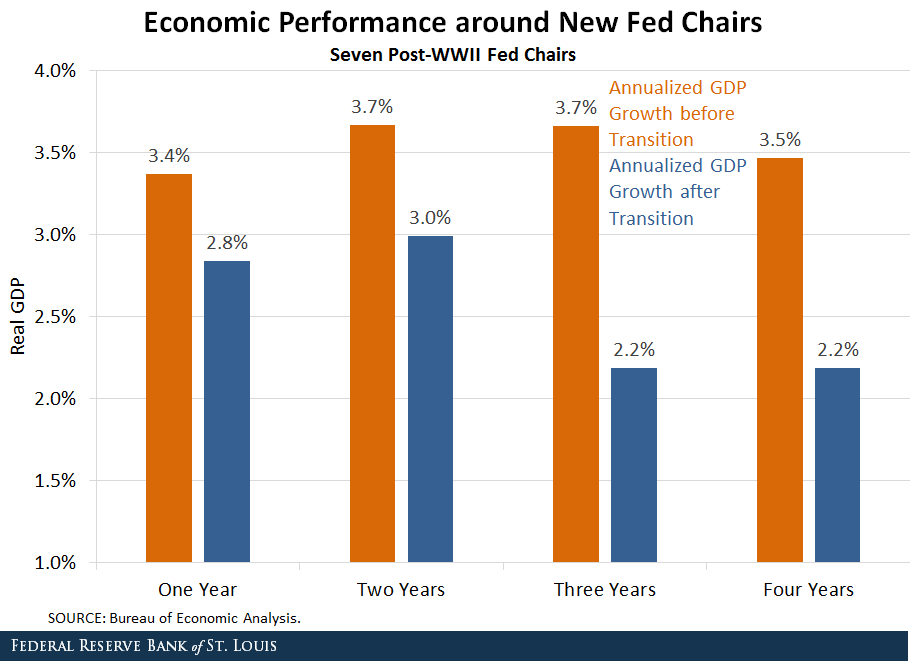
Taking the average of all seven Fed transitions since World War II, the economy grew about 0.6 percentage points more slowly in the year after a new Fed chair took office than during the year preceding the transition, as seen below.

GDP periods new Fed chair

Clearly, this is due to the very large slowdowns that occurred after Martin, Volcker and Bernanke took office. It was more common for growth to increase in the year after a transition than to decrease, but the magnitudes were smaller.

Average Growth More Often Slows over the Medium Term

In the two years following a Fed chair transition, average growth was about 0.7 percentage points less than during the two years prior to the transition, as seen in the figure above. Growth slowdowns in three-year and four-year before-and-after comparisons were somewhat larger, at 1.5 and 1.3 percentage points, respectively.

While only three of the seven transitions resulted in growth slowdowns at the two-year horizon, five of the seven transitions resulted in slower growth in both the three-year and four-year periods. In addition to transitions to Martin, Volcker and Bernanke, who experienced growth slowdowns at every horizon considered here, transitions to Miller and Greenspan also were followed with slower three- and four-year growth than had occurred prior to their terms.

Growth Slowdowns Are a Feature of the Recent Period, Too

It’s possible that early post-WWII Fed chairs faced unusual circumstances that aren’t relevant anymore:

  • Martin helped establish Fed independence from the Treasury after WWII and faced the disruption of the Korean War.
  • Burns served during the Vietnam War and, according to some observers, faced unusual political pressures.
  • Miller served the briefest term of all post-WWII chairs.

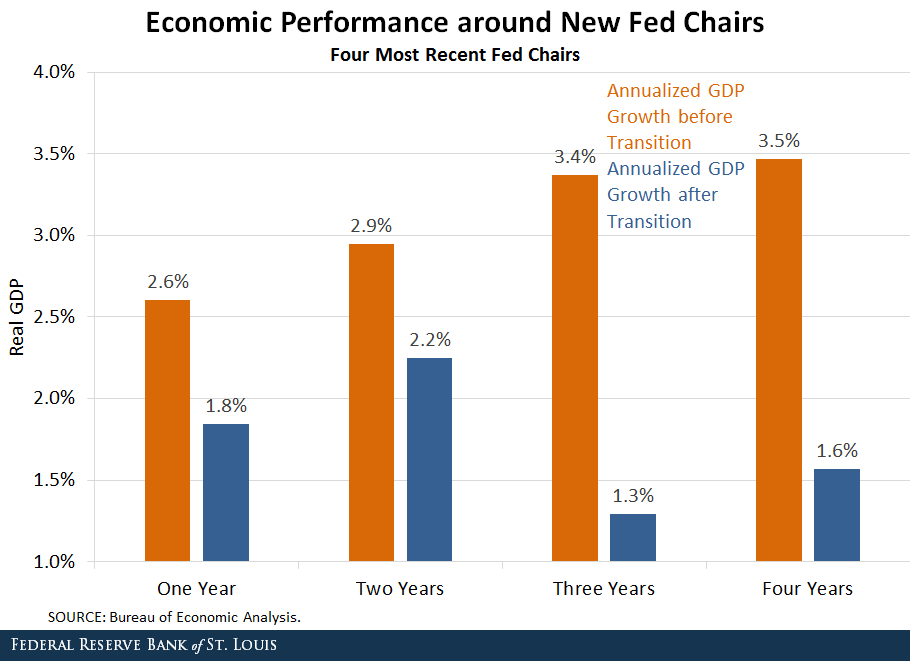
It turns out that the average growth slowdown around a Fed chair transition has been larger in recent decades (beginning in 1979) than it was before at each of the horizons considered here. The figure below shows the before-and-after growth averages for one-, two-, three- and four-year horizons for only the four most recent Fed chairs.1

GDP latest fed chairs

Remarkably, the average growth slowdown is nearly two full percentage points at both the three- and four-year horizons. As before, the large declines experienced after the Volcker and Bernanke transitions play the largest roles, but average growth also slowed in the three- and four-year periods after Greenspan took office.

Why Would a Transition Lead to Slower Growth?

The historical pattern shown here might be merely a coincidence. Another possibility is that it might reflect heightened uncertainty in financial markets and the economy as Fed leadership changes. It also might be the result of incoming Fed chairs pursuing monetary policy somewhat differently than their immediate predecessors.

Would a New Fed Chair Face a Growth Slowdown?

The number of Fed chair transitions since WWII is small, so it’s difficult to generalize about what might happen next. Nonetheless, the pattern of slower growth on average after a new Fed chair takes office is striking—especially at the three- and four-year horizons.

Notes and References

1 Janet Yellen has not been the Fed chair long enough for four full years of data, so her four-year data covers 3.5 years.

Can Gradual Interest-Rate Tightening Prevent a Bust?

From The Mises Institute.

The boom brought about by the banks’ policy of extending credit must necessarily end sooner or later. Unless they are willing to let their policy completely destroy the monetary and credit system, the banks themselves must cut it short before the catastrophe occurs. The longer the period of credit expansion and the longer the banks delay in changing their policy, the worse will be the consequences of the malinvestments and of the inordinate speculation characterizing the boom; and as a result the longer will be the period of depression and the more uncertain the date of recovery and return to normal economic activity

Fed policy makers are of the view that if there is the need to tighten the interest rate stance the tightening should be gradual as to not destabilize the economy.

The gradual approach gives individuals plenty of time to adjust to the tighter monetary stance. This adjustment in turn will neutralize the possible harmful effect that such a tighter stance may have on the economy.

But is it possible by means of a gradual monetary policy to undo the damage inflicted to the economy by previous loose monetary policies? According to mainstream economic thinking, it would appear that this is the case.

In his various writings, the champion of the monetarist school of thinking, Milton Friedman, has argued that there is a variable lag between changes in money supply and its effect on real output and prices. Friedman holds that in the short run changes in money supply will be followed by changes in real output. In the long run, according to Friedman, changes in money will only have an effect on prices.

It follows then that changes in money with respect to real economic activity tend to be neutral in the long run and non-neutral in the short run. Thus according to Friedman,

In the short-run, which may be as much as five or ten years, monetary changes affect primarily output. Over decades, on the other hand, the rate of monetary growth affects primarily prices.1

According to Friedman, the effect of the change in money supply shows up first in output and hardly at all in prices. It is only after a longer time lag that changes in money start to have an effect on prices. This is the reason, according to Friedman, why in the short run money can grow the economy, while in the long run it has no effect on the real output.

According to Friedman, the main reason for the non-neutrality of money in the short run is the variability in the time lag between money and the economy. Consequently, he believes that if the central bank were to follow a constant money rate of growth rule this would eliminate fluctuations caused by variable changes in the money supply rate of growth. The constant money growth rule could also make money neutral in the short run and the only effect that money would have is on general prices.

Thus according to Friedman,

On the average, there is a close relation between changes in the quantity of money and the subsequent course of national income. But economic policy must deal with the individual case, not the average. In any case, there is much slippage. It is precisely this leeway, this looseness in the relation, this lack of mechanical one-to-one correspondence between changes in money and in income that is the primary reason why I have long favoured for the USA a quasi-automatic monetary policy under which the quantity of money would grow at a steady rate of 4 or 5 per cent per year, month-in, month-out.2

In his Nobel lecture, Robert Lucas raised an issue with this. According to Lucas,

If everyone understands that prices will ultimately increase in proportion to the increase in money, what force stops this from happening right away?3

Consequently, Lucas has suggested that the reason why money does generate a real effect in the short run is not so much due to the variability of monetary time lags but more bound up with whether money changes were anticipated or not. If monetary growth anticipated, then people will adjust to it rather quickly and there will not be any real effect on the economy. Only unanticipated monetary expansion can stimulate production.

Moreover, according to Lucas,

Unanticipated monetary expansions, on the other hand, can stimulate production as, symmetrically, unanticipated contractions can induce depression.4

Both Friedman and Lucas are of the view, although for slightly different reasons, that it is desirable to make money neutral in order to avoid unstable and therefore unsustainable economic growth.

The current practice of Fed policy makers seems to incorporate the ideas of Friedman and Lucas into the so-called transparent monetary policy framework. This framework accepts Lucas’s view that anticipated monetary policy could lead to stable economic growth. This framework also accepts that a gradual change in monetary policy in the spirit of Friedman’s constant money growth rule could reinforce the transparency.

If unexpected monetary policies can cause real economic growth, what is wrong with this? Why not constantly surprise people and cause more real wealth?

Money, Expectations and Economic Growth

What is required for economic growth is a growing pool of real savings, which funds various individuals that are engaged in the build-up of capital goods. An increase in money, however, has nothing to do, as such, with this. On the contrary this increase only leads to consumption that is not supported by production of real wealth. Consequently, this leads to a weakening in the real pool of savings, which in turn undermines real economic growth. All that printing money can achieve is a redirection of real savings from wealth generating activities towards non-productive wealth consuming activities. So obviously, there cannot be any economic growth because of this redirection.

Now if unanticipated monetary growth undermines real economic growth via the dilution of the pool of real savings why is it then that one observes that rising money is associated with a rise in economic indicators like real GDP?

We suggest that all that we observe in reality is an increase in monetary spending — this is what GDP depicts. The more money that is printed, the higher GDP will be. So-called real GDP is merely nominal GDP deflated by a meaningless price index. Hence, so-called observed economic growth is just the reflection of monetary expansion and has nothing to do with real economic growth. Incidentally, real economic growth cannot be measured as such — it is not possible to establish a meaningful total by adding potatoes and tomatoes.

While unanticipated monetary growth cannot grow the economy, it definitely produces a real effect by undermining the pool of real savings and thereby weakening the real economy.

Likewise anticipated money growth cannot be harmless to the real economy. Even if the money rate of growth is fully anticipated there is always someone who gets it first. Consequently, also anticipated money growth rate will set in motion an exchange of nothing for something.

For instance, consider the individual who fully expects the future course of monetary policy. This individual now decides to borrow $1000 from a bank. The bank obliges and lends him the $1000, which the bank has created out of “thin air”. Now, since this money is unbacked by any previous production of real wealth it will set in motion an exchange of nothing for something, or a redirection of real savings from wealth generators towards the borrower of the newly created $1000. This redirection and hence real negative effect on the pool of savings cannot be prevented by an individuals’ correct expectation of monetary policies.

Even if the money is pumped in such a way that everybody gets it instantaneously, changes in the demand for money will vary. After all, every individual is different from other individuals. There will always be somebody who will spend the newly received money before somebody else. This of course will lead to the redirection of real wealth to the first spender from the last spender.

We can thus conclude that regardless of expectations, loose monetary policy will always undermine the foundations of the real economy while tight monetary policy will work to arrest this process. Hence monetary policy can never be neutral.

Can a Gradual Tightening Prevent an Economic Bust?

Since monetary growth, whether expected or unexpected, gives rise to the redirection of real savings it means that any monetary tightening slows down this redirection. Various economic activities, which sprang-up on the back of strong monetary pumping, because of a tighter monetary stance get now less real funding. This in turn means that these activities are given less support and run the risk of being liquidated. It is the liquidation of these activities what an economic bust is all about.

Obviously, then, the tighter monetary stance by the Fed must put pressure on various false activities, or various artificial forms of life. Hence, the tighter the Fed gets the slower the pace of redirection of real savings will be, which in turn means that more liquidation of various false activities will take place. In the words of Ludwig von Mises,

The boom brought about by the banks’ policy of extending credit must necessarily end sooner or later. Unless they are willing to let their policy completely destroy the monetary and credit system, the banks themselves must cut it short before the catastrophe occurs. The longer the period of credit expansion and the longer the banks delay in changing their policy, the worse will be the consequences of the malinvestments and of the inordinate speculation characterizing the boom; and as a result the longer will be the period of depression and the more uncertain the date of recovery and return to normal economic activity.5

Consequently, the view that the Fed can lift interest rates without any disruption doesn’t hold water. Obviously if the pool of real savings is still expanding then this may mitigate the severity of the bust. However, given the reckless monetary policies of the US central bank it is quite likely that the US economy may already has a stagnant or perhaps a declining pool of real savings. This in turn runs the risk of the US economy falling into a severe economic slump.

We can thus conclude that the popular view that gradual transparent monetary policies will allow the Fed to tighten its stance without any disruptions is based on erroneous ideas. There is no such thing as a “shock-free” monetary policy any more than a monetary expansion can ever be truly neutral to the market.

Regardless of policy transparency once a tighter monetary stance is introduced, it sets in motion an economic bust. The severity of the bust is conditioned by the length and magnitude of the previous loose monetary stance and the state of the pool of real savings.


1. Milton Friedman The Counter-Revolution in Monetary Theory. Occasional Paper 33, Institute of Economic Affairs for the Wincott Foundation. London: Tonbridge, 1970.

2. Milton Friedman The Counter-Revolution in Monetary Theory

3. Robert E. Lucas, Jr Nobel Lecture:Monetary Neutrality, Journal of Political Economy, 1996, vol. 104,no. 4

4. Ibid.

5. Ludwig von Mises, The “Austrian” Theory of the Trade Cycle. The Ludwig von Mises Institute 1983.


The US economy is outpacing Australia’s

From The Conversation.

Data this week pointed to a continued shakiness in the Australian economy, while the robust US recovery continued.

In Australia, private-sector lending grew at just 0.3%, compared to 0.5% in August. Perhaps more worryingly, business lending dropped 0.1%. It was, again, housing credit growth that propped up the overall figures, growing 0.5% for the month.

Worse still, new home sales fell 6.1% in September, compared to August, according to the Housing Industry Association. So Australians aren’t borrowing much, except to finance the swapping around of each other’s houses at higher and higher prices. Note to picky readers: yes, prices fell a tiny bit in Sydney last month (0.1%), but are still up 10.5% year-on-year.

The US labour market bounced back from the hurricane season, adding 235,000 private sector jobs, according to data from payroll provider ADP. This wasn’t merely a bounce back — it exceeded expectations of a 200,000 gain. This was the biggest gain since March and further evidence of the strong US recovery.

It was not surprising, then, that Conference Board figures showed strong consumer confidence. What was striking, however, was just how strong those figures were. The confidence index rose to 5.3 points to 125.9 – the highest since December 2000. The present conditions measure was also at its highest level since 2001.

The US Federal Reserve kept interest rates on hold at a band of 1.0-1.25% at this week’s meeting, but signalled a fairly high likelihood of a rate rise when they meet in December. As the statement put it:

The Committee expects that economic conditions will evolve in a manner that will warrant gradual increases in the federal funds rate.

Perhaps the only real wrinkle is that inflation remains stubbornly low, despite unemployment being at 4.2%. Some measures of inflation expectations are rising, so the best bet is for a 25 basis point rise in December.

The Fed’s statement made pretty explicit how they think about balance these factors, stating:

the Committee continues to expect that, with gradual adjustments in the stance of monetary policy, economic activity will expand at a moderate pace, and labor market conditions will strengthen somewhat further. Inflation on a 12-month basis is expected to remain somewhat below 2 percent in the near term but to stabilize around the Committee’s 2 percent objective over the medium term.

Of course, current Fed Chair Janet Yellen’s term concludes in February next year, and it is being widely reported that President Trump will not reappoint her. Rather he seems set (to the extent that is possible with him) to appoint Jay Powell as Chair.

I will have more to say about that in future columns, but the main thing to note here is that Powell is extremely likely to continue with the path of monetary policy that Yellen has laid out.

So why is it that the US – which suffered a major downturn – seems to have a stronger economy than Australia – which did not even go into recession in 2008-09?

One view is that the US went through a process of Schumpetarian “creative desctruction”. Homeowners who couldn’t afford their properties got foreclosed on, investment banks that weren’t viable went bust, and the rest of the financial system was recapitalised.

Australian banks, by contrast have made some progress in getting their funding structure to be less short-term and dependent on US capital markets – but only so much. And it seems quite possible that they continue to make questionable loans – particularly interest-only loans – as I wrote about here, and spoke about here.

A second view is that the US economy is better able to adapt to the changing nature of the modern economy. It has much more flexible labour markets – although much harsher and less rewarding for average workers.

Perhaps it is neither of these, but presumably both the Reserve Bank and Treasury are trying to understand what looks like a striking different between the US and Australian experiences.

Author: Richard Holden, Professor of Economics and PLuS Alliance Fellow, UNSW