US Banks Now Significantly More Capitalised

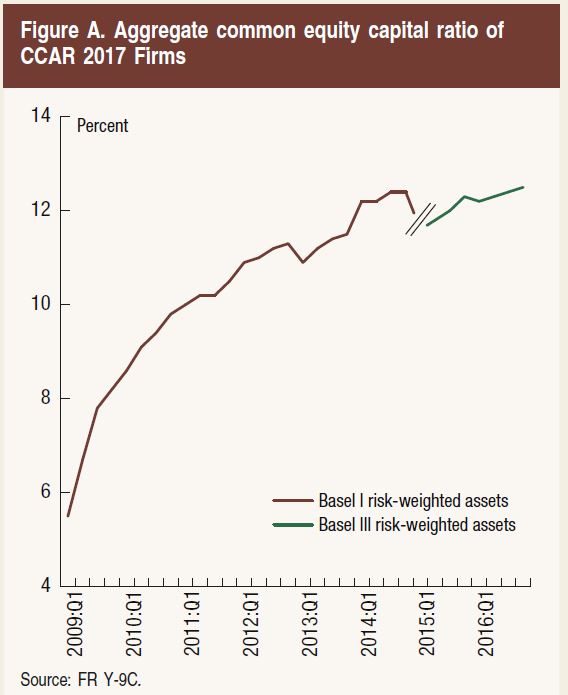
The US Federal Reserve Board has announced it has completed its review of the capital planning practices of the nation’s largest banks and reports that their ratios have more than doubled from 5.5 percent in the first quarter of 2009 to 12.5 per-cent in the fourth quarter of 2016.

Each US bank is listed, so we can make comparisons, unlike the “behind closed door” arrangements in Australia, where regulatory disclosure is so poor.

CCAR, in its seventh year, evaluates the capital planning processes and capital adequacy of the largest U.S.-based bank holding companies, including the firms’ planned capital actions such as dividend payments and share buybacks. Strong capital levels act as a cushion to absorb losses and help ensure that banking organizations have the ability to lend to households and businesses even in times of stress.

“I’m pleased that the CCAR process has motivated all of the largest banks to achieve healthy capital levels and most to substantially improve their capital planning processes,” said Governor Jerome H. Powell.

Figure A provides the aggregate ratio of common equity capital to risk-weighted assets for the firms in CCAR from 2009 through the fourth quarter of 2016. This ratio has more than doubled from 5.5 percent in the first quarter of 2009 to 12.5 per-cent in the fourth quarter of 2016. That gain reflects a total increase of more than $750 billion in common equity capital from the beginning of 2009 among these firms, bringing their total common equity capital to over $1.2 trillion in the fourth quarter of 2016.

The decline in the common equity ratio in the first quarter of 2015 resulted from the incorporation of risk-weighted assets calculated under the standardized approach under the capital rules that the Board adopted in 2013, which had a one-time effect of reducing all risk-based capital ratios. However, the aggregate common equity capital ratio of the 34 firms increased by around 65 basis points between the first quarter of 2015 and the fourth quarter of 2015. Previously, risk-weighted assets were calculated under a prior version of the capital rules.

In the aggregate, the 34 firms participating in CCAR 2017 have estimated that their common equity will remain near current levels between the third quarter of 2017 and the second quarter of 2018, based on their planned capital actions and net income projections under their baseline scenario.

When considering a firm’s capital plan, the Federal Reserve considers both quantitative and qualitative factors. Quantitative factors include a firm’s projected capital ratios under a hypothetical scenario of severe economic and financial market stress. Qualitative factors include the strength of the firm’s capital planning process, which incorporate risk management, internal controls, and governance practices that support the process.

This year, 13 of the largest and most complex banks were subject to both the quantitative and qualitative assessments. The 21 other firms in CCAR were subject only to the quantitative assessment. The Federal Reserve may object to a capital plan based on quantitative or qualitative concerns, and if it does, a firm may not make any capital distribution unless authorized by the Federal Reserve.

The Federal Reserve did not object to the capital plans of Ally Financial, Inc.; American Express Company; BancWest Corporation; Bank of America Corporation; The Bank of New York Mellon Corporation; BB&T Corporation; BBVA Compass Bancshares, Inc.; BMO Financial Corp.; CIT Group Inc.; Citigroup, Inc.; Citizens Financial Group; Comerica Incorporated; Deutsche Bank Trust Corporation; Discover Financial Services; Fifth Third Bancorp; Goldman Sachs Group, Inc.; HSBC North America Holdings, Inc.; Huntington Bancshares, Inc.; JP Morgan Chase & Co.; Keycorp; M&T Bank Corporation; Morgan Stanley; MUFG Americas Holdings Corporation; Northern Trust Corp.; The PNC Financial Services Group, Inc.; Regions Financial Corporation; Santander Holdings USA, Inc.; State Street Corporation; SunTrust Banks, Inc.; TD Group US Holdings LLC; U.S. Bancorp; Wells Fargo & Company; and Zions Bancorporation.

The Federal Reserve did not object to the capital plan of Capital One Financial Corporation, but is requiring the firm to submit a new capital plan within six months that addresses identified weaknesses in its capital planning process.


US Banks Pass Federal Reserve’s Stress Test

From Moody’s

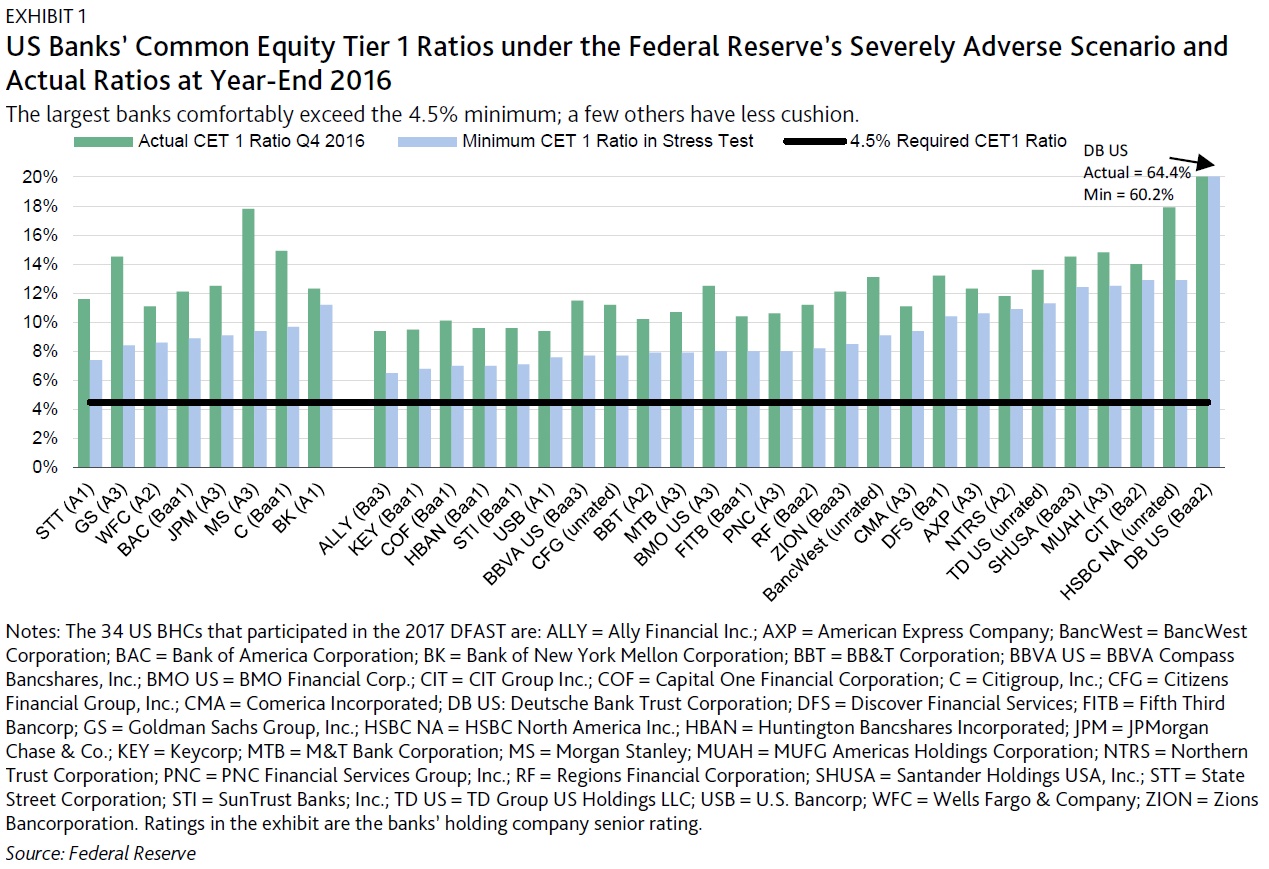
Last Thursday, the US Federal Reserve published the results of the 2017 Dodd-Frank Act stress test (DFAST) for 34 of the largest US bank holding companies (BHCs), all of which exceeded the 4.5% minimum required common equity Tier 1 (CET1) capital ratio under the Fed’s severely adverse stress scenario, a credit positive.

This is the third consecutive year that all tested BHCs exceeded the Fed’s minimum requirement, and the median margin above the minimum also increased. However, for the first time, this year’s test incorporated the supplementary leverage ratio (SLR) for advanced-approach banks, which was more constraining for some of the banks.

DFAST considers how well banks withstand a severely adverse economic scenario, which is characterized as a severe global recession. The 2017 test scenario used modestly more favorable interest rates than in 2016 with a greater increase in rates and no negative short-term rates. The test incorporated a 6.5% peak-to-trough decline in US real gross domestic product, an increase in the unemployment rate to 10%, a 50% decline in equity prices through year-end 2017, and a 25% drop in home prices and a 35% decline in commercial real estate prices by 2019.

All 34 BHCs were subjected to this scenario, including new participant CIT Group Inc. In addition, the stress tests for eight of the 34 BHCs with substantial trading or processing operations were required to incorporate the sudden default of their largest loss-generating counterparty. The eight BHCs subject to the counterparty default component were Bank of America Corporation, The Bank of New York Mellon Corporation, Citigroup Inc., The Goldman Sachs Group, JPMorgan Chase & Co. Morgan Stanley, State Street Corporation, and Wells Fargo & Company. Finally, six of these eight BHCs with significant trading operations were also required to include a global market shock (Bank of New York Mellon Corporation and State Street Corporation were excluded from this global market shock scenario.)

On 28 June, the Fed will release the results of the Comprehensive Capital Analysis and Review (CCAR), which evaluates the BHCs’ capital plans, including dividends and stock repurchases, incorporating their DFAST results. The capital-planning processes of the large complex banks will also be publicly evaluated. Prior to the CCAR release, BHCs can reduce their planned capital distributions, commonly known as taking a “mulligan.” Our analysis of pre-provision net revenue declines and loan losses under the severely adverse scenario highlights still significant tail risks for DFAST participants. Nonetheless, we expect banks’ capital distribution requests to be more aggressive than in prior years, which will limit or negate improvement in their capital ratios.

ALL BANKS EXCEED MINIMUM REQUIRED CAPITAL IN THE SEVERELY ADVERSE SCENARIO

Exhibit 1 compares the minimum CET1 ratios of 34 participating BHCs under the Fed’s severely adverse scenario with their actual CET1 ratios reported at year-end 2016. The exhibit segments the BHCs into two groups: the 26 BHCs subject only to the severely adverse economic scenario (on the right), and the eight BHCs also subject to the additional global market shock and counterparty default components noted above (on the left). The minimum CET1 ratios of the eight large BHCs are all comfortably above the Fed’s 4.5% requirement despite being subjected to the additional stress components. The other 26 BHCs are also above the 4.5% requirement, although for many the margin is smaller than for the largest BHCs. The lowest minimum ratios were for Ally Financial Inc. at 6.6%, up from 6.1% in the 2016 test; and KeyCorp at 6.8%, up from 6.4% in 2016.

Even though all of the BHCs passed the 4.5% minimum threshold, many would still take sizeable capital hits under the Fed’s severely adverse scenario (Exhibit 2). The estimated declines in the BHCs’ CET1 ratios range from a high of 840 basis points (bp) for Morgan Stanley to a low of 210 bp for Santander Holdings USA, Inc.. Positively, the median of the 34 banks was narrower at 280 bp compared with 350 bp last year, indicating greater overall resilience to an economic shock. In its report, the Fed partly attributed this to lower losses from changes in the banks’ portfolio composition and risk characteristics.

SUPPLEMENTARY LEVERAGE RATIO IS A GREATER CONSTRAINT FOR SOME BANKS

The BHCs’ generally good results for stressed CET1 ratios in DFAST suggests that increased capital distributions are likely for the vast majority of institutions. However, CET1 is not the most constraining ratio for all banks. In particular, this year’s test for the first time incorporated the supplementary leverage ratio (SLR) for the advanced approach banks (Exhibit 3). Because the denominator of the SLR comprises average assets and off-balance sheet exposures, it tends to be much larger than the risk-weighted asset denominator of CET1, with the result that the banks’ margin above the 3% minimum SLR is smaller. Morgan Stanley had the lowest minimum SLR of 3.8%, which is likely to constrain its efforts to return more capital to shareholders. State Street and Goldman Sachs also had comparatively low minimum SLRs.

Housing and Financial Stability

An excellent speech by Fed Vice Chairman Stanley Fischer at the DNB-Riksbank Macroprudential Conference Series, Amsterdam, Netherlands

It is often said that real estate is at the center of almost every financial crisis. That is not quite accurate, for financial crises can, and do, occur without a real estate crisis. But it is true that there is a strong link between financial crises and difficulties in the real estate sector. In their research about financial crises, Carmen Reinhart and Ken Rogoff document that the six major historical episodes of banking crises in advanced economies since the 1970s were all associated with a housing bust. Plus, the drop in house prices in a bust is often bigger following credit-fueled housing booms, and recessions associated with housing busts are two to three times more severe than other recessions. And, perhaps most significantly, real estate was at the center of the most recent crisis.

In addition to its role in financial stability, or instability, housing is also a sector that draws on and faces heavy government intervention, even in economies that generally rely on market mechanisms. Coming out of the financial crisis, many jurisdictions are undergoing housing finance reforms, and enacting policies to prevent the next crisis. Today I would like to focus on where we now stand on the role of housing and real estate in financial crises, and what we should be doing about that situation. We shall discuss primarily the situation in the United States, and to a much lesser extent, that in other countries.

Housing and Government
Why are governments involved in housing markets? Housing is a basic human need, and politically important‑‑and rightly so. Using a once-popular term, housing is a merit good‑‑it can be produced by the private sector, but its benefit to society is deemed by many great enough that governments strive to make it widely available. As such, over the course of time, governments have supported homebuilding and in most countries have also encouraged homeownership.

Governments are involved in housing in a myriad of ways. One way is through incentives for homeownership. In many countries, including the United States, taxpayers can deduct interest paid on home mortgages, and various initiatives by state and local authorities support lower-income homebuyers. France and Germany created government-subsidized home-purchase savings accounts. And Canada allows early withdrawal from government-provided retirement pension funds for home purchases.

And‑‑as we all know‑‑governments are also involved in housing finance. They guarantee credit to consumers through housing agencies such as the U.S. Federal Housing Administration or the Canada Mortgage and Housing Corporation. The Canadian government also guarantees mortgages on banks’ books. And at various points in time, jurisdictions have explicitly or implicitly backstopped various intermediaries critical to the mortgage market.

Government intervention in the United States has also addressed the problem of the fundamental illiquidity of mortgages. Going back 100 years, before the Great Depression, the U.S. mortgage system relied on small institutions with local deposit bases and lending markets. In the face of widespread runs at the start of the Great Depression, banks holding large portfolios of illiquid home loans had to close, exacerbating the contraction. In response, the Congress established housing agencies as part of the New Deal to facilitate housing market liquidity by providing a way for banks to mutually insure and sell mortgages.

In time, the housing agencies, augmented by post-World War II efforts to increase homeownership, grew and became the familiar government-sponsored enterprises, or GSEs: Fannie, Freddie, and the Federal Home Loan Banks (FHLBs). The GSEs bought mortgages from both bank and nonbank mortgage originators, and in turn, the GSEs bundled these loans and securitized them; these mortgage-backed securities were then sold to investors. The resulting deep securitized market supported mortgage liquidity and led to broader homeownership.

Costs of Mortgage Credit
While the benefits to society from homeownership could suggest a case for government involvement in securitization and other measures to expand mortgage credit availability, these benefits are not without costs. A rapid increase in mortgage credit, especially when it is accompanied by a rise in house prices, can threaten the resilience of the financial system.

One particularly problematic policy is government guarantees of mortgage-related assets. Pre-crisis, U.S. agency mortgage-backed securities (MBS) were viewed by investors as having an implicit government guarantee, despite the GSEs’ representations to the contrary. Because of the perceived guarantee, investors did not fully internalize the consequence of defaults, and so risk was mispriced in the agency MBS market. This mispricing can be notable, and is attributable not only to the improved liquidity, but also to implicit government guarantees. Taken together, the government guarantee and resulting lower mortgage rates likely boosted both mortgage credit extended and the rise in house prices in the run-up to the crisis.

Another factor boosting credit availability and house price appreciation before the crisis was extensive securitization. In the United States, securitization through both public and private entities weakened the housing finance system by contributing to lax lending standards, rendering the mid-2000 house price bust more severe. Although the causes are somewhat obscure, it does seem that securitization weakened the link between the mortgage loan and the lender, resulting in risks that were not sufficiently calculated or internalized by institutions along the intermediation chain. For example, even without government involvement, in Spain, securitization grew rapidly in the early 2000s and accounted for about 45 percent of mortgage loans in 2007. Observers suggest that Spain’s broad securitization practices led to lax lending standards and financial instability.

Yet, as the Irish experience suggests, housing finance systems are vulnerable even if they do not rely on securitization. Although securitization in Ireland amounted to only about 10 percent of outstanding mortgages in 2007, lax lending standards and light regulatory oversight contributed to the housing boom and bust in Ireland.

Macroprudential Policies
To summarize, murky government guarantees, lax lending terms, and securitization were some of the key factors that made the housing crisis so severe. Since then, to damp the house price-credit cycle that can lead to a housing crisis, countries worldwide have worked to create or expand existing macroprudential policies that would, in principle, limit credit growth and the rate of house price appreciation.

Most macroprudential policies focus on borrowers. Loan-to-value (LTV) and debt-to-income (DTI) ratio limits aim to prevent borrowers from taking on excessive debt. The limits can also be adjusted in response to conditions in housing markets; for example, the Financial Policy Committee of the Bank of England has the authority to tighten LTV or DTI limits when threats to financial stability emerge from the U.K. housing market. Stricter LTV or DTI limits find some measure of success. One study conducted across 119 countries from 2000 to 2013 suggests that lower LTV limits lead to slower credit growth. In addition, evidence from a range of studies suggests that decreases in the LTV ratio lead to a slowing of the rate of house price appreciation. However, some other research suggests that the effectiveness of LTV limits is not significant or somewhat temporary.

Other macroprudential policies focus on lenders. First and foremost, tightening bank capital regulation enhances loss-absorbing capacity, strengthening financial system resilience. In addition, bank capital requirements for mortgages that increase when house prices rise may be used to lean against mortgage credit growth and house price appreciation. These policies are intended to make bank mortgage lending more expensive, leading borrowers to reduce their demand for credit, which tends to push house prices down. Estimates of the effects of such changes vary widely: After consideration of a range of estimates from the literature, an increase of 50 percentage points in the risk weights on mortgages would result in a house price decrease from as low as 0.6 percent to as high as 4.0 percent. These policies are more effective if borrowers are fairly sensitive to a rise in interest rates and if migration of intermediation outside the banking sector to nonbanks is limited.

Of course, regulatory reforms and in some countries, macroprudential policies‑‑are still being implemented, and analysis is currently under way to monitor the effects. So far, research suggests that macroprudential tightening is associated with slower bank credit growth, slower housing credit growth, and less house price appreciation. Borrower, lender, and securitization-focused macroprudential policies are likely all useful in strengthening financial stability.

Loan Modification in a Crisis
Even though macroprudential policies reduce the incidence and severity of housing related crises, they may still occur. When house prices drop, households with mortgages may find themselves underwater, with the amount of their loan in excess of their home’s current price. As Atif Mian and Amir Sufi have pointed out, this deterioration in household balance sheets can lead to a substantial drop in consumption and employment. Extensive mortgage foreclosures–that is, undertaking the legal process to evict borrowers and repossess the house and then selling the house–as a response to household distress can exacerbate the downturn by imposing substantial dead-weight costs and, as properties are sold, causing house prices to fall further.

Modifying loans rather than foreclosing on them, including measures such as reducing the principal balance of a loan or changing the loan terms, can allow borrowers to stay in their homes. In addition, it can substantially reduce the dead-weight costs of foreclosure.

Yet in some countries, institutional or legal frictions impeded desired mortgage modifications during the recent crisis. And in many cases, governments stepped in to solve the problem. For example, U.S. mortgage loans that had been securitized into private-label MBS relied on the servicers of the loans to perform the modification. However, operational and legal procedures for servicers to do so were limited, and, as a result, foreclosure, rather than modification, was commonly used in the early stages of the crisis. In 2008, new U.S. government policies were introduced to address the lack of modifications. These policies helped in three ways. First, they standardized protocols for modification, which provided servicers of private-label securities some sense of common practice. Second, they provided financial incentives to servicers for modifying loans. Third, they established key criteria for judging whether modifications were sustainable or not, particularly limits on mortgage payments as a percentage of household income. This last policy was to ensure that borrowers could actually repay the modified loans, which prompted lenders to agree more readily to the modification policies in the first place.

Ireland and Spain also aimed to restructure nonperforming loans. Again, government involvement was necessary to push these initiatives forward. In Ireland, mortgage arrears continued to accumulate until the introduction of the Mortgage Arrears Resolution Targets scheme in 2013, and in Spain, about 10 percent of mortgages were restructured by 2014, following government initiatives to protect vulnerable households. Public initiatives promoting socially desirable mortgage modifications in times of crises tend to be accompanied by explicit public fund support even though government guarantees may be absent in normal times.

What Has Been Done? What Needs to Be Done?
With the recent crisis fresh in mind, a number of countries have taken steps to strengthen the resilience of their housing finance systems. Many of the most egregious practices that emerged during the lending boom in the United States‑‑such as no- or low-documentation loans or negatively amortizing mortgages‑‑have been severely limited. Other jurisdictions are taking actions as well. Canadian authorities withdrew government insurance backing on non-amortizing lines of credit secured by homes. The United States and the European Union required issuers of securities to retain some of the credit risk in them to better align incentives among participants (although in the United States, MBS issued by Fannie and Freddie are currently exempt from this requirement). And post-crisis, many countries are more actively pursuing macroprudential policies, particularly those targeted at the housing sector. New Zealand, Norway, and Denmark instituted tighter LTV limits or guidelines for areas that had overheating housing markets. Globally, the introduction of new capital and liquidity regulations has increased the resilience of the banking system.

But memories fade. Fannie, Freddie, and the Federal Housing Administration are now the dominant providers of mortgage funding, and the FHLBs have expanded their balance sheets notably. House prices are now high and rising in several countries, perhaps as a result of extended periods of low interest rates.

What should be done as we move ahead?

First, macroprudential policies can help reduce the incidence and severity of housing crises. While some policies focus on the cost of mortgage credit, others attempt directly to restrict households’ ability to borrow. Each policy has its own merits and working out their respective advantages is important.

Second, government involvement can promote the social benefits of homeownership, but those benefits come at a cost, both directly, for example through the beneficial tax treatment of homeownership, and indirectly through government assumption of risk. To that extent, government support, where present, should be explicit rather than implicit, and the costs should be balanced against the benefits, including greater liquidity in housing finance engendered through a uniform, guaranteed instrument.

Third, a capital regime that takes the possibility of severe stress seriously is important to calm markets and restart the normal process of intermediation should a crisis materialize. A well-capitalized banking system is a necessary condition for stability in bank-based financial systems as well as those with large nonbank sectors. This necessity points to the importance of having resilient banking systems and also stress testing the system against scenarios with sharp declines in house prices.

Fourth, rules and expectations for mortgage modifications and foreclosure should be clear and workable. Past experience suggests that both lenders and borrowers benefit substantially from avoiding costly foreclosures. Housing-sector reforms should consider polices that promote efficient modifications in systemic crises.

In the United States, as around the world, much has been done. The core of the financial system is much stronger, the worst lending practices have been curtailed, much progress has been made in processes to reduce unnecessary foreclosures, and the actions associated with the Housing and Economic Recovery Act of 2008 created some improvement over the previous ambiguity surrounding the status of government support for Fannie and Freddie.

But there is more to be done, and much improvement to be preserved and built on, for the world as we know it cannot afford another pair of crises of the magnitude of the Great Recession and the Global Financial Crisis.


Fed Heading for Faster-than-Expected Normalisation

The Federal Reserve hiked its benchmark rate hike this week. Judging by their associated comments, Fitch Ratings says this reinforces the view that U.S. interest rates will normalise faster than financial markets expect.

The Fed on Wednesday raised the fed funds target rate for the third time in seven months, to 1.00%-1.25%. The Fed also announced that it expects to start phasing out full balance sheet reinvestment in 2017 and provided details on the modalities of doing so.

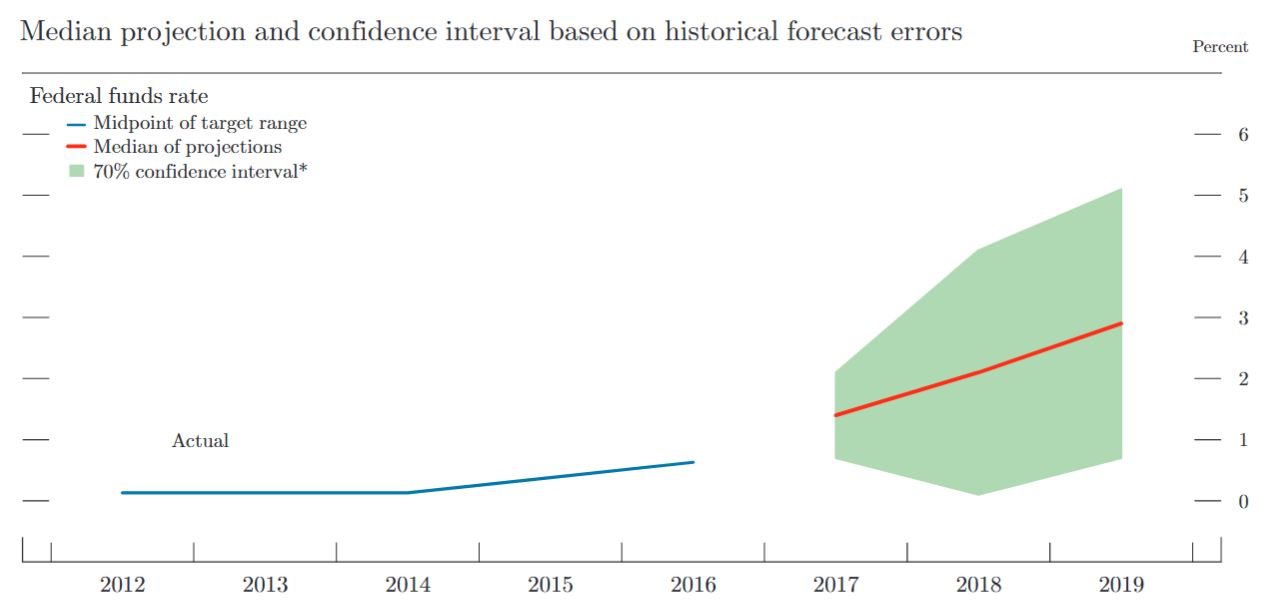
The rate increase and accompanying comments bolster our view that the fed funds rate is likely to normalise at 3.5% by 2020, and U.S. 10-year bond yields will rise back above 4%. These developments would mark a significant shift in the global interest rate environment.

Fitch believes the Fed is increasingly comfortable with its normalisation process and less data-dependent following recent inflation readings that have been slightly lower than consensus expectations (although they remain close to target). The interest rate hike showed the Fed was prepared to look through weak first quarter consumption and GDP and underlines Fed concerns about unemployment falling too far below its equilibrium rate. .

Our fed funds rate forecasts also reflect scepticism regarding the idea that the equilibrium (or “natural”) U.S. real interest rate has fallen close to zero. We think the fall in actual real rates is explained by the slowdown in potential GDP growth driven by demographics and weaker productivity growth, and by an elongated credit and monetary policy cycle. As this extended credit cycle comes to an end, Fitch believes the Fed will set rates according to its view of the U.S.’s long-term potential growth rate and its inflation target. This suggests the equilibrium nominal fed funds rate would be 3.5%-4% if real rates normalise in line with our estimate of U.S. potential growth at slightly below 2%.

The impact on bond yields will also be determined by how far the term premium rises from the current historically low level partly caused by the Fed’s Quantitative Easing (QE) programme. The Fed’s approach to balance sheet normalisation sees reinvestment only to the extent that maturities exceed pre-set caps. The caps will initially be set at low levels but will rise to maximum levels of USD30bn per month for Treasuries and USD20bn per month for agency debt and mortgage-backed securities. A return to a positive term premium of 50bp-100bp as the QE programme is unwound would see long-term U.S. bond yields normalise at 4%-5% given our estimates of the equilibrium Fed Funds rate.

Fed Hikes Benchmark Rate

The decision to raise the target range for the federal funds rate to 1 to 1-1/4 percent will put further upward pressure on interest rates in the capital markets. Further gradual increases should be expected, but there was no concrete news on the Fed’s strategy for reducing its bloated balance sheet, other than signalling an intention to throttle this back later in the year.

Information received since the Federal Open Market Committee met in May indicates that the labor market has continued to strengthen and that economic activity has been rising moderately so far this year. Job gains have moderated but have been solid, on average, since the beginning of the year, and the unemployment rate has declined. Household spending has picked up in recent months, and business fixed investment has continued to expand. On a 12-month basis, inflation has declined recently and, like the measure excluding food and energy prices, is running somewhat below 2 percent. Market-based measures of inflation compensation remain low; survey-based measures of longer-term inflation expectations are little changed, on balance.

Consistent with its statutory mandate, the Committee seeks to foster maximum employment and price stability. The Committee continues to expect that, with gradual adjustments in the stance of monetary policy, economic activity will expand at a moderate pace, and labor market conditions will strengthen somewhat further. Inflation on a 12-month basis is expected to remain somewhat below 2 percent in the near term but to stabilize around the Committee’s 2 percent objective over the medium term. Near term risks to the economic outlook appear roughly balanced, but the Committee is monitoring inflation developments closely.

In view of realized and expected labor market conditions and inflation, the Committee decided to raise the target range for the federal funds rate to 1 to 1-1/4 percent. The stance of monetary policy remains accommodative, thereby supporting some further strengthening in labor market conditions and a sustained return to 2 percent inflation.

In determining the timing and size of future adjustments to the target range for the federal funds rate, the Committee will assess realized and expected economic conditions relative to its objectives of maximum employment and 2 percent inflation. This assessment will take into account a wide range of information, including measures of labor market conditions, indicators of inflation pressures and inflation expectations, and readings on financial and international developments. The Committee will carefully monitor actual and expected inflation developments relative to its symmetric inflation goal. The Committee expects that economic conditions will evolve in a manner that will warrant gradual increases in the federal funds rate; the federal funds rate is likely to remain, for some time, below levels that are expected to prevail in the longer run. However, the actual path of the federal funds rate will depend on the economic outlook as informed by incoming data.

The Committee is maintaining its existing policy of reinvesting principal payments from its holdings of agency debt and agency mortgage-backed securities in agency mortgage-backed securities and of rolling over maturing Treasury securities at auction. The Committee currently expects to begin implementing a balance sheet normalization program this year, provided that the economy evolves broadly as anticipated. This program, which would gradually reduce the Federal Reserve’s securities holdings by decreasing reinvestment of principal payments from those securities, is described in the accompanying addendum to the Committee’s Policy Normalization Principles and Plans.

The Financial Challenges of Small Businesses

From “On The Economy Blog”

More than 60 percent of small businesses faced financial challenges in the past year, according to the USA 2016 Small Business Credit Survey.

The survey, which was a collaboration of all 12 Federal Reserve banks, provides an in-depth look at small business performance and debt. This report focuses on employer firms, or those with at least one full- or part-time employee.1 When looking at the financial challenges of small businesses, the report covered the second half of 2015 through the second half of 2016.

Financial Challenges and How They Were Addressed

Among all firms, 61 percent reported facing financial challenges over this time period. Financial challenges included:

  • Credit availability or securing funds for expansion
  • Paying operating expenses
  • Making payments on debt
  • Purchasing inventory or supplies to fulfill contracts

Firms with smaller annual revenue were more likely to experience financial challenges. Of firms with $1 million or less, 67 percent reported facing financial challenges, compared to only 47 percent of firms with more than $1 million.

The figure below shows the breakdown of which financial challenges were most prevalent among small businesses.

financial challenges

The survey also asked small businesses how they addressed these issues. Their responses are captured in the figure below. (It should be noted that respondents could also answer “unsure” and “other,” and those responses are not captured below.)

small business actions

Notes and References

1 This does not include self-employed or firms where the owner is the only employee.

A Case for Shrinking the Fed’s Balance Sheet

Time for the FED to shrink it’s balance sheets which has grown from US$800 billion in 2006 to about US$4.5 trillion now, according to Federal Reserve Bank of St. Louis President James Bullard, in an article in the second quarter 2017 issue of The Regional Economist.

As a consequence of the financial crisis, Great Recession of 2007-09 and sluggish economy that persisted for several years beyond that, the Federal Open Market Committee (FOMC) took extraordinary actions to stimulate the economy and promote the recovery. By December 2008, for instance, the FOMC had reduced the federal funds rate target (i.e., the policy rate) to near zero—exhausting its conventional monetary policy tool. With the economy still weak and to guard against deflation, the FOMC turned to unconventional monetary policy, including three rounds of large-scale asset purchases from late 2008 to late 2014. The purchases were primarily of longer-term Treasuries and mortgage-backed securities. This policy, better known as quantitative easing (QE), led to an expansion of the Fed’s balance sheet.

Fast forward to today. The Fed’s goals for employment and inflation have essentially now been met. The FOMC’s focus has shifted to monetary policy normalization, including increasing the policy rate, which it has done three times since December 2015. With this return to more conventional monetary policy now underway, the question of how and when to begin normalizing the Fed’s balance sheet is timely.

As a result of the three QE programs, the Fed’s balance sheet increased from about $800 billion in 2006 to about $4.5 trillion today. The FOMC’s reinvestment policy, which includes replacing maturing securities with new securities, is keeping the balance sheet at its current size. If the FOMC wanted to begin shrinking the balance sheet, the most natural step would be to end the reinvestment policy. Ending reinvestments would lead to a gradual reduction in the size of the balance sheet over several years.

In recent months, I have been an advocate of ending reinvestments for two main reasons. One is that current monetary policy is distorting the yield curve. While actual and projected increases in the policy rate are putting upward pressure on short-term interest rates, maintaining a large balance sheet is putting downward pressure on medium- and long-term interest rates. Of course, interest rates are volatile and are affected by many factors, but raising the policy rate would normally tend to raise interest rates all along the yield curve. Therefore, a more natural way to normalize interest rates would be to allow all of them to increase together.

My second argument for ending reinvestments is to allow for more balance-sheet “policy space” in the future. In other words, the FOMC should begin reducing the balance sheet now in case it needs to add to the balance sheet during a future recession. If, at that time, the policy rate is once again reduced to zero, the FOMC may want to consider using QE again. By having a smaller balance sheet in that situation, the FOMC would have more “policy space” to buy assets, if necessary.

Although I am in favor of ending reinvestments, some may argue that the “taper tantrum” of the summer of 2013 calls for caution in doing so. The FOMC’s QE3 program was ongoing at that time, and the taper tantrum was related to communications about the pace of asset purchases. In May of that year, then-Chairman Ben Bernanke commented to a congressional committee that he thought the pace of asset purchases might be slowed at future meetings. That message was reinforced by the results of the June meeting, when the FOMC authorized Bernanke to announce a road map for a possible decision to begin tapering later in the year. Financial markets viewed this announcement as relatively hawkish and reacted accordingly. (For example, longer-term U.S. interest rates increased.) At the September meeting, the FOMC postponed the decision, which financial markets viewed as relatively dovish. When the FOMC finally decided in December to begin tapering the pace of asset purchases, global financial markets did not react very much.

In my view, the taper tantrum was a communications issue—not an issue about actual changes in the size of the balance sheet. Similarly, communication will be important in the current situation. If the FOMC properly communicates the end of the reinvestment policy, I would expect the experience to be similar to December 2013, when there was no appreciable impact on global financial markets because they had already anticipated the changes in the Fed’s policy.

Some have suggested waiting to end the reinvestment policy until the FOMC has decided on the final size of the balance sheet. But few would argue that today’s $4.5 trillion is appropriate in the long run.2 Given that balance sheet normalization will take years, the FOMC could continue to debate the final size after reinvestment ends. In my view, it would be prudent to begin shrinking the balance sheet and making progress toward the eventual goal. The balance sheet policy was designed to cope with a near-zero policy rate, but now that the policy rate has increased, having such a large balance sheet is less critical.

Why Didn’t Bank Regulators Prevent the Financial Crisis?

The St. Louis Fed On The Economy Blog had an interesting article today, looking at why the GFC happened, and how the Dodd-Frank Act has addressed the issues in the US (yes, the one which may be repealed if Trump gets his way).

But, look at the issues in the Australian context and score for yourself to what extent we currently have the same issues here as they did in the US then. Its scary!

A number of observers have questioned whether bank regulators could have prevented the financial crisis of 2008. While many market participants recognized the exuberance of the housing market, other factors contributing to the crisis led to a “perfect storm” that made it difficult for many stakeholders, including regulators, to foresee the impending meltdown.

Excessive Mortgage Debt

Poor assessment of ability to repay and inadequate down payments doomed many mortgages. Insufficient consumer protections resulted in many consumers not understanding the risks of the mortgage products offered.

Dominance of Variable Rate and Hybrid Subprime Mortgages

The spread of variable rate and hybrid subprime mortgages in a low-rate environment created excessive risks when interest rates rose.

Overheated Housing Market

Rapidly increasing house prices encouraged speculation, which further drove up prices. The availability of easy credit caused many borrowers to take on levels of debt they could not afford.

Lack of Market Discipline in Mortgage-Backed Securities Market

Growth in the private mortgage-backed securities market was fueled by lax standards in assigning credit ratings, which hid building systemic risk.

Safety and Soundness Problems at Large Banks

Many large banking firms had insufficient levels of high-quality capital, excessive amounts of short-term wholesale funding and too few high-quality liquid assets. These problems were frequently compounded by inadequate internal risk measurement and management systems.

Risky Behavior by Nonregulated Financial Firms

Sometimes referred to as the “shadow banking system,” this collection of financial firms included insurance companies and captive finance companies, among others. These firms engaged in activities that increased risks inherent in the financial system as a whole without any meaningful regulatory oversight.

Lack of Broad Oversight

Finally, while various regulators oversaw parts of the financial system, there was no one regulator responsible for the consolidated supervision of systemically important financial firms. Moreover, no authority was assigned the responsibility of overseeing systemic risk.

Hard Data, Soft Data and Forecasting

From The St. Louis Fed on The Economy Blog.

People frequently scour economic data for clues about the direction of the economy. But could the many types of data cause confusion on what exactly the state of the economy is? A recent Economic Synopses essay examined some of this potential confusion.

Business Economist and Research Officer Kevin Kliesen noted that data essentially fall into two camps:

  • Hard data, such as that from government statistical agencies used in constructing real gross domestic product (GDP)
  • Soft data, such as business, consumer confidence and sentiment surveys, financial market variables, and labor statistics

Kliesen crafted two index measures of these types of data, which can be seen in the figure below.1 He noted that these indexes could be useful for quantitatively showing how different types of data can influence forecasts of real GDP and, in turn, the expectations of policymakers.

hard soft data

“The indexes exhibit the normal cyclical behavior one would expect in the data: They increase in expansions and decrease in recessions,” Kliesen wrote.

He also noted that the hard data index showed stronger economic conditions from around the beginning of the recent recovery until late 2013. More recently, however, the soft data index is showing stronger economic conditions.

Effect on Forecasts

To show the possible effects of favoring one type of data when forecasting, Kliesen ran forecasts of monthly real GDP growth using only hard data and using only soft data:

  • Forecasting growth using the hard data resulted in projected growth of a little more than 2 percent per quarter through the end of 2019.
  • Using soft data, however, resulted in a peak of a little more than 4 percent in early 2018.

He then compared the results with the consensus forecasts found in the Federal Reserve Bank of Philadelphia’s Survey of Professional Forecasters (SPF) and the Federal Open Market Committee’s (FOMC’s) Summary of Economic Projections (SEP). The results are in the table below.

Forecasts for Real GDP
Percent Changes, Q4/Q4
Hard Data Soft Data SPF SEP
2017:Q4 1.9 3.9 2.3 2.1
2018:Q4 2.2 2.9 2.4 2.1
2019:Q4 2.4 2.5 2.6 1.9
NOTES: The SEP values are taken from the March 15 release and are Q4/Q4. The SPF values use average annual data and are taken from the Feb. 10 issue.
Federal Reserve Bank of St. Louis

Kliesen concluded by saying that most forecasters and FOMC policymakers have relied more on hard data when forecasting. He wrote: “This is probably prudent, since the hard data flows are used in most macroeconomic forecasting models.”

He also noted: “However, as the upbeat forecasts from the soft data show, there appears to be some upside risk to the near-term forecast for real GDP growth. This upside risk likely reflects the widespread expectation of expansionary fiscal policy and a strengthening in global growth.”

The Growing Skill Divide in the U.S. Labor Market

The St. Louis Fed On The Economy Blog has highlighted a polarization in the labor market, between skilled employees capable of performing the challenging tasks in the cognitive nonroutine occupations and entry-level employees that are physically strong enough to perform the manual nonroutine tasks.

Over the past several decades, the skill composition of the U.S. labor market has shifted. Employers are hiring more workers to perform nonroutine types of tasks (such as managerial work, professional services and personal care) and fewer workers for routine operations (such as construction and manufacturing). This shift in the type of skills in demand is referred to as job polarization.

One way to see evidence of job polarization is to look at employment growth in certain occupational classifications. The figure below divides occupational employment growth into four groups:

  • Cognitive Nonroutine: managers, computer scientists, architects, artists, etc.
  • Manual Nonroutine: food preparation, personal care, retail, etc.
  • Cognitive Routine: office and administrative, sales, etc.
  • Manual Routine: construction, manufacturing, production, etc.

average annual employment growth

The black lines represent the average growth rate across all occupations within a group, while the bars represent the growth rate in that particular occupation.

The fastest growing occupational groups are cognitive nonroutine and manual nonroutine, both growing about 2 percent every year on average since the 1980s. Cognitive routine and manual routine occupations are growing significantly slower, less than 1 percent on average (or shrinking, in the case of production occupations).

Physical Demands of Work

One of the implications of job polarization is a shift in the type of work required to be performed by the average employee. A new survey from the Bureau of Labor Statistics—the Occupational Requirements Survey—gathers data on the type of work performed in each occupation.

The figure below looks at two physical task requirements:

  • The percentage of hours in an eight-hour day spent standing or walking
  • The percentage of workers required to perform pushing or pulling tasks with one or both hands

physical task requirements

The most physically demanding occupational groups are manual nonroutine and manual routine. In both of these groups, on average more than half of the employees are required to push or pull with their hands, and over half of their day is spend standing or walking.

In contrast, less than 35 percent of workers in the cognitive nonroutine and cognitive routine groups push or pull with their hands. These groups also spend much less time standing/walking.

Decision-Making at Work

The last figure looks at two cognitive task requirements:

  • The percentage of workers where decision-making in uncertain situations or conflict is required
  • The percentage of workers whose supervision is based on broad objectives and review of results

These requirements are easier to think about in terms of a spectrum. For example, occupations that require less cognitive activity either lack decision-making entirely or involve straightforward decisions from a predetermined set of choices.

Similarly, occupations with a greater cognitive requirement usually involve broad objectives with end-result review only, while more manual occupations require detailed instructions and frequent interactions with supervision (for example, a consultant’s quarterly performance review versus daily quality control checks in a factory).

cognitive task requirements

By a large margin, the cognitive nonroutine occupations involve more challenging decision-making and less frequent interactions with supervision. The other occupational groups all have fewer than 10 percent of employees engaging in these types of cognitive tasks.

Job Growth According to Skill Requirements

The figures above show a stark contrast between the skill requirements in the two occupational groups growing the fastest. The cognitive nonroutine group requires complex decision-making, independent working conditions and less physical effort, while the manual nonroutine group still requires quite a bit of physical effort and does not involve a high level of cognitive tasks.