Banks and Fintech – Where Do They Fit?

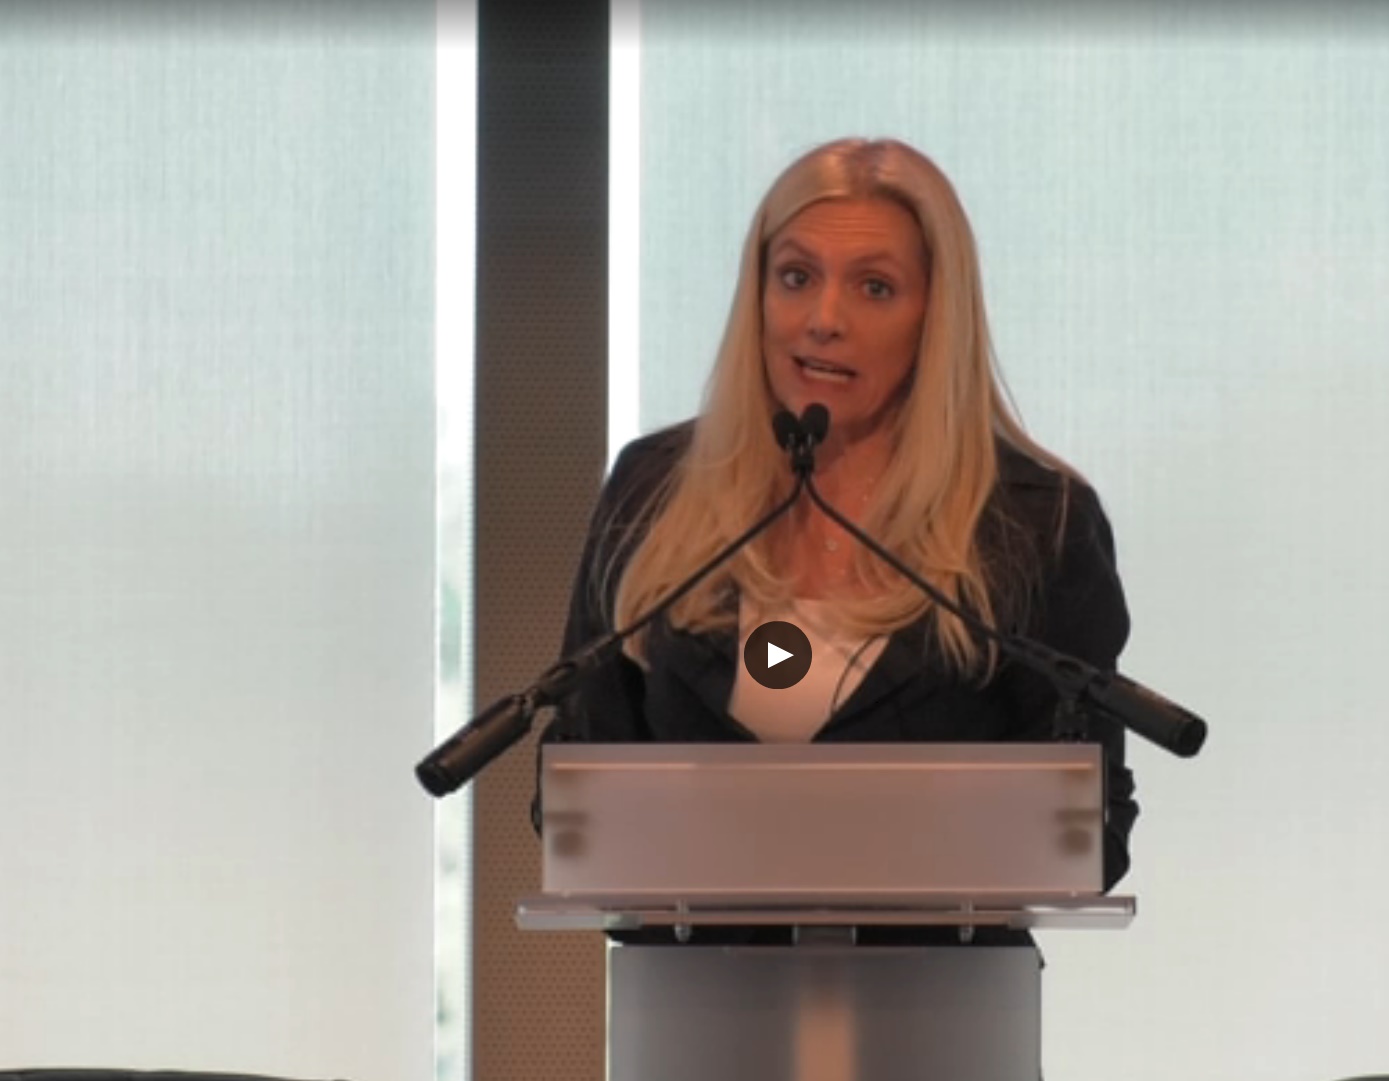
US Fed Governor Lael Brainard spoke on “Where Do Banks Fit in the Fintech Stack?” at the Northwestern Kellogg Public-Private Interface Conference on “New Developments in Consumer Finance: Research & Practice”

In particular she explored different approaches to how banks are exposing their data in a fintech context and the regulatory implications. Smaller banks may be at a disadvantage.

Different Approaches to the Fintech Stack

Because of the high stakes, fintech firms, banks, data aggregators, consumer groups, and regulators are all still figuring out how best to do the connecting. There are a few alternative approaches in operation today, with various advantages and drawbacks.

A number of large banks have developed or are in the process of developing interfaces to allow outside developers access to their platforms under controlled conditions. Similar to Apple opening the APIs of its phones and operating systems, these financial companies are working to provide APIs to outside developers, who can then build new products on the banks’ platforms. It is worth highlighting that platform APIs generally vary in their degree of openness, even in the smartphone world. If a developer wants to use a Google Maps API to embed a map in her application, she first must create a developer account with Google, agreeing to Google’s terms and conditions. This means she will have entered a contract with the owner of the API, and the terms and conditions may differ depending on how sensitive the particular API is. Google may require only a minimum amount of information for a developer that wants to use an API to display a map. Google may, however, require more information about a developer that wants to use a different API to monitor the history of a consumer’s physical locations over the previous week. And in some cases, the competitive interests of Google and a third-party app developer may diverge over time, such that the original terms of access are no longer acceptable.

The fact that it is possible and indeed relatively common for the API provider–the platform–to require specific controls and protections over the use of that API raises complicated issues when imported to the banking world. As banks have considered how to facilitate connectivity, the considerations include not only technical issues and the associated investment, but also the important legal questions associated with operating in a highly regulated sector. The banks’ terms of access may be determined in third-party service provider agreements that may offer different degrees of access. These may affect not only what types of protections and vetting are appropriate for different types of access over consumers’ funds and data held at a bank in order to enable the bank to fulfill its obligations for data security and other consumer protections, but also the competitive position of the bank relative to third-party developers.

There is a second broad type of approach in which many banks have entered into agreements with specialized companies that essentially act as middlemen, frequently described as “data aggregators.” These banks may lack the budgets and expertise to create their own open APIs or may not see that as a key element in their business strategies. Data aggregators collect consumer financial account data from banks, on the one hand, and then provide access to that data to fintech developers, on the other hand. Data aggregators organize the data they collect from banks and other data sources and then offer their own suite of open APIs to outside developers. By partnering with data aggregators, banks can open their systems to thousands of developers, without having to invest in creating and maintaining their own open APIs. This also allows fintech developers to build their products around the APIs of two or three data aggregators, rather than 15,000 different banks and other data sources. And, if agreements between data aggregators and banks are structured as data aggregators performing outsourced services to banks, the bank should be able to conduct the appropriate due diligence of its vendors, whose services to those banks may be subject to examination by safety and soundness regulators.

Some banks have opted for a more “closed” approach to fintech developers by entering into individual agreements with specific technology providers or data aggregators. These agreements often impose specific requirements rather than simply facilitating structured data feeds. These banks negotiate for greater control over their systems by limiting who is accessing their data–often to a specific third party’s suite of products. Likewise, many banks use these agreements to limit what types of data will be shared. For instance, banks may share information about the balances in consumers’ accounts but decline to share information about fees or other pricing. While recognizing the legitimate need for vetting of third parties for purposes of the banks fulfilling their responsibilities, including for data privacy and security, some consumer groups have suggested that the standards for vetting should be commonly agreed to and transparent to ensure that banks do not restrict access for competitive reasons and that consumers should be able to decide what data to make available to third-party fintech applications.

A third set of banks may be unable or unwilling to provide permissioned access, for reasons ranging from fears about increased competition to concerns about the cost and complexity of ensuring compliance with underlying laws and regulations. At the very least, banks may have reasonable concerns about being able to see, if not control, which third-party developers will have access to the banking data that is provided by the data aggregators. Accordingly, even banks that have previously provided structured data feeds to data aggregators may decide to limit or block access. In such cases, however, data aggregators can still move forward to collect consumer data for use by fintech developers without the permission or even potentially without the knowledge of the bank. Instead, data aggregators and fintech developers directly ask consumers to give them their online banking logins and passwords. Then, in a process commonly called “screen scraping,” data aggregators log onto banks’ online consumer websites, as if they were the actual consumers, and extract information. Some banks report that as much as 20 to 40 percent of online banking logins is attributable to data aggregators. They even assert that they have trouble distinguishing whether a computer system that is logging in multiple times a day is a consumer, a data aggregator, or a cyber attack.

For community banks with limited resources, the necessary investments in API technology and in negotiating and overseeing data-sharing agreements with data aggregators and third-party providers may be beyond their reach, especially as they usually rely on service providers for their core technology. Some fintech firms argue that screen scraping–which has drawn the most complaints about data security–may be the most effective tool for the customers of small community banks to access the financial apps they prefer–and thereby necessary to remain competitive until more effective broader industry solutions are developed.

Clearly, getting these connectivity questions right, including the need to manage the consumer protection risks, is critically important. It could make the difference between a world in which the fintech wave helps community banks become the platforms of the future, on the one hand, or, on the other hand, a world in which fintech instead further widens the gulf between community banks and the largest banks.


Deutsche Bank Fined For Rigging FX Trading

The US Federal Reserve has announced two enforcement actions against Deutsche Bank AG that will require bank to pay a combined $156.6 million in civil money penalties.

The Federal Reserve on Thursday announced two enforcement actions against Deutsche Bank AG that will require the bank to pay a combined $156.6 million in civil money penalties. The bank will pay a $136.9 million fine for unsafe and unsound practices in the foreign exchange (FX) markets, as well as a $19.7 million fine for failure to maintain an adequate Volcker rule compliance program prior to March 30, 2016.

In levying the FX fine on Deutsche Bank, the Board found deficiencies in the firm’s oversight of, and internal controls over, FX traders who buy and sell U.S. dollars and foreign currencies for the organization’s own accounts and for customers. The firm failed to detect and address that its traders used electronic chatrooms to communicate with competitors about their trading positions. The Board’s order requires Deutsche Bank to improve its senior management oversight and controls relating to the firm’s FX trading.

The Board is also requiring the firm to cooperate in any investigation of the individuals involved in the conduct underlying the FX enforcement action and is prohibiting the organization from re-employing or otherwise engaging individuals who were involved in this conduct.

Separately, the Board found gaps in key aspects of Deutsche Bank’s compliance program for the Volcker rule, which generally prohibits insured depository institutions and any company affiliated with an insured depository institution from engaging in proprietary trading and from acquiring or retaining ownership interests in, sponsoring, or having certain relationships with a hedge fund or private equity fund.

The Board also found that the firm failed to properly undertake certain required analyses concerning its permitted market-making related activities. The consent order requires Deutsche Bank to improve its senior management oversight and controls relating to the firm’s compliance with Volcker rule requirements.

US Industrial production increased 0.5 percent in March

Industrial production increased 0.5 percent in March after moving up 0.1 percent in February according to the US Federal Reserve.

The increase in March was more than accounted for by a jump of 8.6 percent in the output of utilities—the largest in the history of the index—as the demand for heating returned to seasonal norms after being suppressed by unusually warm weather in February.

Manufacturing output fell 0.4 percent in March, led by a large step-down in the production of motor vehicles and parts; factory output aside from motor vehicles and parts moved down 0.2 percent. The production at mines edged up 0.1 percent. For the first quarter as a whole, industrial production rose at an annual rate of 1.5 percent.

At 104.1 percent of its 2012 average, total industrial production in March was 1.5 percent above its year-earlier level.

Capacity utilization for the industrial sector increased 0.4 percentage point in March to 76.1 percent, a rate that is 3.8 percentage points below its long-run (1972–2016) average.

What Is the Informal Labor Market?

From The St.Louis Fed On The Economy Blog.

Although often associated with developing countries, illicit activities or undocumented workers, the informal labor market is much broader than many would imagine. In fact, people from all walks of life participate in a wide array of legitimate business ventures that are part of the informal economy. So, how big is the U.S.’s informal labor market, and who participates in it?

What Is the Informal Labor Market?

There is no unique definition for informal employment. However, a generally accepted way to define it is by considering individuals (and their employers) who engage in productive activities that are not taxed or registered by the government.1

Though this type of work has always existed—picture the fruit vendor at the farmers’ market who only accepts cash for payment—the expansion of online platforms that facilitate these arrangements has increased their visibility and fueled their popularity.

Measuring the Informal Labor Market

Numerous surveys have surfaced lately in an effort to better understand the fringes of the U.S. labor market. Though methodologies differ (as do the specific questions these surveys attempt to answer), comparing the results helps shine a light on the sometimes elusive nature of the informal labor market.

Survey of Informal Work Participation

For example, the Survey of Informal Work Participation within the Survey of Consumer Expectations revealed that about 20 percent of non-retired adults at least 21 years old in the U.S. generated income informally in 2015.2 The share jumped to 37 percent when including those who were exclusively involved in informal renting and selling activities.

When breaking down the results by the Bureau of Labor Statistics (BLS) employment categories, about 16 percent of workers employed full time participated in informal work. Not surprisingly, the highest incidence of informal work was among those who are employed part time for economic reasons, with at least 30 percent participating in informal work. Also, at least 15 percent of those who are considered not in the labor force by the BLS also participated in informal work.

Enterprising and Informal Work Activities Survey

Another example is the Enterprising and Informal Work Activities (EIWA) survey, which revealed that 36 percent of adults in the U.S. (18 and older) worked informally in the second half of 2015.3 Of these informal workers, 56 percent self-identified as also being formally employed, and 20 percent said they worked multiple jobs (including full-time and part-time positions).

Survey Differences

The difference in methodologies between these two surveys is clear simply from looking at the basic results. Despite pointing in similar directions, the results on the extent of the informal labor market cannot be directly compared to each other. But when we look at the demographic breakdown of contingent and informal workers, the results are quite consistent.

The EIWA survey showed that informal workers were distributed across all income categories. For example:

  • 30 percent of respondents reported having an annual income of $100,000 or greater.
  • 18 percent reported earning less than $25,000.

There were slightly more women than men among informal workers, though the share of women was much larger in lower income categories.

The majority of informal workers were white, non-Hispanic (64 percent), while the share of Hispanic workers tended to be slightly higher than that of African-Americans (16 and 12 percent, respectively). The racial breakdowns were consistent across most income categories, with a higher incidence of informal work among minorities in the lowest income categories.

Finally, most informal workers had at least a college degree (31 percent) or some college (30 percent), but high school graduates were also a sizeable share (26 percent).4

Impact on the Labor Market as a Whole

Capturing the extent of the informal labor market in the U.S. may help improve the measures of employment and labor market slack, as well as better measure the effects that informal employment activities have on the U.S. economy.

Moreover, it would help improve policies to incentivize workers in the informal sector to participate fully in the formal sector and by consequence take advantage of benefits that are in place for formal-sector jobs.

Notes and References

1 Demetra Smith Nightingale and Stephen Wandner provide other definitions of informal employment and associate different types of workers with the formality of their employment arrangements. See Smith Nightingale, Demetra and Wandner, Stephen A. “Informal and Nonstandard Employment in the United States: Implications for Low-Income Working Families.” The Urban Institute, Brief 20, August 2011.

2 See Bracha, Anat and Burke, Mary A. “Who Counts as Employed? Informal Work, Employment Status, and Labor Market Slack.” Federal Reserve Bank of Boston Working Paper No. 16-29, December 2016.

3 See Robles, Barbara and McGee, Marysol. “Exploring Online and Offline Informal Work: Findings from the Enterprising and Informal Work Activities (EIWA) Survey.” Finance and Economics Discussion Series 2016-089. Washington: Board of Governors of the Federal Reserve System, October 2016.

4 Appendix D in Robles and McGee (2016) shows these demographic characteristics are consistent across different surveys.

US Consumer Credit Rises

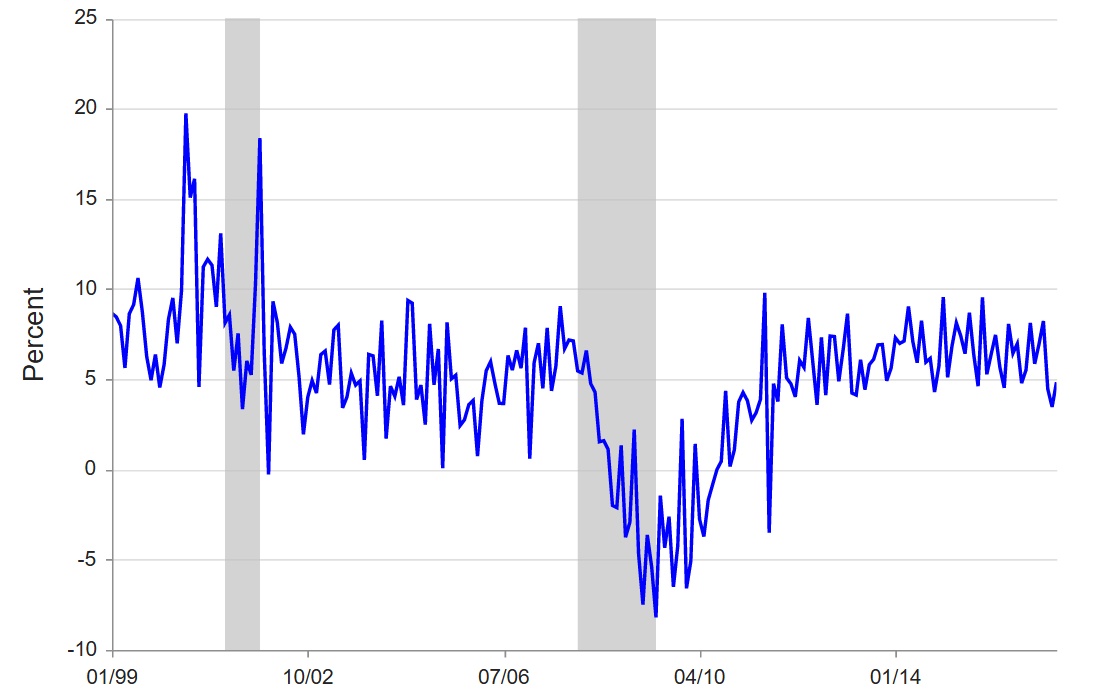
In February, consumer credit increased at a seasonally adjusted annual rate of 4-3/4 percent. Revolving credit increased at an annual rate of 3-1/2 percent, while nonrevolving credit increased at an annual rate of 5-1/4 percent, according to the Federal Reserve.

Consumer Credit Growth (Seasonally Adjusted). Recessions are shaded.

This covers most credit extended to individuals, excluding loans secured by real estate, including student loans, car loans, and credit cards.

Fed Minutes From March Meeting – Financial Market Impact

The minutes of the US Federal Open Market Committee March 14–15, 2017 have been released. They provide context for the rate decision. All but
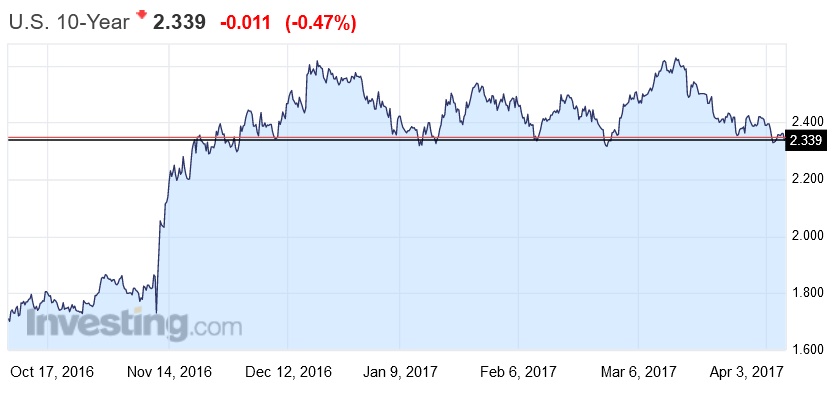
one member agreed to raise the target range for the federal funds rate to ¾ to 1 percent. We also got some impressions on how the FED will manage the billions of dollars in assets it purchased in an attempt to reflate the economy after the financial crisis. This is a big deal, with global consequences for financial markets.  Not least, think about how expected future rate rises may interact with reducing asset purchases.  Bond prices may be impacted. The US T10 was down a little.

In the U.S. economic projection prepared by the staff for the March FOMC meeting, the near-term forecast for real GDP growth was a little weaker, on net, than in the previous projection. Real GDP was expected to expand at a slower rate in the first quarter than in the fourth quarter, reflecting some data for January that were judged to be transitorily weak, but growth was projected to move back up in the second quarter.

Recent information on housing activity suggested that residential investment increased at a solid pace early in the year. Starts for both new single-family homes and multifamily units strengthened in the fourth quarter and remained near those levels in January. Issuance of building permits for new single-family homes—which tends to be a reliable indicator of the underlying trend in construction—also moved up in the fourth quarter and remained near that level in January. Sales of existing homes rose in January, while new home sales maintained their fourth-quarter pace.

The open market reinvestment operations, are currently supporting the financial markets in the US, and are having global impact on interest rate and bond benchmarks. When the time comes to implement a change to reinvestment policy, participants generally preferred to phase out or cease reinvestments of both Treasury securities and agency MBS.

The staff provided several briefings that summarized issues related to potential changes to the Committee’s policy of reinvesting principal payments from securities held in the System Open Market Account (SOMA). These briefings discussed the macroeconomic implications of alternative strategies the Committee could employ with respect to reinvestments, including making the timing of an end to reinvestments either date dependent or dependent on economic conditions.

The briefings also considered the advantages and disadvantages of phasing out reinvestments or ending them all at once as well as whether using the same approach would be appropriate for both Treasury securities and agency mortgage-backed securities (MBS). In their discussion, policymakers reaffirmed the approach to balance sheet normalization articulated in the Committee’s Policy Normalization Principles and Plans announced in September 2014. In particular, participants agreed that reductions in the Federal Reserve’s securities holdings should be gradual and predictable, and accomplished primarily by phasing out reinvestments of principal received from those holdings. Most participants expressed the view that changes in the target range for the federal funds rate should be the primary means for adjusting the stance of monetary policy when the federal funds rate was above its effective lower bound. A number of participants indicated that the Committee should resume asset purchases only if substantially adverse economic circumstances warranted greater monetary policy accommodation than could be provided by lowering the federal funds rate to the effective lower bound. Moreover, it was noted that the Committee’s policy of maintaining reinvestments until normalization of the level of the federal funds rate was well under way had supported the smooth and effective conduct of monetary policy and had helped maintain accommodative financial conditions.

Is OPEC Losing Its Ability to Influence Oil Prices?

From The St. Louis Fed On The Economy Blog.

The Organization for Petroleum Exporting Countries (OPEC) has exerted a great deal of control over world-wide oil production and prices since 1960.1 The figure below shows the percentage of oil production by country for 2015.

OPEC

OPEC member nations made up 42 percent of world oil production, giving their production announcements significant weight. Historically, announcements from OPEC regarding future decreases in production have been accompanied by increases in prices.2

OPEC and Russia Agree to Cut Production

Late in 2016, OPEC and Russia agreed to cut production from 33.24 million barrels per day to between 32.5 and 33 million barrels per day in an effort to increase the price of oil. Prices had fallen from around $105 per barrel in June 2014 to around $30 per barrel in early 2016.

World oil production, on the other hand, increased 3.1 percent from 2014 to 2015. This increase is large in historical context; oil production has increased 1 percent on average per year since 1980.

Oil Prices

The next figure shows the time series of the price of oil measured by the spot price for West Texas Intermediate (WTI) over the past three years. The red lines indicate the timings of the announcement of the production reduction (Sept. 28) and the OPEC meeting to finalize this agreement (Nov. 30).

While prices have risen slightly since the announcement, neither of these events was accompanied by large spikes in oil prices.

Is OPEC Losing Its Impact on Prices?

So, why have oil prices not increased substantially? A combination of factors may have contributed (albeit not equally) to dampening the effect of the announcement.

First, oil inventories have accumulated over the past few years, and these accumulated inventories are preventing oil prices from rising quickly. Inventories dampen the effects of sudden changes in oil supply or demand.

When OPEC cuts production, supply is reduced, and Organization for Economic Cooperation and Development countries draw on their oil inventories to supplement the reduced production. The market price reaction to the production cut is delayed until the inventories are depleted. However, once inventories are drawn down, prices can be expected to rise.

Second, while OPEC members represent a large portion of oil production, a number of other countries—including the U.S.—account for 58 percent of the oil production and are not part of the OPEC agreement to reduce production.

U.S. Oil Production

The U.S., in particular, is projected to increase its production, especially if the price of oil experiences a sustained rise to more than $55 per barrel. In fact, prices above $35 per barrel are high enough to put some rigs into production.3

As prices increased through the summer of 2016, U.S. oil production rose, with the bulk of this increase coming from rigs in the Gulf of Mexico. The increase in production did not originate from the shale oil fields, suggesting that as prices rise, U.S. oil production can further increase.

In fact, U.S. oil production has increased to the point in which the U.S. has become an exporter. The figure below shows monthly U.S. oil exports.

BlogImage_OilExports_032117

Banning U.S. Oil Exports

Before 2015, the export of crude oil was banned in the U.S. The ban was a part of the Energy Policy and Conservation Act of 1975, and was meant to lessen the nation’s dependence on OPEC and foreign producers.

During the ban, the U.S. Department of Commerce could issue special licenses to allow certain producers to export specific types of crude oil, keeping exports just above zero. When technological advances increased the amount of oil production in the U.S., U.S. WTI prices started falling below global Brent oil prices. This gap motivated domestic producers to push back against the export ban, and Congress repealed it in December 2015.

Before the repeal, former President Barack Obama had already begun issuing more special licenses to export. Oil exports increased dramatically, from around 400,000 barrels per day at the end of 2015 to almost 700,000 in September 2016.

As the OPEC production restrictions take hold and global inventories are drawn down, the price of oil is expected to rise. This increase, however, may be gradual and prolonged, especially with non-OPEC countries having the ability to ramp up production.

Notes and References

1 OPEC currently has 13 member countries: Algeria, Iran, Iraq, Venezuela, Saudi Arabia, Kuwait, Nigeria, Qatar, the United Arab Emirates, Ecuador, Gabon, Libya and Angola. Indonesia suspended its membership late last year.

2 Lin, Sharon Xiaowen; and Tamvakis, Michael. “OPEC Announcements and Their Effects on Crude Oil Prices,” Energy Policy, February 2010, Vol. 38, Issue 2, pp. 1010-16.

3 Mlada, Sona. “North American Shale Breakeven Prices: What to Expect from 2017?” Rystad Energy, Feb. 16, 2017.

By Michael Owyang, Assistant Vice President, and Hannah G. Shell, Senior Research Associate

Fed Embarks on New Phase of Normalization

The US Federal Reserve’s (the Fed) decision to hike interest rates by 25bps represents the beginning of a new phase of US monetary policy normalization, says Fitch Ratings.


The prediction for three hikes in 2017 in the Federal Open Market Committee’s (FOMC) December 2016 Summary of Economic Projections was initially met with some skepticism in financial markets. However, by moving rates up again so quickly, the Fed now looks well on track to deliver. Two rate hikes within the space of just over three months and some marginal toughening up of the statement on forward guidance underscore the contrast with the glacial and hesitant approach to unwinding stimulus seen in the past few years. More broadly, Fitch believes that the recent US rate hikes could mark the beginning of a significant shift in the global interest rate environment, with benchmark US policy rates settling higher over the long term than current market expectations.

The decision to raise the Fed Funds target rate to 0.75%-1.00% marks the second rate hike in just over three months. This represents a major acceleration in Fed action. Fitch now expects a total of seven hikes in 2017 and 2018, bringing the policy rate to 2.50%. This contrasts with just two rate hikes in total between the end of 2008 and 2016.

Macro indicators through 2H16 and early 2017 reinforce the likelihood of a pickup in rate normalization over the medium term. GDP growth of 2.6% (annualized) in 2H16 was a significant recovery from 1H16, underpinned by improvements in private investment and industrial output. So far, jobs data this year have also been supportive, with the latest nonfarm payrolls, unemployment and private sector earnings figures all pointing to tightening labor market conditions.

Material fiscal easing should bolster positive domestic demand trends. President Trump’s agenda of tax cuts, fiscal stimulus and deregulation in the financial services and other sectors strongly indicates that some level of growth boost is likely. Although the precise form of stimulus remains uncertain, Fitch believes that fiscal policy could add up to 0.3pp to economic growth in both 2017 and 2018. Fitch recently revised up its US growth expectations in recognition of the increased likelihood of fiscal easing, higher private investment and improving global outlook. Fitch forecasts US GDP growth to accelerate to 2.3% and 2.6% in 2017 and 2018, respectively.

Fitch does not believe that the increased pace of Fed rate hikes poses a risk to US economic growth. However, the impact from dollar strengthening could have wider global effects, especially should this result in prolonged monetary policy divergence. US rate rises, combined with fiscal stimulus, at a time when the European Central Bank and Bank of Japan are continuing to pursue ultra-loose monetary policy, should prolong the dollar strengthening trend. Rising rates and dollar strength have historically added to external financing risks for emerging markets.

Fitch believes that market expectations for a permanently lower equilibrium interest rate in the US and the continuation of ultra-loose monetary policy for several more years could be increasingly challenged. This could result in a rapid shift in consensus expectations toward a higher terminal rate and a faster pace of normalization. Notably, market consensus was not expecting a March rate hike as early as last month, although healthy macro data releases and hawkish public statements from FOMC members resulted in a quick shift in expectations ahead of the actual decision.

Rising interest rates in 2017 and 2018 will not be a broad concern for US corporates in aggregate, but pockets of risk could challenge entities at the lower end of the rating spectrum, according to Fitch Ratings.

With current LIBOR levels at or above most pricing floors – USD 3M LIBOR was 1.11% as of March 8 – subsequent rate hikes would expose leveraged loan issuers to reset risk that could pressure credit profiles and cash flow generation. This risk is most acute for deeply speculative-grade credits with large amounts of floating rate debt, already large interest burdens, and limited to negative FCF.

Near-term interest rate risk is most evident for leveraged issuers who took advantage of longstanding favorable market conditions to issue large amounts of floating-rate debt, but whose credit profiles deteriorated due to secular challenges or idiosyncratic issues that resulted in higher leverage, depressed cash flows and limited liquidity.

Retail companies, for example, with high floating-rate debt exposure could be particularly exposed to interest rate risk if secular challenges offset the benefits of an accelerating economy on top-line growth.

From a credit profile perspective, we are less concerned about exposure to fixed-rate high-yield (HY) bonds. Historically, HY spreads do not increase meaningfully until after the Fed has concluded its tightening cycle. As a result, modest policy rate increases may not be accompanied by corresponding increases in spreads.

Interest rates typically rise in response to higher inflation, usually during economic recoveries, implying generally improving credit profiles. Fitch’s Stable Outlook for US Corporates in 2017 supports this view.

Moreover, companies have been proactive in managing maturity profiles. US corporates have aggressively refinanced during nearly a decade of low interest rates, pushing out maturities with long-dated, low-coupon debt to maintain historically strong interest coverage metrics and solid liquidity profiles. We expect fundamentals to remain stable as expectations of growth in cash flow are fueled by persistent cost controls, efficiencies, and revenue growth, albeit weak.

The Trump administration’s tax proposal to cut the corporate tax rate to 15% and eliminate the tax-deductibility of interest expenses adds another layer of risk. Negative cash flow impact from the removal of interest expense deductibility may outweigh the positive cash flow impact from the corporate tax cut for issuers with high debt burdens and debt costs

The US is healing but we can’t even admit we’re ill

From The NewDaily.

The Federal Reserve’s widely anticipated rate rise is a reminder that while the US has learned from its housing market crash, our political leaders have created a record bubble of mortgage debt by shying away from reform.

When Fed chair Janet Yellen announced Thursday morning (Australian time) the fed-funds rate had risen to a new target range of 0.75 to 1 per cent, it caused barely a stir in markets. The New York Stock Exchange rose 0.8 per cent, as the Fed signalled future rate rises are likely to arrive sooner than previously expected.

These days the Fed telegraphs each move so effectively that markets no longer ask ‘will they move or not?’, but more ‘does that move reflect what’s really happening in the economy?’

Yes, with its years of super low rates, the Fed did set the scene for the 2009 housing collapse that hit global markets like a tsunami. But its three rate rises since the GFC have been spot on – late enough to avoid choking the recovery, but early enough to prevent inflation getting out of hand.

At a press conference Ms Yellen said the Fed is pushing rates back towards “normal” levels because the US economy has returned to reasonable health – growing at a “moderate pace”.

Meanwhile, Australia’s rates remain at historic lows. So what are we doing wrong?

The biggest reason we’re not seeing US-style growth is, gallingly, entirely self-imposed. Our political leaders have skewed the economy heavily towards real estate investing.

The vast sums of capital tied up in housing could be establishing new businesses, or backing the expansion of existing ones. Instead, we’re a nation hypnotised by capital gains that thinks buying and selling the same houses back and forth is a productive industry.

It all began in 1999, when treasurer Peter Costello cut capital gains tax to a rate well below the personal tax rates of middle- and upper-middle class Australians. It was one of the most economically harmful policies ever dreamt up in Canberra.

It did not take the nation’s accountants long to point out to clients that investing in a property, negatively gearing it for a few years, and then banking the capital gain at the new rate would slash the investor’s tax bills.

During the same period, the US was experiencing a credit bubble for different reasons – super low rates, plus the advent of sub-prime mortgages.

When the early ‘sub-prime’ phase of the GFC finally began to be felt, US house prices tumbled. And when the sub-prime crisis worked its way through the banking system, global stock markets crashed too.

Whereas the US learned from this and started rebuilding, we arrested our correction and did everything possible to keep the credit bubble growing.

As the share market tanked in 2009, Australian policy makers decided that the sacred cow of house prices must be protected at all costs. The 2009 first home buyer’s grant kickstarted that defence, and was topped up by most state governments too.

Even though the Rudd government’s own tax review – the Henry Tax Review – had recommended reining in negative gearing and the capital gains tax discount, all that was ignored.

The tax lurks stayed, gleefully maintained by the Abbott and Turnbull governments, and the RBA joined in by cutting interest rates that blew the credit bubble larger still.

The lack of action by politicians has pushed responsibility for reining in the bubble to the Australian Prudential Regulatory Authority, which imposed a fairly weak ‘speed limit’ on credit growth two years ago.

And now the RBA itself is threatening to put more “sand in the gears” of the credit machine.

It’s all too little, too late.

Australia, having ‘escaped’ the house price collapse that swept through so many nations in 2009, is now stuck in a self-imposed debt bubble.

Fed Lifts Rates Again

No surprise that the Fed lifted the Federal Fund Rate to 3/4 to 1 percent, it had been so well telegraphed. They point to ongoing accommodative financial conditions and the statement is quite dovish actually, so the rate of continued adjustment will be slow, and they have not rolled into the forecasts any upside from Trump’s policies.

The knock on effect will be significant, with further rises in the international capital market interest rates likely in response. The benchmark T10 bond yield is higher, once again but the market had already locked in the expected rise. The US dollar dropped.

The DOW was up after the news.

The AU Dollar was up, unexpectedly.

The Fed move will likely have a flow on effect to the Australian banks international funding costs (30-40% of the majors funds comes from this source), so expect continues upward pressure on mortgage rates here.

So far owner occupiers have seen out of cycle rates rises in the 20-30 basis point range, whilst investors have seen larger moves, up 50-60 basis points for variable loans. There is more to come.

Information received since the Federal Open Market Committee met in February indicates that the labor market has continued to strengthen and that economic activity has continued to expand at a moderate pace. Job gains remained solid and the unemployment rate was little changed in recent months. Household spending has continued to rise moderately while business fixed investment appears to have firmed somewhat. Inflation has increased in recent quarters, moving close to the Committee’s 2 percent longer-run objective; excluding energy and food prices, inflation was little changed and continued to run somewhat below 2 percent. Market-based measures of inflation compensation remain low; survey-based measures of longer-term inflation expectations are little changed, on balance.

Consistent with its statutory mandate, the Committee seeks to foster maximum employment and price stability. The Committee expects that, with gradual adjustments in the stance of monetary policy, economic activity will expand at a moderate pace, labor market conditions will strengthen somewhat further, and inflation will stabilize around 2 percent over the medium term. Near-term risks to the economic outlook appear roughly balanced. The Committee continues to closely monitor inflation indicators and global economic and financial developments.

In view of realized and expected labor market conditions and inflation, the Committee decided to raise the target range for the federal funds rate to 3/4 to 1 percent. The stance of monetary policy remains accommodative, thereby supporting some further strengthening in labor market conditions and a sustained return to 2 percent inflation.

In determining the timing and size of future adjustments to the target range for the federal funds rate, the Committee will assess realized and expected economic conditions relative to its objectives of maximum employment and 2 percent inflation. This assessment will take into account a wide range of information, including measures of labor market conditions, indicators of inflation pressures and inflation expectations, and readings on financial and international developments. The Committee will carefully monitor actual and expected inflation developments relative to its symmetric inflation goal. The Committee expects that economic conditions will evolve in a manner that will warrant gradual increases in the federal funds rate; the federal funds rate is likely to remain, for some time, below levels that are expected to prevail in the longer run. However, the actual path of the federal funds rate will depend on the economic outlook as informed by incoming data.

The Committee is maintaining its existing policy of reinvesting principal payments from its holdings of agency debt and agency mortgage-backed securities in agency mortgage-backed securities and of rolling over maturing Treasury securities at auction, and it anticipates doing so until normalization of the level of the federal funds rate is well under way. This policy, by keeping the Committee’s holdings of longer-term securities at sizable levels, should help maintain accommodative financial conditions.

Voting for the FOMC monetary policy action were: Janet L. Yellen, Chair; William C. Dudley, Vice Chairman; Lael Brainard; Charles L. Evans; Stanley Fischer; Patrick Harker; Robert S. Kaplan; Jerome H. Powell; and Daniel K. Tarullo. Voting against the action was Neel Kashkari, who preferred at this meeting to maintain the existing target range for the federal funds rate.