Is Local Unemployment Related to Local Housing Prices?

From The St. Louis FED.

The U.S. national labor market has recovered from the effects of the 2007-2009 recession; however despite the national labor market recovery, significant regional variation remains. Recent economic research highlights links between regional labor and housing markets. In their article, “ The Recent Evolution of Local U.S. Labor Markets, ” Authors Maximiliano Dvorkin and Hannah Shell examined the recession and recovery by reviewing the correlation between county-level unemployment rates and changes in housing prices.

National unemployment reached a pre-recession low in December 2007; by October 2009 the unemployment rate in most counties increased between 4 and 20 percentage points. The authors found that areas with higher unemployment rates before the recession experienced larger increases in unemployment during the recession, and those areas with lower unemployment rates before the recession experienced smaller upticks in unemployment during the recession.

The authors theorized that one reason for the disparity in unemployment rate increases could be related to the housing supply. Specifically, the unemployment rates in Arizona, New Mexico, Nevada and Utah remained above their pre-recession levels; these are also areas where housing prices dropped significantly.

When they examined the percent change in county house prices with the change in the county unemployment rate, the results showed a strong negative correlation, meaning that counties with larger decreases in housing prices experienced larger increases in the unemployment rate, perhaps because larger house price declines during downturns are leading to larger declines in local consumption spending that further depress the local economy.

FED Sets Up Parameters For 2017 Dodd-Frank Stress Tests

The Federal Reserve Board on Friday released the scenarios to be used by banks and supervisors for the 2017 Comprehensive Capital Analysis and Review (CCAR) and Dodd-Frank Act stress test exercises and also issued instructions to firms participating in CCAR.

CCAR evaluates the capital planning processes and capital adequacy of the largest U.S.-based bank holding companies, including the firms’ planned capital actions such as dividend payments and share buybacks and issuances. The Dodd-Frank Act stress tests are a forward-looking assessment to help assess whether firms have sufficient capital. Stress tests help make sure that banks will be able to lend to households and businesses even in a serious recession by ensuring that they have adequate capital to absorb losses they may sustain.

This year, 13 of the largest and most complex bank holding companies will be subject to both a quantitative evaluation of their capital adequacy and a qualitative evaluation of their capital planning capabilities. As announced earlier this week by the Board, 21 firms with less complex operations will no longer be subject to the qualitative portion of CCAR, relieving them of significant burden.

Financial institutions are required to use the scenarios in both the stress tests conducted as part of CCAR and those required by the Dodd-Frank Act. The outcomes are measured under three scenarios: severely adverse, adverse, and baseline.

For the 2017 cycle, the severely adverse scenario is characterized by a severe global recession in which the U.S. unemployment rate rises by about 5.25 percentage points to 10 percent, accompanied by a period of heightened stress in corporate loan markets and commercial real estate markets. The adverse scenario features a moderate recession in the United States, as well as weakening economic activity across all countries included in the scenario. The adverse and severely adverse scenarios describe hypothetical sets of events designed to assess the strength of banking organizations and their resilience. They are not forecasts. The baseline scenario is in line with average projections from surveys of economic forecasters. It does not represent the forecast of the Federal Reserve.

Each scenario includes 28 variables–such as gross domestic product, unemployment rate, stock market prices, and interest rates–encompassing domestic and international economic activity. Along with the variables, the Board is publishing a narrative that describes the general economic conditions in the scenarios and changes in the scenarios from the previous year.

As in prior years, six bank holding companies with large trading operations will be required to factor in a global market shock as part of their scenarios. Additionally, eight bank holding companies with substantial trading or processing operations will be required to incorporate a counterparty default scenario.

The Board is also releasing several letters with additional information on its stress testing program. One letter describes the reduced data required from the 21 firms that have been removed from the qualitative portion of CCAR; a second details enhancements and changes made to certain supervisory loss models; and a third provides an overview of the stress testing program and its expectations for foreign firms that are beginning the stress testing program this year, but are not yet required to publicly report their results under the Board’s rules.

Bank holding companies participating in CCAR are required to submit their capital plans and stress testing results to the Federal Reserve on or before April 5, 2017. The Federal Reserve will announce the results of its supervisory stress tests by June 30, 2017, with the exact date to be announced later.

Firm Removed from qualitative portion of CCAR New to CCAR 2017 Subject to global market shock Subject to counterparty default
Ally Financial Inc. X
American Express Company X
BancWest Corporation X
Bank of America Corporation X X
The Bank of New York Mellon Corporation X
BB Corporation X
BBVA Compass Bancshares, Inc. X
BMO Financial Corp. X
Capital One Financial Corporation
CIT Group Inc. X X
Citigroup Inc. X X
Citizens Financial Group, Inc. X
Comerica Incorporated X
Deutsche Bank Trust Corporation X
Discover Financial Services X
Fifth Third Bancorp X
The Goldman Sachs Group, Inc. X X
HSBC North America Holdings Inc.
Huntington Bancshares Incorporated X
JPMorgan Chase & Co. X X
KeyCorp X
M Bank Corporation X
Morgan Stanley X X
MUFG Americas Holdings Corporation X
Northern Trust Corporation X
The PNC Financial Services Group, Inc.
Regions Financial Corporation X
Santander Holdings USA, Inc. X
State Street Corporation X
SunTrust Banks, Inc. X
TD Group US Holdings LLC
U.S. Bancorp
Wells Fargo & Company X X
Zions Bancorporation X

FED Holds Rate This Month

The FED held their benchmark rate today, whilst still leaving the door open for rises later.

Information received since the Federal Open Market Committee met in December indicates that the labor market has continued to strengthen and that economic activity has continued to expand at a moderate pace. Job gains remained solid and the unemployment rate stayed near its recent low. Household spending has continued to rise moderately while business fixed investment has remained soft. Measures of consumer and business sentiment have improved of late. Inflation increased in recent quarters but is still below the Committee’s 2 percent longer-run objective. Market-based measures of inflation compensation remain low; most survey-based measures of longer-term inflation expectations are little changed, on balance.

Consistent with its statutory mandate, the Committee seeks to foster maximum employment and price stability. The Committee expects that, with gradual adjustments in the stance of monetary policy, economic activity will expand at a moderate pace, labor market conditions will strengthen somewhat further, and inflation will rise to 2 percent over the medium term. Near-term risks to the economic outlook appear roughly balanced. The Committee continues to closely monitor inflation indicators and global economic and financial developments.

In view of realized and expected labor market conditions and inflation, the Committee decided to maintain the target range for the federal funds rate at 1/2 to 3/4 percent. The stance of monetary policy remains accommodative, thereby supporting some further strengthening in labor market conditions and a return to 2 percent inflation.

In determining the timing and size of future adjustments to the target range for the federal funds rate, the Committee will assess realized and expected economic conditions relative to its objectives of maximum employment and 2 percent inflation. This assessment will take into account a wide range of information, including measures of labor market conditions, indicators of inflation pressures and inflation expectations, and readings on financial and international developments. In light of the current shortfall of inflation from 2 percent, the Committee will carefully monitor actual and expected progress toward its inflation goal. The Committee expects that economic conditions will evolve in a manner that will warrant only gradual increases in the federal funds rate; the federal funds rate is likely to remain, for some time, below levels that are expected to prevail in the longer run. However, the actual path of the federal funds rate will depend on the economic outlook as informed by incoming data.

The Committee is maintaining its existing policy of reinvesting principal payments from its holdings of agency debt and agency mortgage-backed securities in agency mortgage-backed securities and of rolling over maturing Treasury securities at auction, and it anticipates doing so until normalization of the level of the federal funds rate is well under way. This policy, by keeping the Committee’s holdings of longer-term securities at sizable levels, should help maintain accommodative financial conditions.

The Financing of Nonemployer Firms

From The St. Louis Fed Blog.

Nonemployer firms that applied for financing were more likely to operate at a loss, according to the recently released 2015 Small Business Credit Survey: Report on Nonemployer Firms.

This report, produced jointly by the Federal Reserve banks of St. Louis, Atlanta, Boston, Cleveland, New York, Philadelphia and Richmond, examined trends in businesses with no employees other than the owners. As the report noted, these businesses make up nearly 80 percent of all U.S. firms.

Applying for Financing

The report noted that 32 percent of survey respondents said they applied for financing in the previous 12 months. Among those who applied, the most common reason (66 percent) was to expand the business or to take advantage of a new opportunity. The next most common reason (38 percent) was to cover operating expenses. (Respondents could select multiple answers.)

Among those businesses that did not apply for financing, the top three reasons were:

  • Debt aversion (33 percent)
  • Already had sufficient financing (30 percent)
  • Believed they would be turned down (25 percent)

Profitability: Applicants vs. Nonapplicants

As the report noted: “Collectively, applicants were less profitable than the nonapplicants.” The figure below shows the difference.

profitability of small businesses that applied for financing

Financing Approval

Among firms that applied for financing, 41 percent were not approved for any of the funding they sought. The percentages of firms not receiving any funding grew smaller as firms grew larger: 48 percent of firms with less than $25,000 in revenue did not receive any funding, while only 28 percent of firms with revenues greater than $100,000 did not receive funding.

About 71 percent of firms received less financing than the amount sought. When asked about the primary impact of this financing shortfall, the top response (33 percent) said the firm had to delay expansion. Other top answers were that they used personal funds (22 percent), were unable to meet expenses (18 percent) and passed on business opportunities (13 percent).

Additional Resources

The Election’s Effect on Expected Inflation

From St. Louis Fed Blog.

Expected inflation rose steadily throughout 2016 and had a relatively large gain during the week of the U.S. elections. What does this mean and why is it important?

The Rise of Expected Inflation

The breakeven rate is the difference between the benchmark Treasury rate and its corresponding inflation-protected security rate. It is used as a market measure of expected inflation. For example, the difference between the 10-year constant maturity Treasury note and the 10-year inflation-protected Treasury note on Nov. 4 was 1.7 percent. This means that investors expect inflation to be around 1.7 percent over the next 10 years.

Over the period Nov. 4-11, the 30-year breakeven rate rose by 10 basis points, while both the 10-year and five-year breakeven rates rose by 8 basis points. By the last week of 2016, breakeven rates were inching closer to the Fed’s longer-run target of 2 percent inflation:1

  • The 30-year breakeven rate was 2.07 percent.
  • The 10-year rate was 1.97 percent.
  • The five-year rate was 1.85 percent.

The Election’s Effect on Expected Inflation

Though unexpected by most, the election results in early November delivered a positive shock to U.S. financial markets overall. Market expectations shifted with the anticipation of aggressive fiscal policy changes, including higher infrastructure spending, financial deregulation and major tax reforms. If these policy changes materialize, they could lead to higher productivity, higher growth rates and a quicker pace of inflation.

However, they could also lead to higher than anticipated levels of U.S. government debt and a growing deficit. Along with recent announcements of major oil-producing countries curbing production to reduce excess supply of oil and help push oil prices higher, speculation around these policies has reinforced expectations of higher inflation.

Despite historically low interest rates, and particularly after the steep decline in energy prices at the end of 2014, headline inflation in the U.S. has remained below the Fed’s target rate of 2 percent, as seen in the figure below.


Inflation expectations also declined below 2 percent toward the end of 2014. However, their rise during the last six months of 2016 is a sign suggesting future inflation is expected to be around the Fed’s target rate. At this point, which policies will come to fruition and their impact on the economy remains to be seen.

Notes and References

1 It’s important to note that the Fed’s inflation target is based on the personal consumption expenditures price index, while inflation-protected Treasuries rely on the consumer price index.

Does a Strong Dollar Slow the Growth Rate of GDP?

From The St. Louis Fed Blog.

Over the past several months, a new episode of appreciation of the dollar began. The dollar spiked noticeably Nov. 9 and 10 (the two days following the U.S. presidential election) and again on Dec. 15 (the day after the Federal Reserve announced its most recent rate hike).

This appreciation has renewed concern of a slowdown in U.S. economic growth through the channel of international trade. The appreciation of the dollar implies that U.S. goods become more expensive abroad, and hence tends to reduce U.S. exports.

Meanwhile, a strong dollar makes foreign goods cheaper to U.S. consumers, which tends to increase imports. The forces of increasing imports and decreasing exports both deteriorate the trade balance and could slow down the growth rate of the U.S. economy. This article reviews the impact a stronger dollar had on gross domestic product (GDP) growth from 2014 to the beginning of 2016, the previous significant episode of appreciation.

Previous Dollar Strengthening Episode

How much does international trade, in conjunction with such a sharp appreciation of the dollar, slow down the GDP growth rate? The Bureau of Economic Analysis reports international trade’s contribution to the GDP growth rate each quarter. The figure below plots the GDP growth rate, the trade component’s contribution to GDP growth and the appreciation of the dollar from the second quarter of 2014 to the first quarter of 2016.1

TradeGDPGrowth

It is clear that a strong dollar is associated with net exports contributing negatively to GDP growth. During the sample period’s two-year span, trade contributed positively to GDP growth in only one quarter.

The negative impact was particularly strong over the first half of the appreciation period. For example, during the fourth quarter of 2014 and the first quarter of 2015, the contributions to the GDP growth rate from net exports were -1.14 percent and -1.65 percent, respectively. The negative effects diminished by the end of 2015, standing at -0.5 percent despite the dollar’s increase in value of another 10 percent.

Imports and Exports

The next figure further decomposes international trade’s contribution to GDP growth into exports and imports.

ExpImpGDPGrowth

In response to the strength of the dollar, the contributions from imports played a much more significant role than that of exports. The cumulative contribution of imports to GDP growth was -4.6 percent, while the cumulative contribution of exports was slightly positive at 0.85 percent. This suggests an asymmetric reaction between exports and imports in response to increases in the dollar’s exchange rate. Thus, it is reasonable to conclude that the slowdown in GDP growth was associated more with the growth of imports rather than the reduction in exports.

In sum, the new episode of appreciation of the dollar that began over the past several months is likely to hurt the current growth rate of GDP through an increase in imports rather than a decrease in exports if the trend from the previous period of appreciation holds.

Notes and References

1 We used the real broad trade weighted U.S. dollar index, indexed to its average over the sample period.

FED Affirms Future Rate Rises

Federal Reserve Chair Janet L. Yellen spoke at the the Commonwealth Club, San Francisco, California on “The Goals of Monetary Policy and How We Pursue Them.” She reaffirmed the expectation of future rate rises – a few times a year until, by the end of 2019, it is close to its longer-run neutral rate of 3 percent.

https://youtu.be/ktBgb4xHKGY

The extraordinarily severe recession required an extraordinary response from monetary policy, both to support the job market and prevent deflation. We cut our short-term interest rate target to near zero at the end of 2008 and kept it there for seven years. To provide further support to American households and businesses, we pressed down on longer-term interest rates by purchasing large amounts of longer-term Treasury securities and government-guaranteed mortgage securities. And we communicated our intent to keep short-term interest rates low for a long time, thus increasing the downward pressure on longer-term interest rates, which are influenced by expectations about short-term rates.

Now, it’s fair to say, the economy is near maximum employment and inflation is moving toward our goal. The unemployment rate is less than 5 percent, roughly back to where it was before the recession. And, over the past seven years, the economy has added about 15-1/2 million net new jobs. Although inflation has been running below our 2 percent objective for quite some time, we have seen it start inching back toward 2 percent last year as the job market continued to improve and as the effects of a big drop in oil prices faded. Last month, at our most recent meeting, we took account of the considerable progress the economy has made by modestly increasing our short-term interest rate target by 1/4 percentage point to a range of 1/2 to 3/4 percent. It was the second such step–the first came a year earlier–and reflects our confidence the economy will continue to improve.

Now, many of you would love to know exactly when the next rate increase is coming and how high rates will rise. The simple truth is, I can’t tell you because it will depend on how the economy actually evolves over coming months. The economy is vast and vastly complex, and its path can take surprising twists and turns. What I can tell you is what we expect–along with a very large caveat that our interest rate expectations will change as our outlook for the economy changes. That said, as of last month, I and most of my colleagues–the other members of the Fed Board in Washington and the presidents of the 12 regional Federal Reserve Banks–were expecting to increase our federal funds rate target a few times a year until, by the end of 2019, it is close to our estimate of its longer-run neutral rate of 3 percent.

The term “neutral rate” requires some explaining. It is the rate that, once the economy has reached our objectives, will keep the economy on an even keel. It is neither pressing on the gas pedal to make the car go faster nor easing off so much that the car slows down. Right now our foot is still pressing on the gas pedal, though, as I noted, we have eased back a bit. Our foot remains on the pedal in part because we want to make sure the economic expansion remains strong enough to withstand an unexpected shock, given that we don’t have much room to cut interest rates. In addition, inflation is still running below our 2 percent objective, and, by some measures, there may still be some room for progress in the job market. For instance, wage growth has only recently begun to pick up and remains fairly low. A broader measure of unemployment isn’t quite back to its pre-recession level. It includes people who would like a job but have been too discouraged to look for one and people who are working part time but would rather work full time.

Nevertheless, as the economy approaches our objectives, it makes sense to gradually reduce the level of monetary policy support. Changes in monetary policy take time to work their way into the economy. Waiting too long to begin moving toward the neutral rate could risk a nasty surprise down the road–either too much inflation, financial instability, or both. In that scenario, we could be forced to raise interest rates rapidly, which in turn could push the economy into a new recession.

The factors I have just discussed are the usual sort that central bankers consider as economies move through a recovery. But a longer-term trend–slow productivity growth–helps explain why we don’t think dramatic interest rate increases are required to move our federal funds rate target back to neutral. Labor productivity–that is, the output of goods and services per hour of work–has increased by only about 1/2 percent a year, on average, over the past six years or so and only 1-1/4 percent a year over the past decade. That contrasts with the previous 30 years when productivity grew a bit more than 2 percent a year. This productivity slowdown matters enormously because Americans’ standard of living depends on productivity growth. With productivity growth of 2 percent a year, the average standard of living will double roughly every 35 years. That means our children can reasonably hope to be better off economically than we are now. But productivity growth of 1 percent a year means the average standard of living will double only every 70 years.

Economists do not fully understand the causes of the productivity slowdown. Some emphasize that technological progress and its diffusion throughout the economy seem to be slower over the past decade or so. Others look at college graduation rates, which have flattened out after rising rapidly in previous generations. And still others focus on a dramatic slowing in the creation of new businesses, which are often more innovative than established firms. While each of these factors has likely played a role in slowing productivity growth, the extent to which they will continue to do so is an open question.

Why does slow productivity growth, if it persists, imply a lower neutral interest rate? First, it implies that the economy’s usual rate of output growth, when employment is at its maximum and prices are stable, will be significantly slower than the post-World War II average. Slower economic growth, in turn, implies businesses will see less need to invest in expansion. And it implies families and individuals will feel the need to save more and spend less. Because interest rates are the mechanism that brings the supply of savings and the demand for investment funds into balance, more saving and less investment imply a lower neutral interest rate. Although we can’t directly measure the neutral interest rate, it is something that can be estimated in retrospect. And, as we have increasingly realized, it has probably been trending down for a while now. Our current 3 percent estimate of the longer-run neutral rate, for instance, is a full percentage point lower than our estimate just three years ago.

You might be thinking, what does this discussion of rather esoteric concepts such as the neutral rate mean to me? If you are a borrower, it means that, although the interest rates you pay on, say, your auto loan or mortgage or credit card likely will creep higher, they probably will not increase dramatically. Likewise, if you are a saver, the rates you earn could inch higher after a while, but probably not by a lot. For some years, I’ve heard from savers who want higher rates, and now I’m beginning to hear from borrowers who want lower rates. I can’t emphasize strongly enough, though, that we are not trying to help one of those groups at the expense of the other. We’re focused very much on that dual mandate I keep mentioning. At the end of the day, we all benefit from plentiful jobs and stable prices, whether we are savers or borrowers–and many of us, of course, are both.

Economics and monetary policy are, at best, inexact sciences. Figuring out what the neutral interest rate is and setting the right path toward it is not like setting the thermostat in a house: You can’t just set the temperature at 68 degrees and walk away. And, because changes in monetary policy affect the economy with long lags sometimes, we must base our decisions on our best forecasts of an uncertain future. Thus, we must continually reassess and adjust our policies based on what we learn.

The Problem With Low Interest Rates

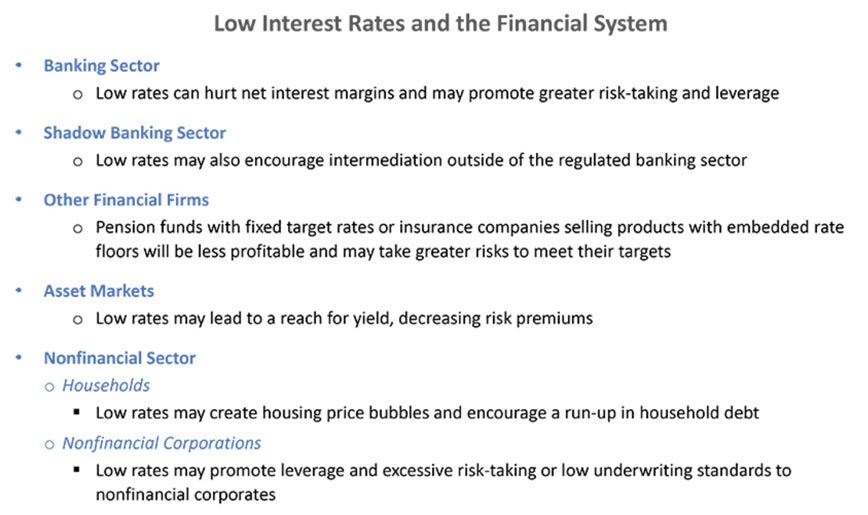
Fed Governor Jerome H. Powell spoke on “Low Interest Rates and the Financial System“. Monetary policy may sometimes face trade offs between macroeconomic objectives and financial stability. He argues that”low for long” interest rates have supported slow but steady progress to full employment and stable prices, which has in turn supported financial stability. But, there are difficult trade offs to manage. Over time, low rates can put pressure on the business models of financial institutions. And low rates can lead to excessive leverage and broadly unsustainable asset prices.

Whilst there are times when all of these objectives are aligned. For example, the Fed’s initial unconventional policies supported both market functioning and aggregate demand. More broadly, post-crisis monetary policy supported asset values, reduced interest payments, and increased both employment and income. All of these effects are likely to have limited defaults and foreclosures and bolstered the balance sheets of households, businesses, and financial intermediaries, leaving the system more robust.

But at times there will be tradeoffs. Low-for-long interest rates can have adverse effects on financial institutions and markets through a number of plausible channels.

After all, low interest rates are intended to encourage some risk-taking. The question is whether low rates have encouraged excessive risk-taking through the buildup of leverage or unsustainably high asset prices or through misallocation of capital. That question is particularly important today. Historically, recessions often occurred when the Fed tightened to control inflation. More recently, with inflation under control, overheating has shown up in the form of financial excess. Core PCE inflation remained close to or below 2 percent during both the late-1990s stock market bubble and the mid-2000s housing bubble that led to the financial crisis. Real short- and long-term rates were relatively high in the late-1990s, so financial excess can also arise without a low-rate environment. Nonetheless, the current extended period of very low nominal rates calls for a high degree of vigilance against the buildup of risks to the stability of the financial system.If we look at the channels listed here, the picture is mixed, but the bottom line is that there has not been an excessive buildup of leverage, maturity transformation, or broadly unsustainable asset prices.

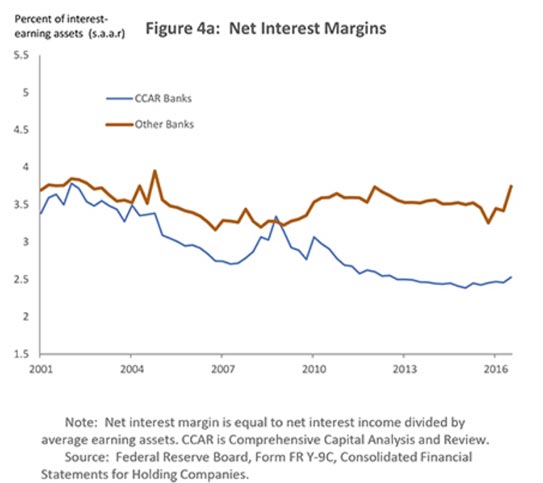
Low long-term interest rates have weighed on profitability in the financial sector, although firms have so far coped with those pressures. Net interest margins (NIMs) for most banks have held up surprisingly well. NIMs have moved down for the largest banks
Return on assets, has recovered but remains below pre-crisis levels. Life insurers have substantially underperformed the broader equity market since 2007, suggesting that investors see the low-rate environment as a drag on profitability for the industry. Even so, data on asset portfolios do not suggest that life insurers have increased risk-taking. The same is true for banks. Both the regulatory environment and banks’ own attitudes toward risk following the financial crisis have helped ensure that the largest banks have not taken on excessive credit or duration risks relative to their capital cushions.

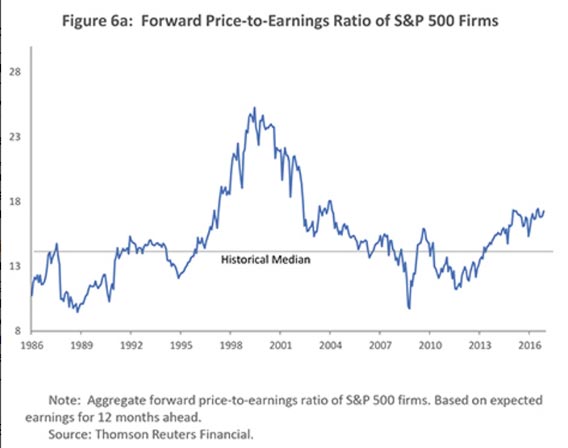
Low rates have provided support for asset valuations–indeed, that is part of their design. But I do not see valuations as significantly out of line with historical experience. Equity prices have recently increased considerably, pushing the forward price-earnings ratio further above its historical median.

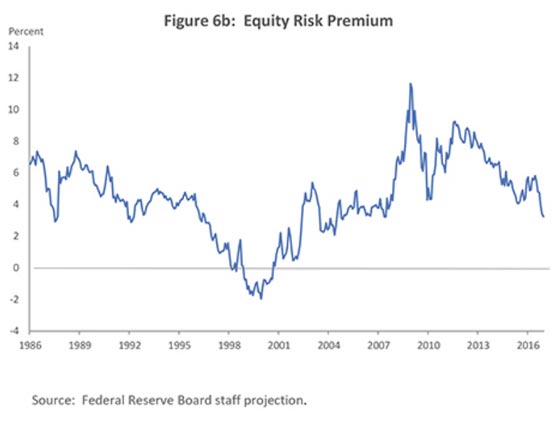
And equity premiums –the expected return above the risk-free rate for taking equity risk– have declined, but are not out of line with historical experience.

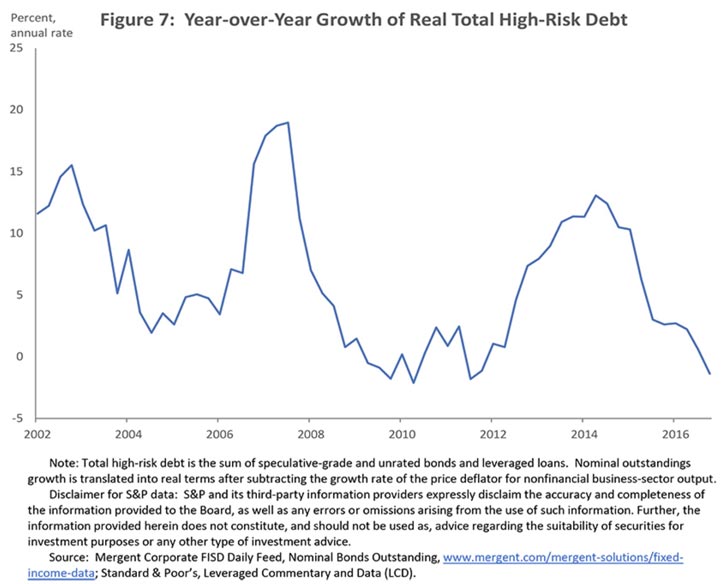
In the nonfinancial sector, valuation pressures are most concerning when leverage is high, particularly in real estate markets. Residential real estate valuations have been in line with rents and household incomes in recent years, and the ratio of mortgage debt to income is well below its pre-crisis peak and still declining. In contrast, valuations in commercial real estate are high in some markets. And in the nonfinancial corporate sector, gross leverage is high by historical standards. Low long-term rates have encouraged corporate debt issuance at the same time that some regulations, particularly the Volcker rule, have discouraged banks from holding and making markets in such debt. High-risk corporate debt (the sum of high-yield bonds and leveraged loans) grew rapidly in 2013 and 2014, although growth has declined sharply since then.

However, firms also are holding high levels of liquid assets, so net leverage is not elevated. Firms have also lengthened their maturity profiles, and interest coverage ratios are high. Greenwood and Hanson’s measure of the share of high-yield debt in overall issuance is at a relatively low level. And this debt is now held more by unlevered investors. Overall, I do not see leveraged finance markets as posing undue financial stability risks. And if risk-taking does not threaten financial stability, it is not the Fed’s job to stop people from losing (or making) money.

As I said, a mixed picture. Low interest rates have encouraged risk-taking and higher leverage in some sectors and have weighed on profitability in others, but the areas where there are signs of excess are isolated.

Why Doesn’t Capital Always Flow to High-Growth Areas?

From St. Louis Fed, On The Economy Blog.

It seems natural that capital would flow into countries with higher capital productivity and economic growth. A recent Economic Synopses essay, however, explores why capital doesn’t always flow to the highest growth regions.

The Case of Latin America and East Asia

Economist Paulina Restrepo-Echavarria and her co-authors1 used capital flows to East Asia and Latin America following World War II as an example. Economic growth and capital productivity were quite high for East Asian countries during this period, yet little investment flowed into the region.

Conversely, Latin America received substantial capital despite neither capital productivity nor economic growth being high. The authors wrote: “In fact, Latin American economic growth substantially lagged behind the economic growth of virtually all other countries in Western and Northern Europe, the Asian Tigers and North America during this period.” (For figures showing these trends, see the essay “The Direction of Capital Flows.”)

International Capital Market Imperfections

Restrepo-Echavarria and her co-authors noted two reasons why capital doesn’t always flow to high-growth areas. The first is that international capital market imperfections, such as capital controls, and other impediments to international transactions prevented capital from flowing into high-growth regions. Put another way, local controls—such as tariffs, taxes, laws and quantity restrictions—prevented or discouraged capital from flowing into these high-growth regions.

The authors explained that, under this belief, more capital would have flowed to these regions had international capital markets been more open.

Domestic Imperfections

The other possibility given by Restrepo-Echavarria and her co-authors was that domestic imperfections, specifically domestic capital market distortions, played a role in preventing inflows of capital to high-growth regions.

The authors wrote: “So, for example, for the domestic (East Asian) capital market, credit controls, interest controls, privatization of banks, entry barriers to banking, and bank reserves and requirements, among others, kept international capital from flowing into East Asia.”

International Vs. Domestic Distortions

The authors turned to their working paper, “Bad Investments and Missed Opportunities? Postwar Capital Flows to Asia and Latin America,”2 for insight to some of the economic forces driving these flows.

They found that domestic distortions played a much larger role in accounting for international capital flows, though both international and domestic imperfections played significant roles. They also found that international capital market distortions have continued to play a role despite many countries liberalizing their international capital markets over time.

Restrepo-Echavarria and her co-authors concluded: “This ongoing distortion partly reflects the legacy of accumulated international capital market distortions over time. Thus, even if international capital market imperfections are ultimately removed, their history can continue to have very large impacts into the future.”

Notes and References

1 Restrepo-Echavarria’s co-authors were Lee Ohanian of UCLA and Mark L.J. Wright of the Federal Reserve Bank of Chicago.

2 Ohanian, Lee E.; Restrepo-Echavarria, Paulina and Wright, Mark L.J. “Bad Investments and Missed Opportunities? Postwar Capital Flows to Asia and Latin America.” NBER Working Paper No. 21744, National Bureau of Economic Research, November 2015.

Additional Resources

Do Central Bankers Know a Bubble When They See One?

From Mises Wire.

Between 2000 and 2008, two of the largest financial bubbles in history — in technology stocks and housing, respectively — suffered spectacular collapses. Opinions vary, but some market commentators believe at the peak of the tech bubble, total stock market capitalization exceeded 180% of US GDP. To put this in perspective, the tech stock bubble was over twice the size of the 1920s stock bubble!1 As large as the bubble in tech stocks was, it was child’s play compared to the housing bubble. When the US housing bubble collapsed, the credit losses were so large the entire worldwide banking system was considered to be in mortal danger.

One of the primary justifications behind the 1913 founding of the Fed was to prevent financial crises. Logic then dictates if a major motivation behind forming a central bank is the prevention of a financial crisis, then a financial crisis that breaks out under the nose of a central bank must be due — at least in part — to mistakes of that bank. The Fed’s mistakes and its subsequent leading role in causing the housing bubble will be seen by reviewing speeches given by Alan Greenspan and Ben Bernanke that praised the housing bubble era Fed. In addition, a review of statements made in the wake of the tech bubble’s collapse will reveal senior Fed officials taking positions diametrically opposed to positions Alan Greenspan claimed formed the basis for the Fed’s policy toward bubbles, namely, allowing bubbles to burst and dealing with the consequences later.

From its March 2000 peak to its October 2002 bottom the NASDAQ declined 80%. Throughout the 1990s no one cheered on the “new economy” more than the “maestro,” Alan Greenspan. After the bubble collapsed, Greenspan recognized a need to explain his and the Fed’s actions while the tech bubble grew. In August 2002 Greenspan gave a speech at the Fed’s conference in Jackson Hole. In this speech, which Jim Grant called “self-exculpating revisionism,”2  Greenspan offered this rationale for the Fed’s actions during the late 1990s:

The struggle to understand developments in the economy and financial markets since the mid-1990s has been particularly challenging for monetary policymakers. … We at the Federal Reserve considered a number of issues related to asset bubbles — that is, surges in prices of assets to unsustainable levels. As events evolved, we recognized that, despite our suspicions, it was very difficult to definitively identify a bubble until after the fact — that is, when it’s bursting confirmed its existence.

Less than two years later, in January 2004, Greenspan would congratulate himself on the apparent success of the Fed’s strategy. In doing so he would expose the Fed’s role in creating the far more ruinous housing bubble.

There appears to be enough evidence, at least tentatively, to conclude that our strategy of addressing the bubble’s consequences rather than the bubble itself has been successful. … As I discuss later, much of the ability of the U.S. economy to absorb these sequences of shocks resulted from notably improved structural flexibility. But highly aggressive monetary ease was doubtless also a significant contributor to stability.3

The “monetary ease” — slashing interest rates — Greenspan was taking credit for here was not helping the economy heal. Instead it was fueling an enormous bubble in housing whose negative consequences can best be described as world-altering.

One month later, in February, Greenspan’s partner in criminal economic ignorance, Ben Bernanke, gave a speech titled, “The Great Moderation.” In this speech Bernanke would, unknowingly, provide further evidence of the Fed’s enormous role in fueling the housing bubble. Bernanke claimed the Fed’s monetary policy was a source of stability and helped to reduce variations in economic output. The irony in giving this speechat this time should not be lost. Bernanke’s speech, like Greenspan’s, betrays a total ignorance of the enormous housing bubble that was only a few weeks from peaking. (Homeownership peaked in April 2004!) With just these two speeches, the criminal incompetence of the Greenspan/Bernanke and the leading causal role the Fed played in the housing bubble are demonstrated.

The Fed’s bubble befuddlement was not limited to a few speeches. For years on end Fed officials would take positions in contradiction to those established by Greenspan in his Jackson Hole, Wyoming, speech. For example, in July 2005 and in his capacity as head of the president’s council of economic advisors, Ben Bernanke was asked on CNBC if there was a housing bubble. He does not answer by saying bubbles can’t be seen until after they burst. Instead he says the following:

Well, I guess I don’t buy your premise. It’s a pretty unlikely possibility. We’ve never had a decline in housing prices on a nationwide basis, so what I think is more likely is house prices will slow, maybe stabilize, might slow consumption spending a bit. I don’t think it will drive the economy from its full employment path.

Later in October 2005, other Fed officials would also contradict Greenspan’s Jackson Hole speech. By then, homeownership had already peaked and the bubble had started to collapse. Amazingly,  two Fed economists investigated if there was a housing bubble. They — erroneously, of course — concluded home prices are high but not out of line.4 Obviously, if Fed officials were investigating to see if a housing bubble existed, then they believed it could be observed without first having to collapse.

Often, the most damning indictments of the bubble-era Fed come from other Fed officials. The most loquacious of these officials is current St. Louis Fed president James Bullard. Among the truths Bullard accidently exposed was the one concerning the obvious nature of the recent stock and housing bubbles. In a September 2013 interview Bullard said, The bubbles we had in the past were gigantic and obvious.5 Later, in a November 2013 interview, he said the housing and tech bubbles were blindingly obvious.”6

Amazingly, Alan Greenspan would eventually completely contradict Greenspan! Here is “Mr. Chairman,” as CNBC lovingly refers to him, discussing the Lehman Brothers failure in October 2013, “We missed the timing badly on September 15th, 2008 [the day Lehman Brothers went bankrupt]. All of us knew there was a bubble.”7 So which is it Mr. Chairman? Can bubbles be “obvious” or something “everyone knew” to exist before they pop — as you indicate here — or do you have to wait until after they pop to confirm their existence as you said in Jackson Hole?

Our brief review here demonstrates both the leading role the Fed played in creating the housing bubble — the January and February 2004 speeches — and the many mutually exclusive positions the Fed took on bubbles. In spite of being exposed in what is either a self-exculpating lie (the claim that bubbles can only be seen after they burst) or a sign of gross incompetence (the failure to see two of the largest financial bubbles in history), no Fed official has ever been asked to explain or rationalize the Fed’s contradictory positions on bubbles. Whether anyone from the Fed is ever forced to do so or not, it is obvious the Fed has much to answer for concerning all the economic hardships their bubble befuddlement has caused.

  • 1. Marc Faber, “The Monetization of the American Economy,” DailyReckoning.com, January 16, 2002 https://dailyreckoning.com/the-monetisation-of-the-american-economy/
  • 2. Jim Grant, Mr. Market Miscalculates (Mt. Jackson, Va.: Axios Press, 2008), pp. 241.
  • 3. “Risk and Uncertainty in Monetary Policy”, Remarks by Chairman Alan Greenspan at the Meetings of the American Economic Association, San Diego, California, January 03, 2004.
  • 4. Jonathan McCarthy and Richard W. Peach, “Is there a Bubble in the Housing Market Now?” Federal Reserve Bank of New York, 2005.
  • 5. Steven C. Johnson, “Fed Need Not Rush to Taper While Inflation is Low,” September 20, 2013, CNBC, http://www.cnbc.com/id/101051526/
  • 6. Matthew J. Belvedere, “Fed’s Bullard: $1-trillion a year QE pace torrid,” CNBC, http://www.cnbc.com/id/101166475
  • 7. Matthew J. Belvedere, “Bubbles and leverage cause crisis: Alan Greenspan,” October 23, 2013 CNBC, http://www.cnbc.com/id/101135835