The Problem With Reference Benchmark Rates

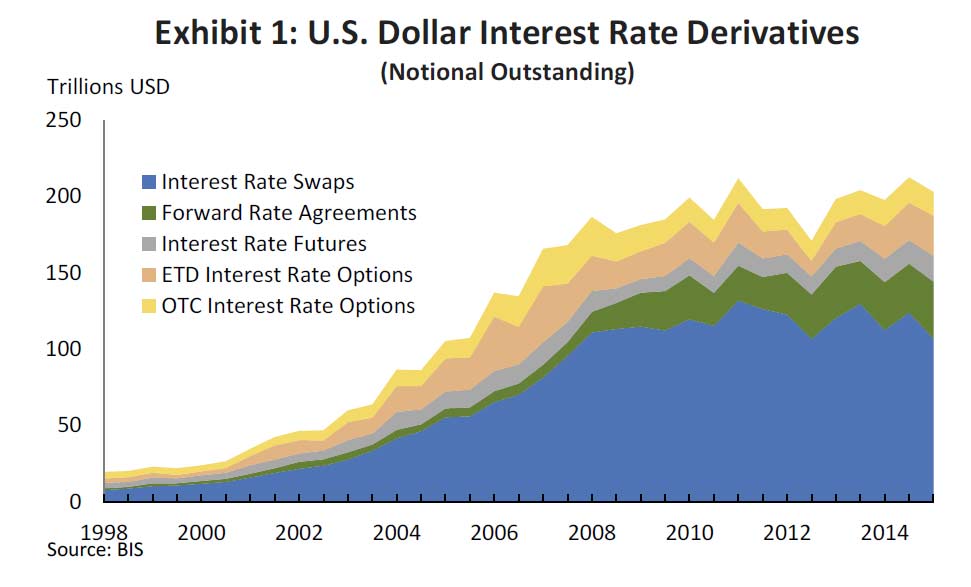
A host of factors have put critical financial market benchmark rates such as LIBOR or BBSW under the spotlight. Can we trust them? It has been suggested that some banks have been rate rigging – for example in Australia, ASIC has commenced proceedings against some of our largest banks and there is debate about an alternative and more robust benchmark. So, an interesting speech by FED Governor Jerome H. Powell at the Roundtable on the Interim Report of the Alternative Reference Rates Committee sponsored by the Federal Reserve Board and the Federal Reserve Bank of New York looking at LIBOR is highly relevant.  They just issued an interim report which shows that US Dollar Interest Rate Derivatives account for about US$200 trillion, with more than half in interest rate swaps, so small tweaks to the benchmark rate can yield big profits to the industry.

US-Rate-Derivitives

I want to thank the Alternative Reference Rates Committee (ARRC) for all its work in developing its interim report. This report marks a new stage in reference rate reform.1 Reference benchmarks are a key part of the financial infrastructure. About $300 trillion dollars in contracts reference LIBOR alone. But benchmarks were not given much consideration prior to the recent scandals involving attempts to manipulate them. Since then, the official sector has thought seriously about financial benchmarks, conducting a number of investigations into charges of manipulation, publishing the International Organization of Securities Commission’s (IOSCO) Principles for Financial Benchmarks and, through the Financial Stability Board (FSB), sponsoring major reform efforts of both interest rate and foreign exchange benchmarks.2 The institutions represented on the ARRC have also had to think seriously about these issues as they have developed this interim report. Now, we need end users to begin to think more seriously about how they use benchmarks and the risks they are taking on by relying so heavily on a reference rate–in this case U.S. dollar LIBOR–that is less resilient than it needs to be.

In saying this, I want to make it clear that LIBOR has been significantly improved. ICE Benchmark Administration is in the process of making important changes to its methodology, and submissions to LIBOR are now regulated by the United Kingdom’s Financial Conduct Authority. However, the term money market borrowing by banks that underlies U.S. dollar LIBOR has experienced a secular decline. As a result, the majority of U.S. dollar LIBOR submissions must still rely on expert judgement, and even those submissions that are transaction-based may be based on relatively few actual trades. This calls into question whether LIBOR can ultimately satisfy IOSCO Principle 7 regarding data sufficiency, which requires that a benchmark be based on an active market. That Principle is a particularly important one, as it is difficult to ask banks to submit rates at which they believe they could borrow on a daily basis if they do not actually borrow very often.

That basic fact poses the risk that LIBOR could eventually be forced to stop publication entirely. Ongoing regulatory reforms and changing market structures raise questions about whether the transactions underlying LIBOR will become even scarcer in the future, particularly in periods of stress, and banks might feel little incentive to contribute to U.S. dollar LIBOR panels if transactions become less frequent. Market participants are not used to thinking about this possibility, but benchmarks sometimes come to a halt. The sudden cessation of a benchmark as heavily used as LIBOR would present significant systemic risks. It could entail substantial losses and would create substantial uncertainty, potential legal challenges, and payments disruptions for the market participants that have relied on LIBOR. These disruptions would be even greater if there were no viable alternative to U.S. dollar LIBOR that market participants could quickly move to.

These concerns led the FSB and Financial Stability Oversight Council to call for the promotion of alternatives to LIBOR, and led the Federal Reserve to convene the ARRC in cooperation with the U.S. Treasury Department, U.S. Commodity Futures Trading Commission, and Office of Financial Research. LIBOR is currently the dominant reference rate in the market because of its liquidity. We are not under any illusions that moving a significant portion of trading to an alternative rate will be simple or easy. But I believe the ARRC has provided a workable and credible plan for creating liquidity in a new rate and beginning the process of moving trading to it.

We need input from end users and others to finalize the ARRC’s plans, and I look forward to hearing the views of those in attendance. Successful implementation will require a coordinated effort from a broad set of market participants. This effort will certainly entail costs, but continued reliance on U.S. dollar LIBOR on the current scale could entail much higher costs if unsecured short-term borrowing declines further and submitting banks choose to leave the LIBOR panels, especially if there were no viable alternative rate. Simply put, this effort is something that needs to happen, and if the ARRC members, the official sector, and end users and other market participants all jointly coordinate in finalizing these plans, then a successful transition can be made with the least disruption to the market, leaving everyone in a better place.


1. See Alternative Reference Rates Committee (2016), Interim Report and Consultation (PDF) Leaving the Board (New York: ARRC, May).

2. For more information on the IOSCO principles, see Board of the International Organization of Securities Commissions (2013), Principles for Financial Benchmarks: Final Report (PDF) Leaving the Board (Madrid: IOSCO, July).


Credit Card Debt over the Life-cycle

Excellent analysis from the FED, looking at credit card debt in the US. Total credit card debt is down, because individuals younger than 46 deleveraged the most after the financial crisis of 2008.

Eggertsson and Krugman (2012) contend that “if there is a single word that appears most frequently in discussions of the economic problems now afflicting both the United States and Europe, that word is surely debt.” These authors and others offer theoretical models that present the debt phenomenon as follows: The economy is populated by impatient and patient individuals. Impatient individuals borrow as much as possible, up to a debt limit. When the debt limit suddenly tightens, impatient individuals must cut expenditures to pay their debt, depressing aggregate demand and generating debt-driven slumps. Such a reduction in debt is called deleveraging.

The evolution of total credit card debt around the financial crisis of 2008 appears consistent with that sequence: Credit card debt increased quickly before the financial crisis and then fell for six years after that episode. Although credit card debt began to rise again in 2015, the total remains 20 percent below its 2009 peak. In this essay, we analyze credit card debt by borrower age group for the 2004-08 and 2008-15 periods to determine whether the sequence of events holds at the micro (household) level.

The data used are from the Federal Reserve Bank of New York Consumer Credit Panel/Equifax. The first figure shows total credit card debt1 of individuals 20 to 70 years of age. Credit card debt increased by approximately $114 billion in the 2004-08 period, peaked in 2009, and then decreased by over $193 billion in the 2008-15 period.2

To better understand how individual credit card debt changed over the two periods, we calculate the share each age group contributed to the total changes. The results are presented in the second figure. In the 2004-08 period, credit card balances increased across all age groups. Most of the increase—almost 50 percent—however, was driven by individuals 56 years of age and older. Remarkably, individuals younger than 46 years of age, who arguably need to borrow the most, accounted for only 25 percent of the increase in total debt.

Deleveraging of credit card debt after the financial crisis of 2008 continued until 2015. Importantly, in clear contrast with the pre-crisis period (2004-08) when older individuals increased their credit card debt the most, younger individuals reduced theirs the most during the post-crisis (2008-15) period. Individuals 56 years of age and older accounted for virtually none of the decrease in credit card debt. For individuals 66 to 70, credit card debt actually increased. Strikingly, individuals younger than 46 accounted for 68 percent of the deleveraging.

These findings suggest that although the evolution of credit card debt at the aggregate level is consistent with the sequence of events described by Eggertsson and Krugman (2012), changes at the individual level are not. In particular, younger individuals—who contributed little to the pre-crises expansion of credit—deleveraged the most.

What accounts for the deleveraging by younger individuals? After the crisis, younger individuals, with arguably poor job prospects, decreased their debt and increased their savings. The deterioration of job prospects is well documented by Moscarini and Postel-Vinay (2016), who named it “the failure of the job ladder.” The deterioration of jobs prospects, however, would not have affected older individuals, who had arguably already climbed the job ladder and thus did not need to deleverage. Thus, labor market changes may have caused the deleveraging. And what explains the period of credit expansion? It’s possible that the relaxation of credit limits played a role. Of course, more evidence is needed to determine the accuracy of these possible explanations. Identifying the real factors that caused the deleveraging is important because policy recommendations may depend crucially on them.

Notes

1 The Equifax credit-reporting data include a nationally representative 5 percent sample of all adults with a Social Security number and a credit report. The credit card debt is called “bankcard” debt in the dataset. Since consumer credit profiles are recorded at the end of each quarter, credit card debt is not revolving.

2 Notice that the total differs from that of the United States because the data used here include only a sample of individuals. Actually, we use a subsample of the Federal Reserve Bank of New York Consumer Credit Panel/Equifax data.

Fed Holds Rate

The US Federal Reserve has kept rates on hold this month, because inflation remains below target, and some other economic indicators are slowing. Here is their announcement.

Information received since the Federal Open Market Committee met in April indicates that the pace of improvement in the labor market has slowed while growth in economic activity appears to have picked up. Although the unemployment rate has declined, job gains have diminished. Growth in household spending has strengthened. Since the beginning of the year, the housing sector has continued to improve and the drag from net exports appears to have lessened, but business fixed investment has been soft. Inflation has continued to run below the Committee’s 2 percent longer-run objective, partly reflecting earlier declines in energy prices and in prices of non-energy imports. Market-based measures of inflation compensation declined; most survey-based measures of longer-term inflation expectations are little changed, on balance, in recent months.

Consistent with its statutory mandate, the Committee seeks to foster maximum employment and price stability. The Committee currently expects that, with gradual adjustments in the stance of monetary policy, economic activity will expand at a moderate pace and labor market indicators will strengthen. Inflation is expected to remain low in the near term, in part because of earlier declines in energy prices, but to rise to 2 percent over the medium term as the transitory effects of past declines in energy and import prices dissipate and the labor market strengthens further. The Committee continues to closely monitor inflation indicators and global economic and financial developments.

Against this backdrop, the Committee decided to maintain the target range for the federal funds rate at 1/4 to 1/2 percent. The stance of monetary policy remains accommodative, thereby supporting further improvement in labor market conditions and a return to 2 percent inflation.

In determining the timing and size of future adjustments to the target range for the federal funds rate, the Committee will assess realized and expected economic conditions relative to its objectives of maximum employment and 2 percent inflation. This assessment will take into account a wide range of information, including measures of labor market conditions, indicators of inflation pressures and inflation expectations, and readings on financial and international developments. In light of the current shortfall of inflation from 2 percent, the Committee will carefully monitor actual and expected progress toward its inflation goal. The Committee expects that economic conditions will evolve in a manner that will warrant only gradual increases in the federal funds rate; the federal funds rate is likely to remain, for some time, below levels that are expected to prevail in the longer run. However, the actual path of the federal funds rate will depend on the economic outlook as informed by incoming data.

The Committee is maintaining its existing policy of reinvesting principal payments from its holdings of agency debt and agency mortgage-backed securities in agency mortgage-backed securities and of rolling over maturing Treasury securities at auction, and it anticipates doing so until normalization of the level of the federal funds rate is well under way. This policy, by keeping the Committee’s holdings of longer-term securities at sizable levels, should help maintain accommodative financial conditions.

Fed Still Thinks Policy Rate Will Rise – Over Time

Fed Chair Yellen’s latest speech confirms that rate rises are still on the cards, at some point despite the latest poor jobs data. But is the markedly reduced pace of hiring in April and May a harbinger of a persistent slowdown in the broader economy?

Let me now turn to the implications of the economic outlook, as well as the uncertainties associated with that outlook, for monetary policy. My overall assessment is that the current stance of monetary policy is generally appropriate, in that it is providing support to the economy by encouraging further labor market improvement that will help return inflation to 2 percent. At the same time, I continue to think that the federal funds rate will probably need to rise gradually over time to ensure price stability and maximum sustainable employment in the longer run.

Several considerations lead me to this conclusion. First, the current stance of monetary policy is stimulative, although perhaps not as stimulative as might appear at first glance. One useful measure of the stance of policy is the deviation of the federal funds rate from a “neutral” value, defined as the level of the federal funds rate that would be neither expansionary nor contractionary if the economy was operating near potential. This neutral rate changes over time, and, at any given date, it depends on a constellation of underlying forces affecting the economy. At present, many estimates show the neutral rate to be quite low by historical standards–indeed, close to zero when measured in real, or inflation-adjusted, terms.13 The current actual value of the federal funds rate, also measured in real terms, is even lower, somewhere around minus 1 percent. With the actual real federal funds rate modestly below the relatively low neutral real rate, the stance of monetary policy at present should be viewed as modestly accommodative.

Although the economy is now fairly close to the FOMC’s goal of maximum employment, I view our modestly accommodative stance of policy as appropriate for several reasons. First, with inflation continuing to run below our objective, a mild undershooting of the unemployment rate considered to be normal in the longer run could help move inflation back up to 2 percent more quickly. Second, a stronger job market could also support labor market improvement along other dimensions, including greater labor force participation. A third reason relates to the risks associated with the constraint on conventional monetary policy when the federal funds rate is near zero. If inflation were to move persistently above 2 percent or the economy were to become notably overheated, the Committee could readily increase the target range for the federal funds rate. However, if inflation were to remain persistently low or the expansion were to falter, the FOMC would be able to provide only a limited amount of additional stimulus through conventional means.

These motivations notwithstanding, I continue to believe that it will be appropriate to gradually reduce the degree of monetary policy accommodation, provided that labor market conditions strengthen further and inflation continues to make progress toward our 2 percent objective. Because monetary policy affects the economy with a lag, steps to withdraw this monetary accommodation ought to be initiated before the FOMC’s goals are fully reached. And if the headwinds that have lingered since the crisis slowly abate as I anticipate, this would mean that the neutral rate of interest itself will move up, providing further impetus to gradually increase the federal funds rate. But I stress that the economic outlook, including the pace at which the neutral rate may shift over time, is uncertain, so monetary policy cannot proceed on any preset path.

This point is well illustrated by events so far this year. For a time in January and early February, financial markets here and abroad became turbulent and financial conditions tightened, reflecting and reinforcing concerns about downside risks to the global economy. In addition, data received during the winter suggested that U.S. growth had weakened even as progress in the labor market remained solid. Because the implications of these developments for the economic outlook were unclear, the FOMC decided at its January, March, and April meetings that it would be prudent to maintain the existing target range for the federal funds rate.

Over the past few months, financial conditions have recovered significantly and many of the risks from abroad have diminished, although some risks remain. In addition, consumer spending appears to have rebounded, providing some reassurance that overall growth has indeed picked up as expected. Unfortunately, as I noted earlier, new questions about the economic outlook have been raised by the recent labor market data. Is the markedly reduced pace of hiring in April and May a harbinger of a persistent slowdown in the broader economy? Or will monthly payroll gains move up toward the solid pace they maintained earlier this year and in 2015? Does the latest reading on the unemployment rate indicate that we are essentially back to full employment, or does relatively subdued wage growth signal that more slack remains? My colleagues and I will be wrestling with these and other related questions going forward.

Many US Families Struggle Financially

American families overall reported continued mild improvement in their financial well-being in 2015 although many families were struggling financially and felt excluded from economic advancement, according to the Federal Reserve Board’s latest Report on the Economic Well-Being of U.S. Households.

The report, based on the Board’s third annual Survey of Household Economics and Decisionmaking, presents a contrasting picture of the financial well-being of U.S. families. Aggregate-level results show several signs of improvement. Sixty-nine percent of respondents said they are either “living comfortably” or “doing okay,” up 4 percentage points from 2014 and up 6 percentage points from 2013. Seventy-seven percent of non-retired adults without a disability are confident that they have the skills necessary to get the kind of job that they want now–an increase of 10 percentage points from the 2013 survey results.

“The new survey findings shed important light on the economic and financial security of American families seven years into the recovery,” said Federal Reserve Board Governor Lael Brainard. “Despite some signs of improvement overall, 46 percent say they would struggle to meet emergency expenses of $400, and 22 percent of workers say they are juggling two or more jobs. It’s important to identify the reasons why so many families face continued financial struggles and to find ways to help them overcome them,” she said.

The survey results also emphasize that not all groups report improvement in their financial well-being. Respondents with higher levels of education are most likely to say that their financial situation has improved over the past year. Thirty-one percent of respondents with at least a bachelor’s degree reported an improvement in 2015 and 15 percent reported a decline. Among those with a high-school degree or less, 22 percent of respondents say that their well-being improved over the past 12 months, while 21 percent say that their well-being has declined.

The survey found that individuals with lower incomes, racial and ethnic minorities, and individuals with parents of modest financial means report greater financial challenges. Forty-three percent of adults with a family income under $40,000 do not have a bank account or use an alternative financial service; non-Hispanic blacks are 19 percentage points less likely to be satisfied with the overall quality of their neighborhood than are non-Hispanic whites; and young adults whose parents did not attend college are 48 percentage points less likely to attend college–and more likely to attend a for-profit institution if they do–than are those whose parents have a bachelor’s degree.

Educational satisfaction differed significantly by the type of institution attended. Forty-nine percent of adults who attended a for-profit institution report that if they could make their educational decisions again they would have attended a different school.

Among individuals who went to college, education debt is common. More than half of adults younger than 30 who went to college took on at least some debt to do so. This debt extends beyond just student loans. Twenty-one percent of all adults with debt from their own education have education-related credit card debt, with a median balance of $3,000.

The survey also provide insights into saving for retirement. Thirty-one percent of non-retired respondents have no retirement savings or pension. Among those who have a defined contribution pension plan or other self-directed retirement account, 49 percent are either “not confident” or just “slightly confident” in their ability to make the right investment decisions in these accounts.

Previous surveys have informed the Federal Reserve and other government agencies about consumer financial behavior and opinions. The survey was conducted on behalf of the Board in October and November 2015. More than 5,600 respondents completed the survey. Topics covered in the survey and the report include savings behavior, economic preparedness, banking and credit access, housing and living arrangements, auto lending, education and student debt, and retirement planning.

Here is a link to a video summarizing the survey’s findings.

Are Rising Stock Prices Related to Income Inequality?

From The St. Louis Fed Economy Blog.

Income inequality in the U.S. started to increase in the 1970s, and stock market gains accompanied this increase, according to a recent Economic Synopses essay.

Assistant Vice President and Economist Michael Owyang and Senior Research Associate Hannah Shell noted that increases in stock prices and capital returns may benefit the wealthy more than others, as they have better access to markets. They wrote: “Thus, as stock prices and capital returns increase, the wealthy might benefit more than other individuals earning income from labor.”

The figure below shows stock prices (as measured by the S&P 500 Index) along with the Gini coefficient, which represents a measure of income inequality. (A Gini coefficient of 0 means incomes are perfectly equal, and a coefficient of 1 means incomes are perfectly unequal.)

the correlation of stock prices and income inequality

The authors pointed out that inequality began to rise in the 1970s. The Congressional Budget Office estimated that between 1979 and 2011:

  • Market income grew an average of 16 percent in the bottom four quintiles.
  • It grew 56 percent for the 81st through 99th percentiles.
  • However, it grew 174 percent for the top 1 percent.

Regarding stock returns, the S&P 500 Index grew from 92 in 1977 to over 1,476 in 2007. By comparison, it grew only 50 percent in the 30 years prior. The authors noted: “As stock prices rise, the gains are disproportionately distributed to the wealthy. Lower- and middle-income families who are also wealth-poor are less likely to expose their savings to the higher risks of equity markets.”

Owyang and Shell concluded: “The increase in income inequality in the 1970s was accompanied, in part, by gains in the stock market. Comovement between stock prices and income inequality results from the fact that gains in the stock market tend to benefit those in the wealthiest portion of the income distribution, who have better access to and higher participation in these asset markets.”

Negative Interest Rates: A Tax in Sheep’s Clothing

Negative interest rates are taxes in sheep’s clothing. Few economists would ever claim that raising taxes on households will stimulate spending. So why would they think negative interest rates will?

From St Louis Fed Blog.

If you pick up any principles of economics textbook, there will typically be a discussion of taxes and tax incidence. Tax incidence describes who bears the burden of a tax. For example, suppose the government levies a payroll tax on a firm. The burden of the tax may be borne by the firm, the workers or the firm’s customers.

How can this be if the firm is responsible for paying the tax? The firm may bear the burden of the tax by accepting lower after-tax profits. However, the firm can pass the tax onto its workers by paying them lower wages or hiring fewer workers. The firm can also pass the tax onto its customers by charging them a higher price for the firm’s output. In general, all parties bear some portion of the tax.

Similarities to Taxes on Banks

This logic also applies to a tax levied on banks. Banks hire inputs (in this case, deposits), which are used to produce output (loans). The bank charges a price for its output (the interest rate on the loan) and pays wages to its inputs (the interest rate on deposits).

The spread between the loan rate and the deposit rate determines the profit margin for the firm on a loan (ignoring default costs and other costs for ease of exposition). So any tax imposed on banks will be borne by the bank, the depositors and/or the borrowers. The firm can bear the burden of the tax by accepting lower profits. However, the bank can also pass the tax onto depositors by paying a lower interest rate on deposits and/or pass the tax onto borrowers by charging them a higher interest rate on loans.

Negative Interest Rates

This brings us to negative interest rates. Many foreign central banks—such as the European Central Bank, the Bank of Japan and the Swiss National Bank—have implemented negative interest rates on bank reserves as a policy tool to stimulate demand for goods and services. If a bank holds a dollar of reserves, the central bank may take, say, half a cent.

The hope is that a negative interest rate will induce firms to lend out the reserves by charging a lower interest rate on loans. In short, “use it or lose it.” More lending would stimulate spending on goods and services, which would lead to higher output and upward pressure on inflation.

A Tax on Reserves

But a negative interest rate is just a tax on the banks’ reserves. The tax has to be borne by someone:

  • The banks can choose not to pass it on and just have lower after-tax profits. This will depress the share price of banks and weaken their balance sheets by having lower equity values.
  • The banks can pass the tax onto depositors by paying a lower interest rate on deposits or charging them fees for holding the deposits. In either case, depositors have less income to spend on goods and services.
  • The bank can pass the tax onto borrowers by charging them a higher interest rate on a loan or higher fees for processing the loan. In either case, it is more costly to finance purchases of goods and services by borrowing.

None of this sounds very “stimulative” for consumer spending. But then, no tax ever is.

Negative Interest Rates in Other Countries

What has happened so far in countries that have tried negative interest rates? The figures below provide answers. As seen in the first chart, bank stock prices have definitely taken a hit. After initially continuing their downward trends, interest rates on mortgages have now risen in Germany and Switzerland (the second chart). Banks have been very reluctant to charge negative deposit rates for fear of a backlash from customers (the third chart).

At the end of the day, negative interest rates are taxes in sheep’s clothing. Few economists would ever claim that raising taxes on households will stimulate spending. So why would they think negative interest rates will?

NegRatesBankStockDecline

MortgageRates

HouseholdDepRates

Distributed Ledger Technologies in Payment, Clearing, and Settlement

Fed Governor Lael Brainard spoke about emerging distributed ledger technologies at the Institute of International Finance Blockchain Roundtable, Washington. She said today, many industry participants are experimenting with distributed ledger technology. She warned it will be important to address the challenge of how they would scale and achieve diffusion and how the different distributed ledger technologies interoperate with each other, and legacy systems.

She said new and highly fragmented “shared systems” may create unintended consequences even as they aim to address problems created by today’s siloed operations. Since distributed ledgers often involve shared databases, it will also be important to effectively manage access rights as information flows back and forth through shared systems.

It may require a trade-off between the privacy of trading partners and competitors on the one hand, and the ability to leverage shared transactions records for faster and cheaper settlement on the other hand.

Sound risk-management, resiliency, and recovery procedures will be necessary to address operational risks.

Financial products, services, and transactions lend themselves to successive waves of technological disruption because they can readily be represented as streams of numerical information ripe for digitization. However, as technological tools used by the industry change over time, it is important to keep sight of their impact on the public, whether it be on families seeking to own their own home, seniors seeking financial security, young adults seeking to invest in education and training, or small businesses attempting to smooth through volatile revenues and expenses.

Current developments in the digitization of finance are important and deserving of serious and sustained engagement on the part of policymakers and regulators. The Federal Reserve Board has established a multi-disciplinary working group that is engaged in a 360-degree analysis of fintech innovation. We are bringing together the best thinking across the Federal Reserve System, spanning key areas of responsibility, from supervision to community development, from financial stability to payments. As policymakers, we want to facilitate innovation where it has the potential to yield public benefit, while ensuring that risks are thoroughly understood and managed. That orientation may have different implications in the arena of consumer and small business finance, for instance, as compared with payment, clearing, and settlement in the wholesale financial markets.

Today, I will focus on newly emerging distributed ledger technologies and related protocols, which were inspired originally by Bitcoin, and their potentially important applications to payment, clearing, and settlement in the wholesale markets.

Successive waves of technological advance have swept through payment, clearing, and settlement over the past two centuries. In the 19th century, railroads and the telegraph helped improve speed and logistics. In the second half of the 20th century, computers were introduced to deal with the clearing of overwhelming volumes of paper checks and stock certificates stimulated by post-war growth. Starting at about the same time and continuing through today, new electronic networks have been established to allow high-speed computerized financial communication. As automation has evolved, payment, clearing, and settlement systems have been developed for conducting and processing transactions within and between firms. However, many of these systems have historically operated in silos, which can be hard to streamline or replace. In some areas, business processes may still rely heavily on manual or semi-automated procedures.

Over time, banks and other firms have organized various types of clearinghouses to coordinate clearing and settlement activities in order to reduce costs and risks. The adoption of multilateral clearing in the United States was a key organizational innovation that began with the founding of the New York Clearing House in the 1850s. This led to notable efficiencies and risk reduction in the clearing of checks. Multilateral clearing was also used early on to improve clearing in the securities and derivatives markets. By the 1970s, the United States turned to technologies based on the centralized custody and clearing of book-entry securities in order to respond to the paperwork crisis in the equities markets. Following the recent financial crisis, the United States–along with many other countries–expanded the scope of central clearing to help address problems in the bilateral clearing of derivatives contracts.

Today, the possible development and application of distributed ledger technology has raised questions about potentially far reaching changes to multilateral clearinghouses and the roles of financial institutions as intermediaries in trading, clearing, and settlement for their clients. In the extreme, distributed ledger technologies are seen as enabling a much larger universe of financial actors to transact directly with other financial actors and to exchange assets versus funds (that is, to “clear” and settle the underlying transactions) virtually instantaneously without the help of intermediaries both within and across borders. This dramatic reduction in frictions would be facilitated by distributed ledgers shared across various networks of financial actors that would keep a complete and accurate record of all transactions, and meet appropriate goals for transparency, privacy, and security.

At this stage, such a sea-change may sound like a remote possibility, particularly for the high volume and highly regulated clearing and settlement functions of the wholesale financial markets. But profound disruptions are not unprecedented in this arena. In the early 1960s, the use of computerized book-entry securities systems to streamline custody, clearing, and settlement in the securities markets may have seemed like a technologist’s pipe dream. But these technologies became an important part of industry-wide changes in the 1970s. Today we rely on these types of systems for the daily operation of the markets.

Given this backdrop, it is important to give promising technologies the serious consideration they merit, seek to understand their opportunities and risks, and actively engage in dialogue about their potential uses and evolution. At the Federal Reserve, we approach these issues from the perspective of policymakers safeguarding the public interest in safe and sound core banking institutions, financial stability, particularly as it pertains to the wholesale financial markets, and the security and efficiency of the payment system.

Distributed ledger technology was introduced for the transfer and record-keeping of Bitcoin and other digital currencies. The essential advantage of the technology is that it provides a credible way to transfer an asset without the need for trust in intermediaries or counterparties, much like a physical cash transaction. To do that, a transfer process must be able to credibly confirm that a sender of an asset is the owner and has enough of the asset to make the transfer to the receiver. This requires a secure system or protocol to transfer assets (the rails), protection against assets being transferred twice (the so-called double spend problem), and an immutable record of asset ownership that can be automatically and securely updated (the ledger). The tokenization of digital assets can facilitate the transfer process.

The genuinely innovative aspect of the technology combines a number of different core elements that support the transfer process and recordkeeping:

  • Peer-to-peer networking and distributed data storage provide multiple copies of a single ledger across participants in the system so that all participants have a shared history of all transactions in the system.
  • Cryptography, in the form of hashes and digital signatures, provides a secure way to initiate a transaction that helps verify ownership and the availability of the asset for transfer.
  • Consensus algorithms provide a process for transactions to be confirmed and added to the single ledger.

While Bitcoin was originally associated with the concept of a universally available, publicly shared digital ledger technology without any central authority, many of the use cases that are currently under development and discussion rely on “permissioned” ledgers in which only permitted, known participants can validate transactions. These in turn can be either public or private in terms of access to the ledger.

The resulting Internet of Value holds out the promise of addressing important frictions and reducing intermediation steps in the clearing and settlement process. For example, in cross-border payments, faster processing and reduced costs relative to current correspondent banking are cited as specific potential benefits. Reducing intermediation steps in cross-border payments may help reduce costs and counterparty risks and may additionally improve financial transparency.

In securities clearing and settlement, the potential shift to one master record shared among participants has some appeal. Having one immutable record may have the potential to reduce or even eliminate the need for reconciliation by avoiding duplicative records that have different details related to a transaction that is being cleared and settled. This also can lead to greater transparency, reduced costs, and faster securities settlement. Likewise, digital ledgers may improve collateral management by improving the tracking of ownership and transactions.

For derivatives, there is interest in the potential for digital ledger protocols to enable self-execution and possibly self-enforcement of contractual clauses, in the context of “smart contracts.”

As we engage with industry and stakeholders to assess the potential applications of digital ledger and related technologies in the payment, clearing, and settlement arena, we will be guided by the principles of efficiency, safety and integrity, and financial stability.

I want to close by remembering a simple point that central bankers and markets have learned through hard lessons over many years. The daily operation of markets and their clearing and settlement functions are built on trust and confidence. Market participants trust that clearing and settlement functions and institutions will work properly every day. Confidence has built over time that when market participants trade, accurate and timely clearing and settlement will follow. Any disruption to this confidence comes at great cost to market integrity and financial stability. This is a matter of fundamental public interest. In safeguarding the public interest, the first line of inquiry and protection will always rest with those closest to the technology innovations and to the organizations that consider adopting the technology. But regulators also should seek to analyze the implications of technology developments through constructive and timely engagement. We should be attentive to the potential benefits of these new technologies, and prepared to make the necessary regulatory adjustments if their safety and integrity is proven and their potential benefits found to be in the public interest.

US Mobile Banking Trends Updated

Mobile banking use continued to rise last year as smartphone adoption grew and consumers were increasingly drawn to the convenience of mobile financial services, according to a US Federal Reserve Board report, Consumers and Mobile Financial Services 2016, released on Wednesday.

The report documents consumers’ use of mobile phones–Internet-enabled smartphones as well as more basic phones with limited features–as they bank and carry out financial activities. It is the Board’s fifth annual look at how consumers use mobile phones to access banking services (“mobile banking”), make payments, transfer money, or pay for goods and services (“mobile payments”), and inform financial decisions, as well as their reasons for using these services.

As of November 2015, 43 percent of adults with mobile phones and bank accounts reported using mobile banking–an increase of 4 percentage points from the prior year’s survey. The most common way that consumers use mobile banking is checking their account balances or recent transactions, followed by transferring money between accounts. More than half of mobile banking users received an alert from their financial institution through a text message, push notification, or e-mail–making this the third most common use of mobile banking.

For those who have adopted mobile banking, use of a mobile phone appears to complement their use of other banking channels. Among mobile banking users with smartphones, 54 percent cited the mobile channel as one of the three most important ways they interact with their bank. This share is below those that cited online (65 percent) and ATM (62 percent) as most important, but slightly above the share that cited a teller at a branch (51 percent).

Use of mobile payments continues to be less common than use of mobile banking. Twenty-four percent of all mobile phone users, and 28 percent of smartphone users, made a mobile payment in the 12 months prior to the survey. For smartphone owners who reported making payments with their phones, the most common types of mobile payments were paying bills, purchasing a physical item or digital content remotely, and paying for something in a store.

Use of mobile financial services varies across demographic groups. For particular groups of respondents to the 2015 survey–such as younger adults, Hispanics and non-Hispanic blacks–the shares who reported using mobile banking and mobile payments were higher than the overall survey averages. Smartphone ownership among those with mobile phones is higher for Hispanics than for non-Hispanic whites in this survey.

Consistent with findings from prior years, a majority of consumers using mobile banking and mobile payments cite convenience or getting a smartphone as their main reason for adoption. The main impediments to the adoption of mobile financial services continue to be a stated preference for other methods of banking and making payments, as well as concerns about security.

Concerns about the security and privacy of personal information continue to be expressed by mobile phone users, and the majority of smartphone users reported taking actions that can reduce harm in case of a security incident. The most common actions were installing updates, password-protecting the phone, and customizing privacy settings.

The survey was conducted on behalf of the Board by GfK, an online consumer research firm. The 2015 survey was conducted from November 4-23, 2015. More than 2,500 respondents completed the survey.

Previous surveys have informed the Federal Reserve and other parts of the government on consumer banking and payment behavior and have supported basic research and public discussion.

The 2016 report and a video summarizing the survey’s mobile financial services findings may be found at: http://www.federalreserve.gov/communitydev/mobile_finance.htm.

Fed Says Future Rate Hikes Will Be Gradual

Chair Janet L. Yellen’s speech at the Economic Club of New York “The Outlook, Uncertainty, and Monetary Policy” reinforces the view that only gradual increases in the federal funds rate are likely.

In December, the Federal Open Market Committee (FOMC) raised the target range for the federal funds rate, the Federal Reserve’s main policy rate, by 1/4 percentage point. This small step marked the end of an extraordinary seven-year period during which the federal funds rate was held near zero to support the recovery from the worst financial crisis and recession since the Great Depression. The Committee’s action recognized the considerable progress that the U.S. economy had made in restoring the jobs and incomes of millions of Americans hurt by this downturn. It also reflected an expectation that the economy would continue to strengthen and that inflation, while low, would move up to the FOMC’s 2 percent objective as the transitory influences of lower oil prices and a stronger dollar gradually dissipate and as the labor market improves further. In light of this expectation, the Committee stated in December, and reiterated at the two subsequent meetings, that it “expects that economic conditions will evolve in a manner that will warrant only gradual increases in the federal funds rate.”

In my remarks today, I will explain why the Committee anticipates that only gradual increases in the federal funds rate are likely to be warranted in coming years, emphasizing that this guidance should be understood as a forecast for the trajectory of policy rates that the Committee anticipates will prove to be appropriate to achieve its objectives, conditional on the outlook for real economic activity and inflation. Importantly, this forecast is not a plan set in stone that will be carried out regardless of economic developments. Instead, monetary policy will, as always, respond to the economy’s twists and turns so as to promote, as best as we can in an uncertain economic environment, the employment and inflation goals assigned to us by the Congress.

The proviso that policy will evolve as needed is especially pertinent today in light of global economic and financial developments since December, which at times have included significant changes in oil prices, interest rates, and stock values. So far, these developments have not materially altered the Committee’s baseline–or most likely–outlook for economic activity and inflation over the medium term. Specifically, we continue to expect further labor market improvement and a return of inflation to our 2 percent objective over the next two or three years, consistent with data over recent months. But this is not to say that global developments since the turn of the year have been inconsequential. In part, the baseline outlook for real activity and inflation is little changed because investors responded to those developments by marking down their expectations for the future path of the federal funds rate, thereby putting downward pressure on longer-term interest rates and cushioning the adverse effects on economic activity. In addition, global developments have increased the risks associated with that outlook. In light of these considerations, the Committee decided to leave the stance of policy unchanged in both January and March.

I will next describe the Committee’s baseline economic outlook and the risks that cloud that outlook, emphasizing the FOMC’s commitment to adjust monetary policy as needed to achieve our employment and inflation objectives.