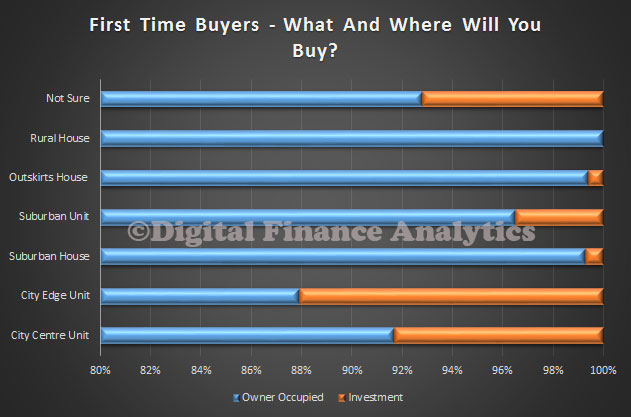
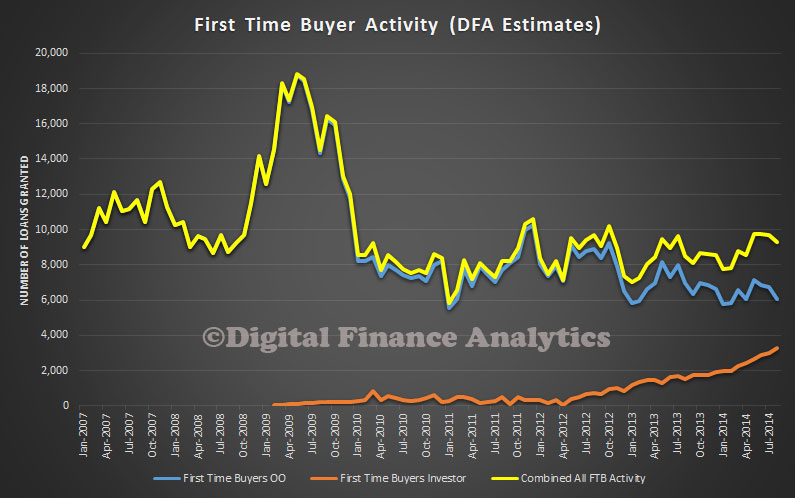
After the ABS data came out yesterday, DFA updated its industry models, and included the status of First Time Buyer Investors, at a state level. We had already shown that there were many First Time Buyers who were not able to buy an owner occupied property, and were switching the an investment alternative, as a way to enter the market, and hedge on future value growth. Here is the updated picture, incorporating the latest DFA data and ABS revisions.
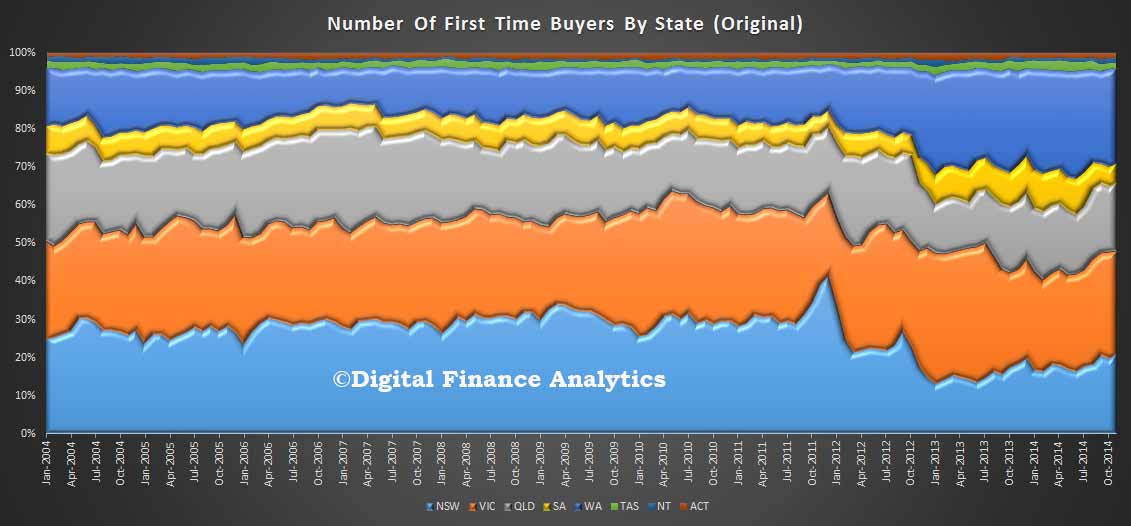
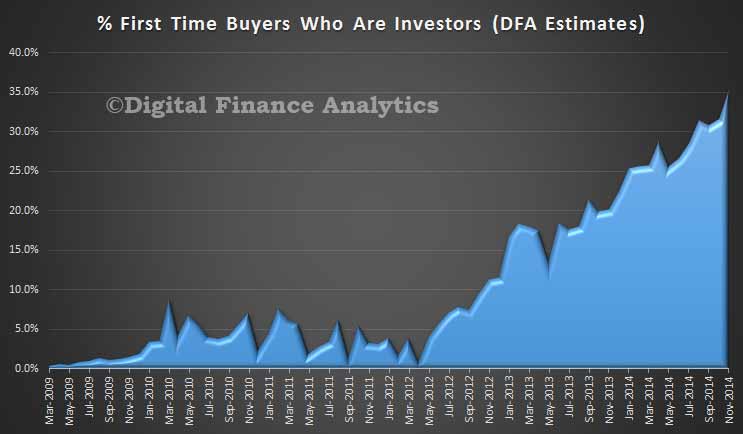
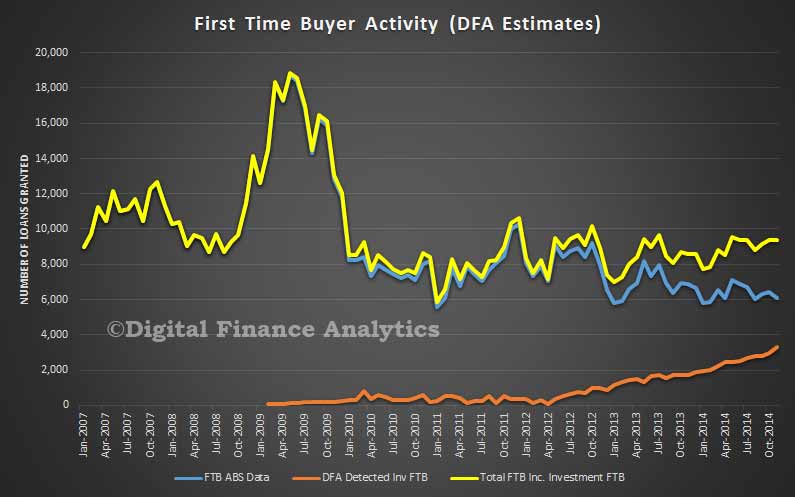
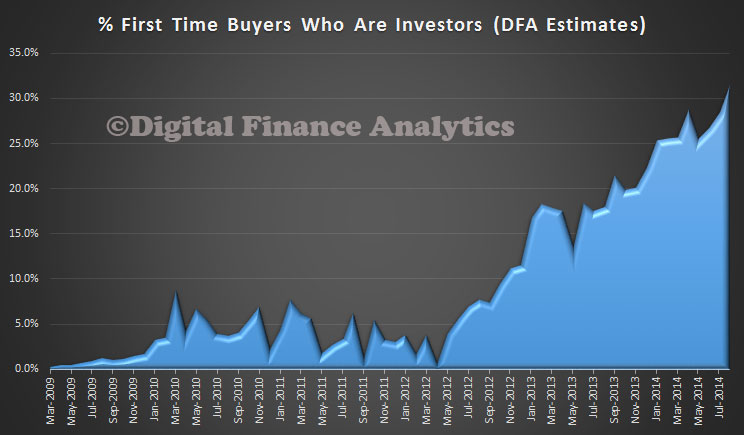
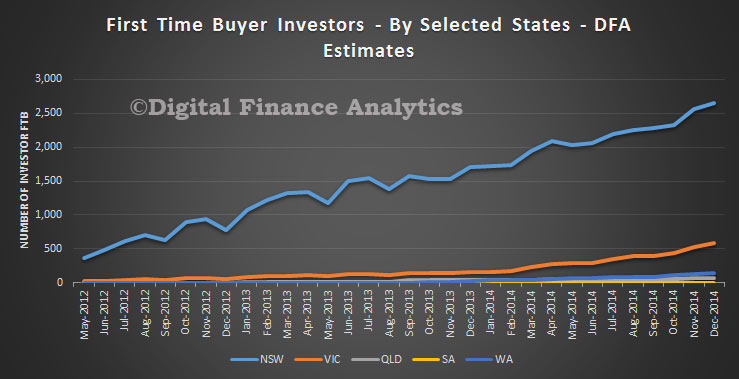
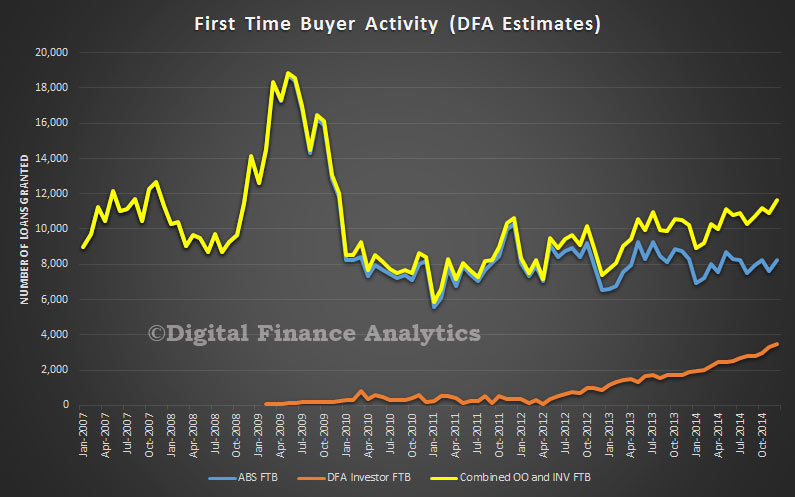 The number of Investor First Time Buyers continues to grow. Combined, the total number of First Time Buyers is rising, reflecting the momentum in the market. First Time Buyers are more active than thought, even if the ABS misses the Investor data. However, if we look at the state splits, we see that it is all NSW. There are a small number of FTB in the other states buying investment property, but it is mainly a NSW phenomenon at the moment, though we think it likely other states will follow suite.
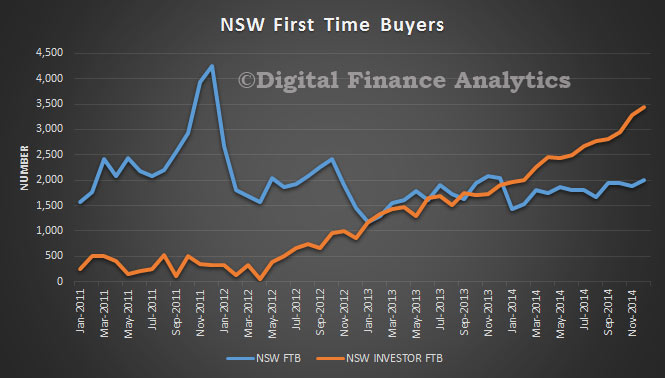
 In fact, if you look at the comparative data, we see that there are significantly more Investor First Time Buyers than Owner Occupied First Time Buyers in NSW. Around 2,000 owner occupied First Time Buyers, but 3,500 Investor First Time Buyers. We also found that close to 80% of these investors went for an interest only loan (for tax and serviceability reasons).
 Compare this with VIC, where the trend is just starting to take off. Again, in this small sample, interest only loans featured significantly.
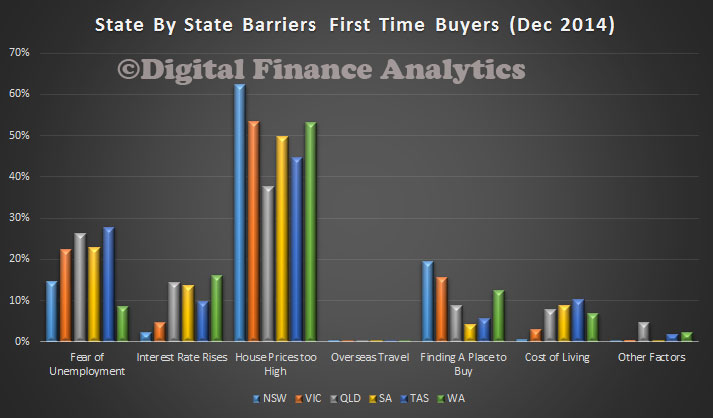
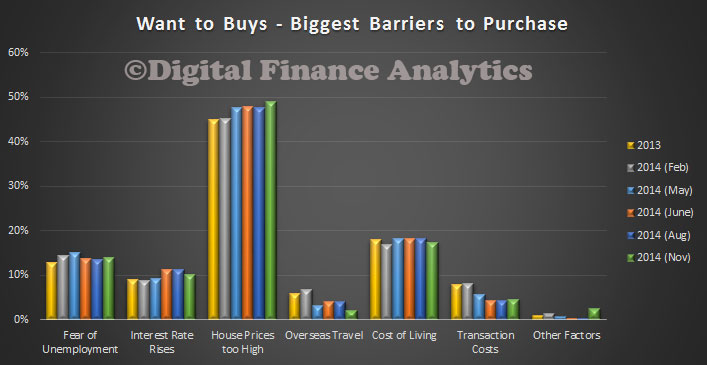
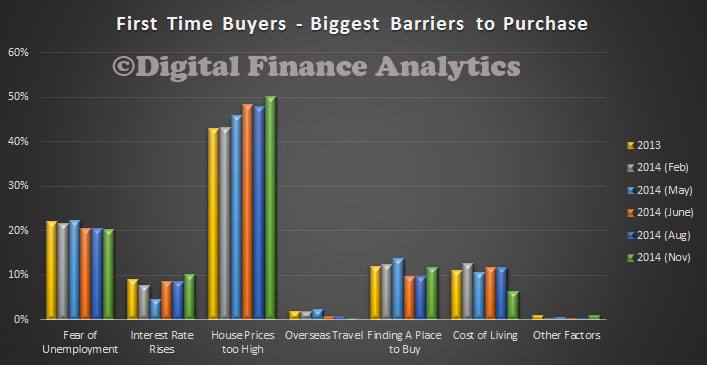
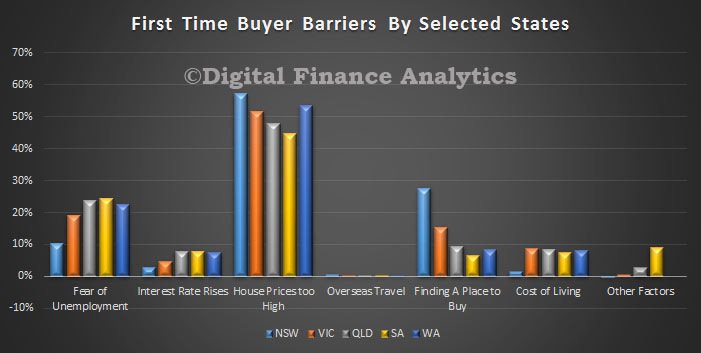
 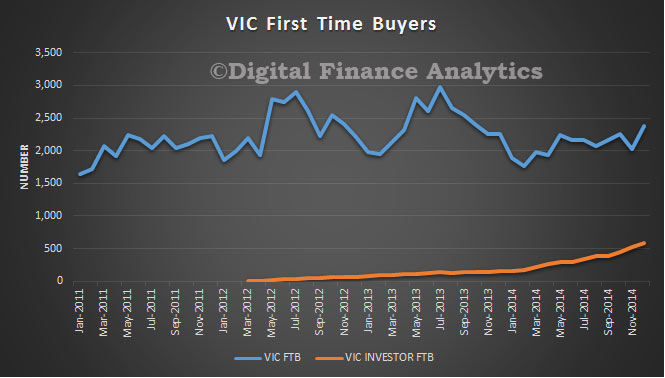 Finally, if we look at the latest First Time Buyer barriers to purchase data by selected state from our surveys, we see that in NSW, they are more concerned about high prices, and finding a place to buy compared with other states. On the other hand, fear of unemployment was lower than in all other states, whilst in figures more strongly in QLD, SA and WA. (WA attitudes are changing fast as the mining boom subsides).
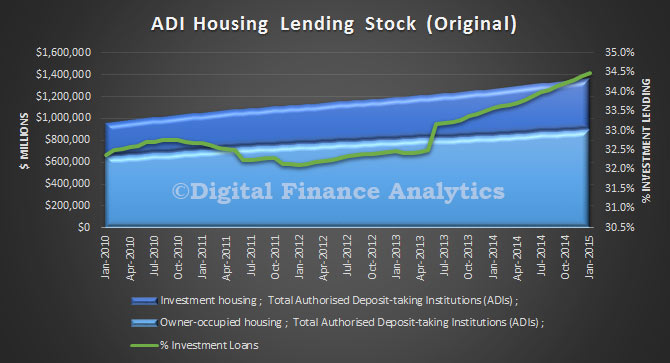
 So, one of the reasons for the growing of investment property lending, is the NSW led switch by First Time Buyers into the Investment Sector. From our surveys, we found that:
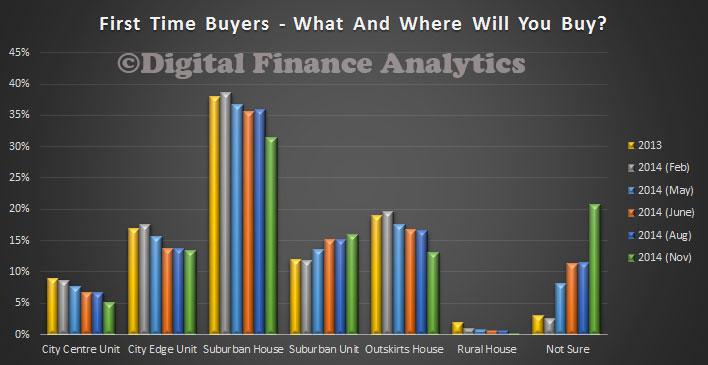
1. Most first time buyers were unable to afford to purchase a property to live in, in an area that made sense to them and were being priced out of the market.
2. However, many were anxious they were missing out on recent property gains, so decided to buy a less expensive property (often a unit) as an investment, thanks to negative gearing, they could afford it. They often continue to live at home meantime, hoping that the growth in capital could later be converted into a deposit for their own home – in other words, the investment property is an interim hedge into property, not a long term play. Some are also teaming up with friends to jointly purchase an investment, so spreading the costs.
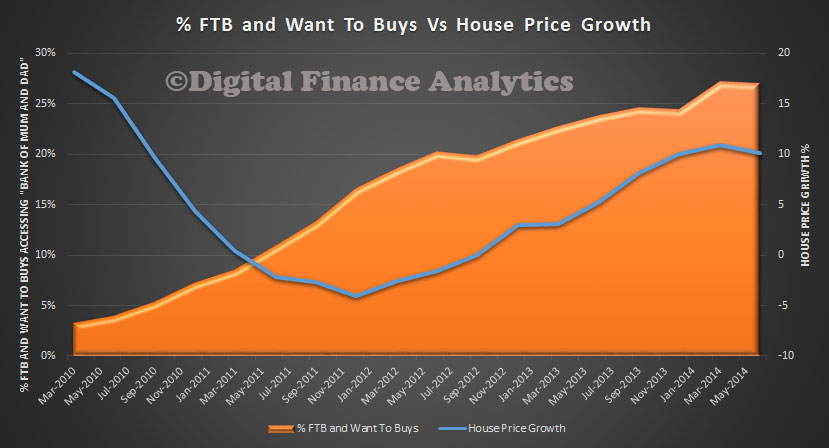
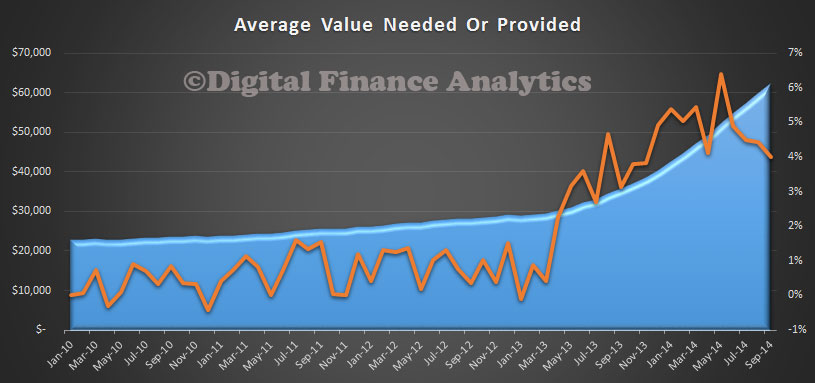
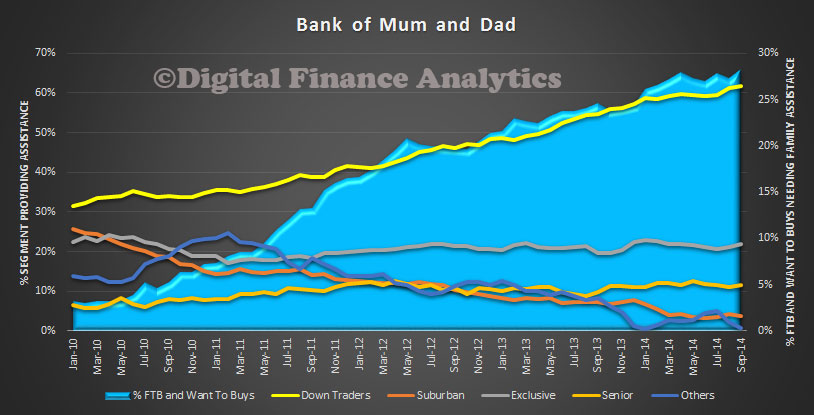
3. About one third who purchased were assisted by the Bank of Mum and Dad, see our earlier post. More would consider an investment property by accessing their superannuation for property investment purposes, a bad idea in our view.
Given the heady state of property prices at the moment, this growth in investment property by prospective first time buyers is on one hand logical, on the other quite concerning. We would also warn against increasing first time buyer incentives, as we discussed before.
Our analysis also highlights a deficiency in the ABS reporting, who are currently investigating the first time buyer statistics (because in some banks, first time buyers are identified by their application for a first owner grant alone). They should be tracking all first time buyer activity, not just those in the owner occupation category.
You can watch my earlier video blog on this subject here.

 Looking at the changes in volumes by type, we see that the purchase of existing dwellings is rising, but refinancing, construction of new dwellings and purchase of new dwellings are down.
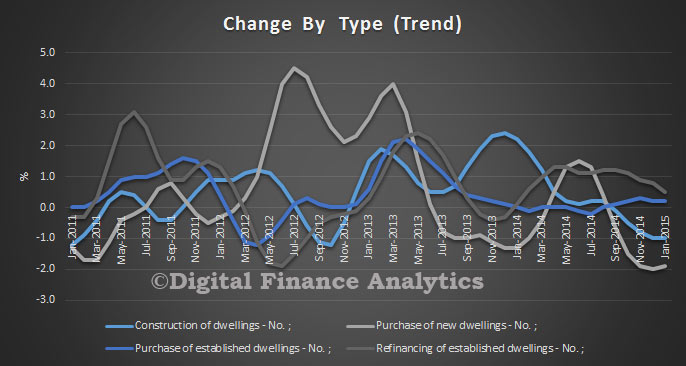 Looking across the states, momentum is rising in just two states, NSW and TAS. All other states are slowing.
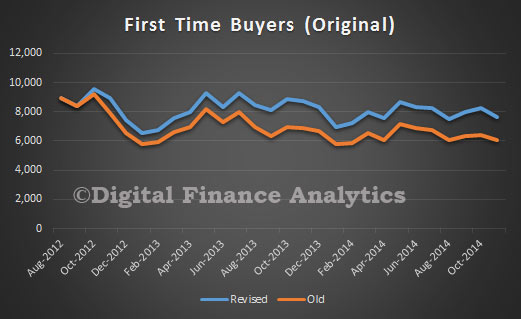
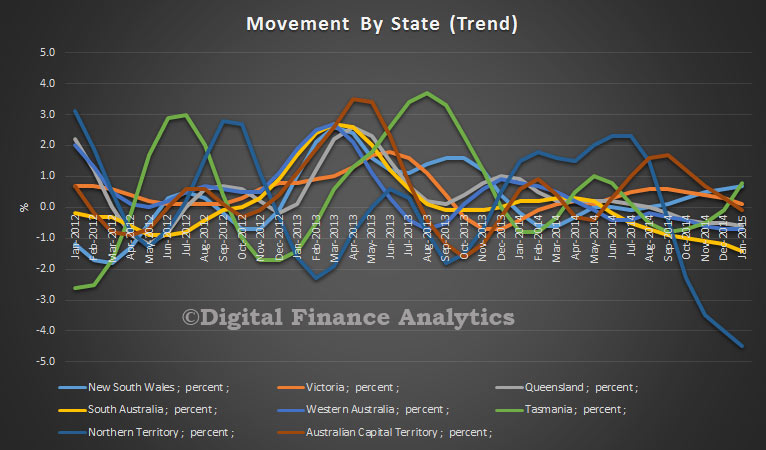 Turning to first time buyers, using the revised ABS data (method changed last month) and DFA survey data, we see that whilst first time buyers for owner occupation fell slightly (14.3% to 14.2% of all owner occupied loans), an additional 4,000 loans were written by first time buyers going direct to the investment sector. Much of this is centered on Sydney. As a result the cumulative first time buyer count is rising, with more than 21% of all loans effectively to first time buyers. You can read more analysis on this important trend here.
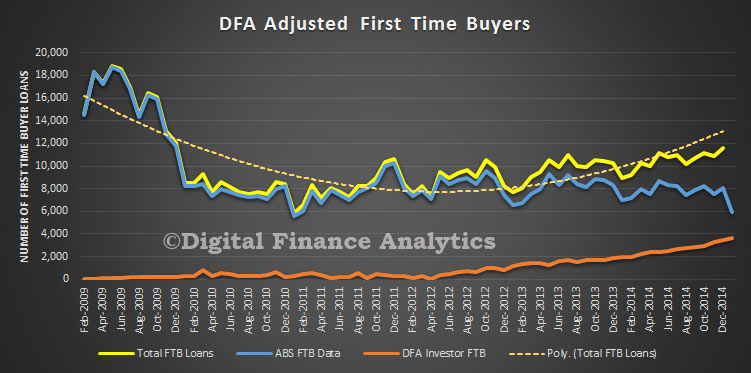 This is another reason why no further assistance should be offered to “help” first time buyers into the market. It would be a waste of money.