Housing Affordability Eases for Some

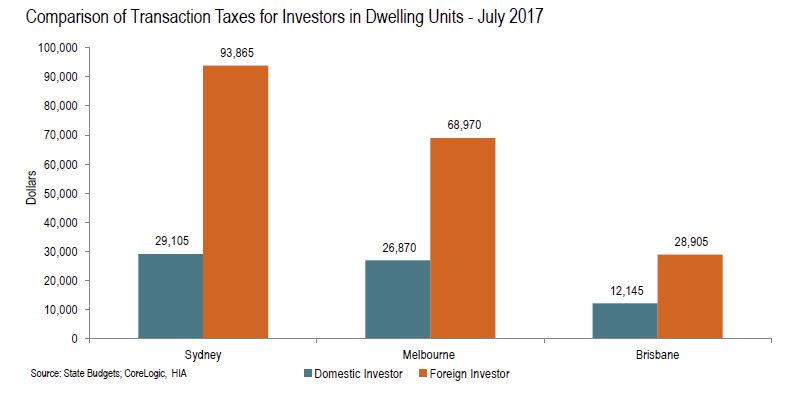
The HIA says that despite the poor levels of housing affordability there are signs of improvement for home-buyers. Investors are not so lucky.

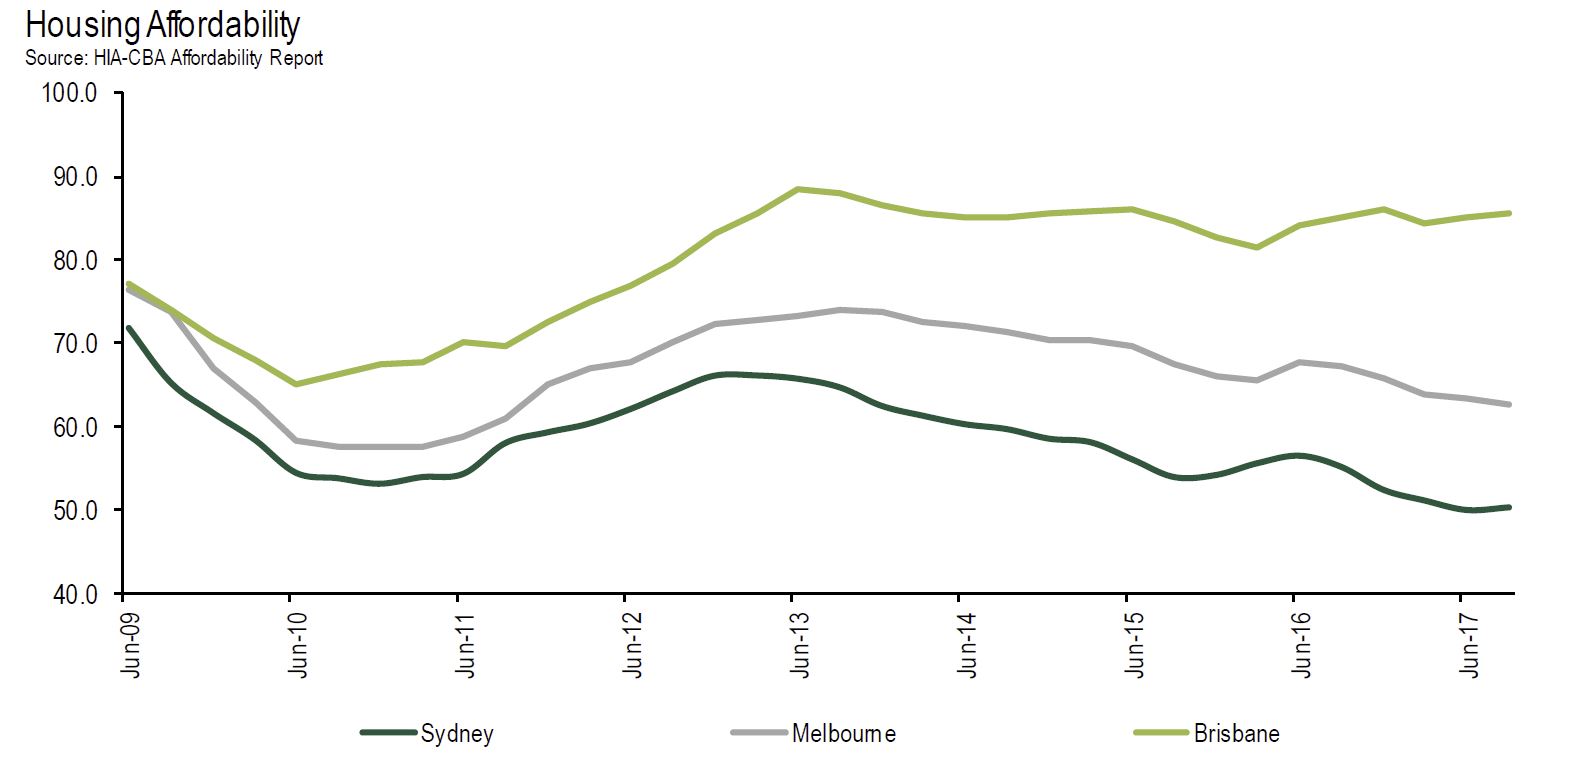
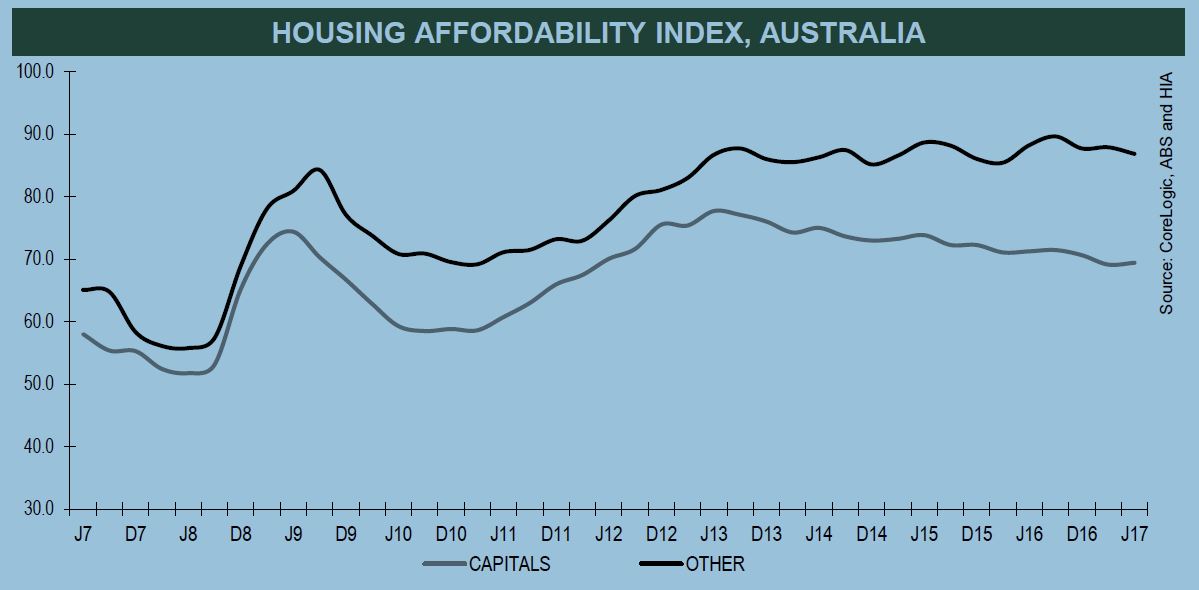
“The HIA Housing Affordability index for Australia improved by 0.5 per cent in the September 2017 quarter but still remains 4.4 per cent below the level recorded a year ago.

“Housing Affordability has been deteriorating in Australia for decades, particularly in capital cities, as demand for new housing greatly exceeded the supply.

“Recent interventions by the government, through APRA, to curb growth in investor activity may have improved affordability for owner-occupiers.

“As a consequence of this intervention it appears that the market has responded with higher mortgage rates for investors and eased rates for owner-occupiers.

“This has had the unintended consequence of improving housing affordability for owner-occupiers.

“Irrespective of intent, this is positive news for owner-occupier buyers in the affordability equation.

The HIA Affordability Index has been produced for more than 17 years using a range of recent data including wages, house prices and borrowing costs to provide an indication of the affordability of housing.

A higher index result signifies a more favourable affordability outcome.

“The Report’s regional analysis demonstrates the substantial differences in affordability conditions around the country,” added Mr Reardon.

“Sydney retains the mantle as the nation’s least affordable housing market despite the affordability index showing a modest improvement in affordability during the quarter. It still takes twice the average Sydney income to service a mortgage on a median priced home in Sydney while avoiding mortgage stress.

Brisbane, Adelaide, Perth and Darwin all recorded modest improvements in affordability in the September quarter. Melbourne, Hobart and Canberra each recorded a modest deterioration in affordability during the quarter.

New home sales lift in August – HIA

The HIA New Home Sales report – a monthly survey of the largest volume home builders in the five largest states – says for the three months to August compared with the same period last year, house sales in Victoria are 15.7 per cent higher and up by 9.2 per cent in South Australia. Over the same period, sales declined in Queensland (-7.3 per cent), WA (-15.4 per cent), NSW (-17.4 per cent) and Queensland (-37.9 per cent).

“New home sales increased by 9.1 per cent last month as a result of very strong results in Victoria and Western Australia, but over the year sales have continued to slow,” stated HIA’s Principal Economist, Tim Reardon.

“The jump in sales in July confirms our forecast of a slowdown in building activity through until 2018/19.

The increase in sales in August offsets larger declines in sales in recent months, but it is not sufficient to reverse the decline in sales that is evident since early 2016,” continued Mr Reardon.

“Results in July and August have been affected by government interventions in NSW and Victoria which have seen first home-buyers returning to the new home market.

“Victoria has seen record numbers of new building approvals and new home sales are continuing to drive even higher. Strong population growth and employment growth, fortified with enhanced first home buyer incentives, is prolonging the boom in building activity.”

“The trend in new home sales continues to provide a strong leading indicator of the trend in residential building approval figures from the ABS as can be seen in the chart below,” concluded Mr Reardon.

Building Approvals Rose In July

The number of dwellings approved rose 0.7 per cent in July 2017, in trend terms, and has risen for three months, according to data released by the Australian Bureau of Statistics (ABS) today.

Dwelling approvals increased in July in the Australian Capital Territory (8.8 per cent), Victoria (1.0 per cent), Western Australia (0.8 per cent), South Australia (0.8 per cent), New South Wales (0.4 per cent) and Queensland (0.2 per cent), but decreased in the Northern Territory (9.7 per cent) and Tasmania (1.0 per cent) in trend terms.

In trend terms, approvals for private sector houses rose 1.0 per cent in July. Private sector house approvals rose in Queensland (1.5 per cent), Victoria (1.1 per cent), South Australia (0.9 per cent) and New South Wales (0.8 per cent), but fell in Western Australia (0.1 per cent).

In seasonally adjusted terms, dwelling approvals decreased by 1.7 per cent in July, driven by a fall in private dwellings excluding houses (6.7 per cent), while private house approvals were flat.

The value of total building approved rose 1.3 per cent in July, in trend terms, and has risen for six months. The value of non-residential building rose 3.1 per cent while residential building was flat.

“The value of non-residential building approvals have risen for the past six months, in trend terms, reaching a record high in July 2017,” said Daniel Rossi, Director of Construction Statistics at the ABS.

“The strength in non-residential building has been driven by approvals in New South Wales and Victoria, where a number of office and education buildings have been approved in recent months.”

Commenting on the figures, the HIA said:

“Today’s building approval figures show that the detached house building sector has plateaued at a high level while the building of multi-unit projects is sliding, was confirmed by ABS data today,” stated Tim Reardon, HIA’s Principal Economist.

The ABS released July Building Approval data today which shows that the paths of detached and multiunit residential building continue to diverge as the industry’s contribution to GDP is set to fall.

“Multi-unit sector approvals fell by 3.3 per cent to be 27.5 per cent lower than twelve months ago while detached house building approvals remained constant over the year.

“Detached home approvals were 2.4 per cent better in July this year than compared with July 2016.

“The slowdown in the multi-unit sector is also showing up in the amount of work done on all residential sites has fallen by 3.2 per cent in the first half of this year, based on the construction data also released by ABS today.

“This slowdown in on-site activity is likely to see residential building have a negative impact on GDP growth for the June quarter.

“There is also significant variation in residential building conditions around the country.

“Compared with a year ago multi-unit approvals in July were down by 20 per cent or more in all the eastern states while movements in detached home approvals included a 9.6 per cent increase in South Australia to a fall of 8.7 per cent in Western Australia.

“The significant variation in industry conditions between the multi-unit sector and detached homes and around the states is likely to continue for some time consistent with HIA’s latest forecasts”, Mr Reardon concluded.

New Home Sales Decline In July

The HIA New Home Sales report – a monthly survey of the largest volume home builders in the five largest states – show that sales volumes declined by 3.7 per cent during July 2017 compared with June 2017. Sales for the first seven months of this year are 4.6 per cent lower than in the same period of 2016.

Sales of new detached houses during July 2017 fell by 0.4 per cent nationally to their lowest level since October 2014. Victoria was the only state to experience growth (+9.8 per cent). Detached house sales fell in South Australia (-16.2 per cent), Queensland (-16.1 per cent), Western Australia (-9.1 per cent) and New South Wales (-5.2 per cent) during the month.

“A drop in new apartment sales have contributed to the continuing decline in new home sales nationally since they peaked in mid 2015,” stated HIA’s Principal Economist, Tim Reardon.

“July’s result was driven by a 15.7 per cent decline in multi-unit sales and a more measured reduction in detached house sales. The large drop in multi-unit sales this month is in contrast to strong sales volumes late in 2016 and early 2017,” outlined Mr Reardon.

“This trend is consistent with HIA’s expectation that activity will decline modestly from these record high levels over a number of years,” added Mr Reardon.

“Victoria was the notable exception – as the only state to grow sales during July 2017. Sales were up by 9.8 per cent on what is already a very high level of activity.

“On the other hand, the Western Australian Government’s First Home Buyers grant ended on 30 June 2017 and as a consequence sales in July fell sharply from what was already a very low base.

The Housing Magic Bullet May Be Shot

The HIA suggests the housing sector will become less of an economic driver of the Australian economy, and also underscores the various regulatory interventions from state taxes, to limiting foreign investment and investor lending.

Another plank in the argument that the housing party is over, leaving households with a mighty debt driven hangover.

According to the HIA, the Winter 2017 edition of the HIA’s National Outlook Report discusses the downturn in building activity that started in March 2016 and forecasts the length and depth of the cycle. It also highlights the role foreign investment plays in growing housing stock in Australia.


“The housing sector has already stepped back from its role driving the Australian economy and now is not the time for governments to hit the industry with punitive charges,” warned Tim Reardon, HIA’s Principal Economist.

“Government interventions into the market so far include: state governments imposing punitive Stamp Duty charges on foreign investors, Federal charges for foreign investors, a new set of visa rules that could slow overseas migration, restricting lending to domestic investors and new regulations limiting interest only lending.

“The Chinese government has also imposed restrictions on capital leaving the country which may have a significant impact on Australian home building.

“Foreign investors have been attracted to the Australian housing market and they have been investing billions annually in the construction of new residential dwellings.

“These investors have contributed to activity and employment in metropolitan areas building the supply of new housing stock and easing pressure on rental markets.

“Governments of all jurisdictions should proceed with caution when imposing new punitive measures on this segment of the market.

“Foreign capital is highly mobile and if it is forced from the market rapidly it could accelerate the downturn in the sector unnecessarily.

“A number of state governments have recently hit foreign investors with punitive charges.

“The Australian Government has also imposed additional regulations that will impact on investors in the sector.

“The HIA is forecasting that building activity will decline modestly – from record highs – over a number of years, consistent with typical cyclical trends in the industry. Activity will bottom out in 2019 with activity still at solid levels.

“There is a risk – if uncoordinated and poorly considered policies are introduced to curb foreign investment – that the decline in activity in the sector will be accelerated,” Mr Reardon concluded.

Foreign Investors in Sydney paying almost four times as much stamp duty as locals

The HIA says recent changes to stamp duty in NSW mean that foreign investors now pay almost $100,000 in transaction taxes to acquire a standard apartment in Sydney – almost four times as much as local buyers.

This remarkable finding is contained in the latest Stamp Duty Watch report which has just been released by the Housing Industry Association.

The average stamp duty bill in Australia paid by resident owner occupiers is also up by 16.4 per over the year to $20,725, even though dwelling prices increased by just 10.5 per cent .

On the owner occupier side, stamp duty drains family coffers of $107 each and every month over a 30-year mortgage term. For owner occupiers, the typical stamp duty bill now amounts to $20,725 – an increase of some 16.4 per cent on a year ago.

Shelling out so much in stamp duty drains the household piggy bank of vital funds for their home deposit. Families are then forced to take out larger mortgages and incur heavier mortgage insurance premiums.

Foreign investors are a vital component of rental supply in cities like Sydney and Melbourne. With rental market conditions now so tight in Australia’s two biggest cities, should we really be placing more and more barriers in the way of new supply?

New Home Sales Crash

New home sales in Australia’s largest states hit their lowest level since October 2013 with sales sliding in both the detached house and multi-unit sides of the market according to the latest HIA New Home Sales Report.

HIA says during June, new home sales declined by 6.9 per cent compared with the previous month and were 11.9 per cent lower than the same period last year.

The reduction in new home sales during June 2017 was comprised of a 5.8 per cent reduction in new detached house sales and a 10.7 per cent fall in new multi-unit sales.

There were considerable differences in sales in June around the states with new detached house sales rising both in Victoria (+4.1 per cent) and Western Australia (+21.1 per cent). However, sales fell in New South Wales (-9.7 per cent), Queensland (-29.3 per cent) and South Australia (-23.7 per cent) during the month.

“These results support HIA’s latest set of forecasts that new dwelling commencements are set to continue easing until late 2018″. explained HIA Senior Economist Shane Garrett.

“The reduction in sales of both detached houses and multi-units during the month of June continues the trend underway since sales peaked in early 2015.

“The fall in sales needs to be considered against the backdrop of residential building coming off a record peak of activity in 2016. We project that residential building will still be operating at a historically high level,” concluded Shane Garrett.


Housing Affordability Declines Further

HIA’s Affordability Index shows Housing affordability in Australia continued to decline in the June quarter this year. This is largely due to a rise in the median dwelling price of 9.1% per cent to a record high of $540,200.

The HIA Affordability Index is produced quarterly and uses a range of data to including wages, house prices and borrowing costs to provide an indication of the affordability of housing. A higher index result signifies a more favourable affordability outcome.

The growth in house prices in the quarter outstripped the growth in wages resulting in the deterioration in affordability. As a consequence of these factors the Affordability index for Australia dropped by 0.3 per cent in the June 2017 quarter.

NSW was the most significant negative influence on this result with affordability in Sydney now declining past a critical level (Sydney, – 0.7% and the rest of NSW, – 2.2 per cent). Acquiring and servicing a mortgage on a house in Sydney now requires more than two standard Sydney incomes. Sydney is the only market to have achieved this outcome in the 15 year history of this report.

Affordability in Melbourne improved marginally in the quarter but remains 6.0 per cent less affordable than this time last year.

On the positive side, during the June 2017 quarter, affordability improved in six of the eight capital cities. The largest improvement occurred in Darwin (+4.3 per cent), followed by Adelaide (+2.9 per cent), Hobart (+1.6 per cent), Brisbane (+1.0 per cent), Canberra (+0.8 per cent) and Melbourne (+0.8 per cent).

Of the capitals where affordability worsened, the biggest deterioration was in Perth (-1.3 per cent) and Sydney (-0.7 per cent). The Perth deterioration in affordability appears to contradict the soft conditions in that market but the fall in average wages in Perth in the quarter outweighed the positive impact on affordability from the falls in home prices.

Housing Starts Set To Fall – HIA

Today’s Autumn 2017 edition of the HIA’s National Outlook Report discusses how the number of new dwelling commencements nationally is likely to continue to decline – last year’s record levels of activity are unlikely to be seen again until well into the 2020s.

HIA expects that 221,500 new dwellings will have been started in 2016/17, a decline of 4.5 per cent compared with the previous year. A further reduction of 10.7 per cent is forecast for 2017/18 before new home starts bottom out at 176,670 during 2018/19.

“Having touched record levels during 2016, the latest edition of the Housing Industry Association’s flagship forecasting report predicts that new home building starts are set to move lower over the remainder of 2017,” explained HIA Senior Economist, Shane Garrett.

“The housing boom was not consistent across Australia and now with NSW and Victoria cooling, all indicators are that the market is well past its 2016 peak when over 231,000 new homes were commenced.

“Solid population growth, very low interest rates and consistent gains in employment do mask some concerning trends with respect to under-employment and decelerating GDP growth. Combined with another layer of obstacles to foreign investor participation in the housing market, new home building volumes are set to move downwards over the next couple of years.

“Even though new dwelling starts will decline over the next couple of years, the annual volume of new home starts is not likely to fall below 170,000 at any stage. By any standard, this is still a very robust level of activity.

“The investor side of the market has also been hit by tighter lending finance due to APRA’s recent restrictions on interest-only mortgages.

“The multi-unit side of the market is expected to drive the downturn in residential building, with commencements on this side of the market projected to fall by 41 per cent from peak to trough,” stated Mr Garrett concluded.

According to today’s HIA National Outlook Report, the volume of renovations work is anticipated to grow by 2.0 per cent during both 2017/18 and 2018/19. The pace of growth is expected to pick up the following year (+2.7 per cent) bringing the value of the Australian renovations market to $34.31 billion during the 2019/20 year.

Here’s where housing construction is booming in Australia

From Business Insider and HIA.

Australia has been on an epic residential building boom in recent years, constructing more homes than ever before in the 2015/16 financial year.

And nowhere has this been more evident than in the locations listed below.

Courtesy of Australia’s Housing Industry Association (HIA), it shows Australia’s top 20 residential building “hotspots” for the 2015/16 financial year.

Here’s the list released in a report from the group over the weekend.

Source: HIA

The HIA deems a “hotspot” to be a region where population grew above the 1.4% national average and where at least $150 million worth of residential building was approved during the year.

Perhaps unsurprisingly, the group found that nine of the top 20 Hotspots were in New South Wales, with a further four and three located in Victoria and Queensland resectively.

And many of those were in inner-city regions, courtesy of an unprecedented level of apartment construction in these locations.

Pimpama, sandwiched between the Gold Coast and Brisbane in Southeast Queensland, was deemed to be the hottest of the hotspots in the 2015/16 financial year, logging population growth of 35.1% with $340.2 million worth of dwellings approved.

Cobitty-Leppington in Sydney’s Southwestern fringe, along with Palmerston in Darwin, took out second and third spots respectively.

Inner-city locations such as Docklands and Southbank in Melbourne, and Waterloo-Beaconsfield in Sydney, also made the top ten list.

While residential building activity across the broader Australian economy looks set to slow in the years ahead — building approvals have been trending lower, particularly for apartments, while the value of residential construction work done in the March quarter of this year fell — the HIA is forecasting that the decline will be modest, leaving total residential construction at elevated levels.

“Even though new dwelling starts will decline over the next couple of years, the annual volume of new home starts is not likely to fall below 173,000 at any stage,” the group said in early March this year.

“By any standard, this is still a very robust level of activity.”

Source: HIA